Creek County, Oklahoma
| Creek County, Oklahoma | |
|---|---|
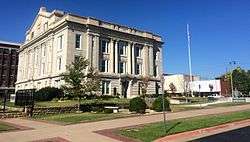 Creek County Courthouse, Sapulpa in 2014 | |
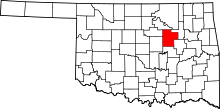 Location in the U.S. state of Oklahoma | |
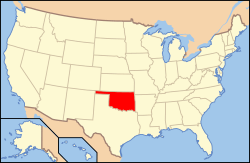 Oklahoma's location in the U.S. | |
| Founded | 1907 |
| Named for | Creek Nation |
| Seat | Sapulpa |
| Largest city | Sapulpa |
| Area | |
| • Total | 970 sq mi (2,512 km2) |
| • Land | 950 sq mi (2,460 km2) |
| • Water | 20 sq mi (52 km2), 2.0% |
| Population (est.) | |
| • (2013) | 70,470 |
| • Density | 74/sq mi (29/km2) |
| Congressional districts | 1st, 3rd |
| Time zone | Central: UTC−6/−5 |
| Website |
www |
Creek County is a county located in the U.S. state of Oklahoma. As of the 2010 census, the population was 69,967.[1] Its county seat is Sapulpa.[2]
Creek County is part of the Tulsa, OK Metropolitan Statistical Area.
History
European explorers traveled through this area early in the 19th Century, after the Louisiana Purchase. In 1825, the Osage Nation ceded the territory where the Federal Government planned to resettle the Creek Nation and other tribes after their expulsion from the Southeastern part of the United States. The Creeks began migrating into this area, where they and their black slaves settled to begin farming and raising cattle. In 1835, Federal soldiers under Captain J. L. Dawson built the Dawson Road, following an old Osage hunting trail.[3]
Railroads gave an important boost to the local economy. In 1886, the Atlantic and Pacific Railroad built a line from Red Fork to Sapulpa. In 1898, the St. Louis and Oklahoma City Railway connected Sapulpa and Oklahoma City.[3]
The present Creek County was established at the time of statehood, with a population of 18,365. The town of Sapulpa was initially designated as the county seat. This decision was challenged by supporters of the town of Bristow. An election held August 12, 1908 to choose a permanent seat was won by Sapulpa, but the dispute did not end there. After a series of court cases, the Oklahoma Supreme Court ruled in favor of Sapulpa on August 1, 1913.[3]
After oil was discovered at Glenn Pool in adjacent Tulsa County in 1905, other strikes occurred in Creek County. The Cushing-Drumright Oil Field opened in 1912, creating boom towns Drumright, Kiefer and Oilton. By 1920, the county population had increased to 62,480.[3]
Geography
According to the U.S. Census Bureau, the county has a total area of 970 square miles (2,500 km2), of which 950 square miles (2,500 km2) is land and 20 square miles (52 km2) (2.0%) is water.[4] It is drained by the Cimarron River, and the Deep Fork and Little Deep Fork of the North Canadian River. Heyburn Lake is contained within the County. Keystone Lake is partially within Creek County.[3]
Major highways
Adjacent counties
- Pawnee County (north)
- Tulsa County (east)
- Okmulgee County (southeast)
- Okfuskee County (south)
- Lincoln County (west)
- Payne County (northwest)
Demographics
| Historical population | |||
|---|---|---|---|
| Census | Pop. | %± | |
| 1910 | 26,223 | — | |
| 1920 | 62,480 | 138.3% | |
| 1930 | 64,115 | 2.6% | |
| 1940 | 55,503 | −13.4% | |
| 1950 | 43,143 | −22.3% | |
| 1960 | 40,495 | −6.1% | |
| 1970 | 45,532 | 12.4% | |
| 1980 | 59,016 | 29.6% | |
| 1990 | 60,915 | 3.2% | |
| 2000 | 67,317 | 10.5% | |
| 2010 | 69,967 | 3.9% | |
| Est. 2016 | 71,312 | [5] | 1.9% |
| U.S. Decennial Census[6] 1790-1960[7] 1900-1990[8] 1990-2000[9] 2010-2013[1] | |||
As of the census[10] of 2000, there were 67,367 people, 25,289 households, and 19,017 families residing in the county. The population density was 70 people per square mile (27/km²). There were 27,986 housing units at an average density of 29 per square mile (11/km²). The racial makeup of the county was 82.27% White, 2.56% Black or African American, 9.08% Native American, 0.27% Asian, 0.03% Pacific Islander, 0.63% from other races, and 5.16% from two or more races. 1.90% of the population were Hispanic or Latino of any race.
There were 25,289 households out of which 34.80% had children under the age of 18 living with them, 60.10% were married couples living together, 10.90% had a female householder with no husband present, and 24.80% were non-families. 21.60% of all households were made up of individuals and 9.40% had someone living alone who was 65 years of age or older. The average household size was 2.64 and the average family size was 3.06.
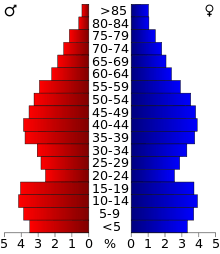
In the county, the population was spread out with 27.40% under the age of 18, 8.00% from 18 to 24, 27.30% from 25 to 44, 24.50% from 45 to 64, and 12.80% who were 65 years of age or older. The median age was 37 years. For every 100 females, there were 96.00 males. For every 100 females age 18 and over, there were 92.90 males.
The median income for a household in the county was $33,168, and the median income for a family was $38,470. Males had a median income of $31,190 versus $21,690 for females. The per capita income for the county was $16,191. About 8% of families and 13.50% of the population were below the poverty line, including 17.20% of those under age 18 and 14.10% of those age 65 or over.
Politics
| Voter Registration and Party Enrollment as of January 15, 2018[11] | |||||
|---|---|---|---|---|---|
| Party | Number of Voters | Percentage | |||
| Democratic | 11,868 | 31.54% | |||
| Republican | 20,624 | 54.81% | |||
| Others | 5,133 | 13.41% | |||
| Total | 37,625 | 100% | |||
| Year | Republican | Democratic | Third parties |
|---|---|---|---|
| 2016 | 74.8% 21,575 | 20.3% 5,841 | 4.9% 1,414 |
| 2012 | 72.7% 18,986 | 27.3% 7,128 | |
| 2008 | 70.8% 20,187 | 29.2% 8,318 | |
| 2004 | 65.5% 18,848 | 34.5% 9,929 | |
| 2000 | 57.2% 13,580 | 41.1% 9,753 | 1.7% 408 |
| 1996 | 43.9% 9,861 | 43.1% 9,674 | 13.0% 2,922 |
| 1992 | 39.8% 10,055 | 36.1% 9,118 | 24.0% 6,065 |
| 1988 | 53.9% 11,308 | 45.3% 9,512 | 0.8% 162 |
| 1984 | 66.3% 15,011 | 33.0% 7,465 | 0.7% 152 |
| 1980 | 59.6% 11,749 | 37.2% 7,339 | 3.3% 641 |
| 1976 | 48.1% 8,458 | 51.0% 8,964 | 1.0% 169 |
| 1972 | 75.1% 12,396 | 22.5% 3,705 | 2.4% 402 |
| 1968 | 43.3% 6,934 | 32.2% 5,151 | 24.5% 3,913 |
| 1964 | 39.3% 6,355 | 60.8% 9,836 | |
| 1960 | 58.6% 8,785 | 41.4% 6,205 | |
| 1956 | 53.9% 8,295 | 46.1% 7,102 | |
| 1952 | 51.2% 9,257 | 48.8% 8,818 | |
| 1948 | 41.5% 6,532 | 58.5% 9,198 | |
| 1944 | 47.4% 7,549 | 52.4% 8,342 | 0.3% 41 |
| 1940 | 46.2% 9,468 | 53.6% 10,976 | 0.3% 51 |
| 1936 | 36.5% 7,257 | 63.0% 12,540 | 0.5% 106 |
| 1932 | 34.4% 6,786 | 65.6% 12,963 | |
| 1928 | 67.9% 12,254 | 31.6% 5,693 | 0.5% 95 |
| 1924 | 50.2% 8,894 | 45.0% 7,969 | 4.8% 851 |
| 1920 | 56.9% 7,948 | 38.7% 5,408 | 4.4% 618 |
| 1916 | 36.9% 2,820 | 45.8% 3,496 | 17.3% 1,323 |
| 1912 | 41.5% 1,902 | 36.7% 1,681 | 21.8% 996 |
Communities
Cities
- Bristow
- Drumright (partly in Payne County)
- Mannford
- Oilton
- Sapulpa (county seat) (partly in Tulsa County)
- Stroud
Towns
Census-designated place
- Oakhurst (partly in Tulsa County)
Other unincorporated communities
NRHP Sites
References
- 1 2 "State & County QuickFacts". United States Census Bureau. Retrieved November 8, 2013.
- ↑ "Find a County". National Association of Counties. Archived from the original on 2011-05-31. Retrieved 2011-06-07.
- 1 2 3 4 5 Linda D. Wilson, "Creek County." Encyclopedia of Oklahoma History and Culture.
- ↑ "2010 Census Gazetteer Files". United States Census Bureau. August 22, 2012. Retrieved February 19, 2015.
- ↑ "Population and Housing Unit Estimates". Retrieved June 9, 2017.
- ↑ "U.S. Decennial Census". United States Census Bureau. Archived from the original on May 12, 2015. Retrieved February 19, 2015.
- ↑ "Historical Census Browser". University of Virginia Library. Retrieved February 19, 2015.
- ↑ Forstall, Richard L., ed. (March 27, 1995). "Population of Counties by Decennial Census: 1900 to 1990". United States Census Bureau. Retrieved February 19, 2015.
- ↑ "Census 2000 PHC-T-4. Ranking Tables for Counties: 1990 and 2000" (PDF). United States Census Bureau. April 2, 2001. Retrieved February 19, 2015.
- ↑ "American FactFinder". United States Census Bureau. Archived from the original on 2013-09-11. Retrieved 2008-01-31.
- ↑ https://www.ok.gov/elections/documents/20180115%20-%20Registration%20By%20County%20%28vr2420%29.pdf
- ↑ Leip, David. "Dave Leip's Atlas of U.S. Presidential Elections". uselectionatlas.org. Retrieved 2018-03-28.
External links
- www.creekcountyonline.com The official county government website
- Encyclopedia of Oklahoma History and Culture - Creek County
- Oklahoma Digital Maps: Digital Collections of Oklahoma and Indian Territory
Places adjacent to Creek County, Oklahoma | |
|---|---|
Municipalities and communities of Creek County, Oklahoma, United States | ||
|---|---|---|
| Cities | | |
| Towns | ||
| CDP | ||
| Unincorporated communities | ||
| Ghost town | ||
| Footnotes | ‡This populated place also has portions in an adjacent county or counties | |
| Counties |  | |
|---|---|---|
| Principal city | ||
| Cities over 20k | ||
| Cities 10k-20k | ||
| Cities 5k-10k | ||
| Cities and towns 1k-5k | ||