Marshall County, Oklahoma
| Marshall County, Oklahoma | |
|---|---|
.jpg) Marshall County Courthouse | |
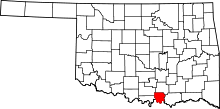 Location in the U.S. state of Oklahoma | |
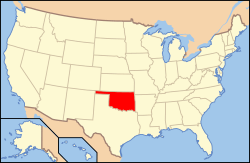 Oklahoma's location in the U.S. | |
| Founded | 1907 |
| Seat | Madill |
| Largest city | Madill |
| Area | |
| • Total | 427 sq mi (1,106 km2) |
| • Land | 371 sq mi (961 km2) |
| • Water | 56 sq mi (145 km2), 13% |
| Population (est.) | |
| • (2013) | 15,988 |
| • Density | 43/sq mi (17/km2) |
| Congressional district | 2nd |
| Time zone | Central: UTC−6/−5 |
| Website |
marshall |
Marshall County is a county located on the south central border of Oklahoma. As of the 2010 census, the population was 15,840.[1] Its county seat is Madill.[2] The county was created at statehood in 1907 from the former Pickens County of the Chickasaw Nation. It was named to honor the maiden name of the mother of George Henshaw, a member of the 1906 Oklahoma Constitutional Convention.[3] The county and its cities are part of the Texoma region.
History
The area covered by Marshall County was part of the territory set aside by the U.S. government for resettlement of the Choctaw tribe and the closely related Chickasaw tribe from their lands in the southeastern United States. The Chickasaws began relocating to this area in 1837. The U.S. Army built Fort Washita in 1842 to protect the new arrivals from raids by other tribes. In 1857, the Chickasaw Nation formally separated from the Choctaw Nation. This area became part of Pickens County in the Chickasaw Nation.[3]
Railroads came to the present-day Marshall County in 1901, when the St. Louis, Oklahoma and Southern Railway (acquired shortly after by the St. Louis and San Francisco Railway), known as the Frisco, constructed a north-south line. The following year, the St. Louis, San Francisco and New Orleans Railroad (formerly the Arkansas and Choctaw Railway) laid tracks from east to west through the area. This line was sold to the Frisco in 1907. The State of Oklahoma relocated part of this line in 1941 to make way for the creation of Lake Texoma.[3]
Geography
According to the U.S. Census Bureau, the county has a total area of 427 square miles (1,110 km2), of which 371 square miles (960 km2) is land and 56 square miles (150 km2) (13%) is water.[4] It is the smallest county in Oklahoma by land area and the third-smallest by total area. The Red River drains the county and formed the county's southern boundary. Completion of the Denison Dam in 1942 created Lake Texoma which inundated part of Marshall County's land area and forms the current southern boundary and the eastern boundary of the county as well.[3]
Major highways
Adjacent counties
- Johnston County (north)
- Bryan County (east)
- Grayson County, Texas (south)
- Love County (west)
- Carter County (northwest)
National protected area
Demographics
| Historical population | |||
|---|---|---|---|
| Census | Pop. | %± | |
| 1910 | 11,619 | — | |
| 1920 | 14,674 | 26.3% | |
| 1930 | 11,026 | −24.9% | |
| 1940 | 12,384 | 12.3% | |
| 1950 | 8,177 | −34.0% | |
| 1960 | 7,263 | −11.2% | |
| 1970 | 7,682 | 5.8% | |
| 1980 | 10,550 | 37.3% | |
| 1990 | 10,829 | 2.6% | |
| 2000 | 13,184 | 21.7% | |
| 2010 | 15,840 | 20.1% | |
| Est. 2016 | 16,191 | [5] | 2.2% |
| U.S. Decennial Census[6] 1790-1960[7] 1900-1990[8] 1990-2000[9] 2010-2013[1] | |||

As of the census[10] of 2000, there were 13,184 people, 5,371 households, and 3,802 families residing in the county. The population density was 36 people per square mile (14/km²). There were 8,517 housing units at an average density of 23 per square mile (9/km²). The racial makeup of the county was 77.99% White, 1.84% Black or African American, 9.10% Native American, 0.19% Asian, 0.01% Pacific Islander, 6.17% from other races, and 4.71% from two or more races. 8.60% of the population were Hispanic or Latino of any race.
There were 5,371 households out of which 27.30% had children under the age of 18 living with them, 58.10% were married couples living together, 8.80% had a female householder with no husband present, and 29.20% were non-families. 26.40% of all households were made up of individuals and 14.50% had someone living alone who was 65 years of age or older. The average household size was 2.40 and the average family size was 2.87.
In the county, the population was spread out with 23.50% under the age of 18, 7.50% from 18 to 24, 24.10% from 25 to 44, 25.50% from 45 to 64, and 19.50% who were 65 years of age or older. The median age was 41 years. For every 100 females there were 96.50 males. For every 100 females age 18 and over, there were 93.60 males.
The median income for a household in the county was $26,437, and the median income for a family was $31,825. Males had a median income of $25,201 versus $19,932 for females. The per capita income for the county was $14,982. About 13.50% of families and 17.90% of the population were below the poverty line, including 24.10% of those under age 18 and 15.30% of those age 65 or over.
Politics
| Voter Registration and Party Enrollment as of January 15, 2018[11] | |||||
|---|---|---|---|---|---|
| Party | Number of Voters | Percentage | |||
| Democratic | 3,745 | 48.09% | |||
| Republican | 2,913 | 37.41% | |||
| Unaffiliated | 1,129 | 14.50% | |||
| Total | 7,787 | 100% | |||
| Year | Republican | Democratic | Third Parties |
|---|---|---|---|
| 2016 | 76.6% 4,206 | 20.0% 1,096 | 3.5% 190 |
| 2012 | 72.8% 3,744 | 27.2% 1,396 | |
| 2008 | 69.4% 3,730 | 30.6% 1,643 | |
| 2004 | 61.7% 3,363 | 38.3% 2,088 | |
| 2000 | 53.9% 2,641 | 45.1% 2,210 | 1.0% 49 |
| 1996 | 32.7% 1,605 | 53.4% 2,624 | 13.9% 684 |
| 1992 | 26.9% 1,478 | 45.8% 2,519 | 27.3% 1,501 |
| 1988 | 40.9% 1,911 | 58.5% 2,730 | 0.6% 28 |
| 1984 | 54.6% 2,488 | 44.7% 2,039 | 0.7% 33 |
| 1980 | 46.8% 1,961 | 51.4% 2,157 | 1.8% 77 |
| 1976 | 31.4% 1,358 | 68.0% 2,939 | 0.6% 27 |
| 1972 | 65.4% 2,273 | 32.0% 1,113 | 2.6% 91 |
| 1968 | 35.7% 1,209 | 35.2% 1,191 | 29.1% 986 |
| 1964 | 32.2% 1,101 | 67.8% 2,318 | |
| 1960 | 42.5% 1,325 | 57.5% 1,793 | |
| 1956 | 35.4% 1,151 | 64.6% 2,100 | |
| 1952 | 34.5% 1,204 | 65.5% 2,288 | |
| 1948 | 16.0% 469 | 84.0% 2,455 | |
| 1944 | 24.9% 752 | 74.8% 2,261 | 0.4% 11 |
| 1940 | 27.4% 1,032 | 72.2% 2,723 | 0.4% 15 |
| 1936 | 12.7% 415 | 86.6% 2,840 | 0.7% 23 |
| 1932 | 9.0% 319 | 91.0% 3,236 | |
| 1928 | 42.5% 1,063 | 54.3% 1,358 | 3.2% 80 |
| 1924 | 25.9% 866 | 57.8% 1,935 | 16.3% 545 |
| 1920 | 44.5% 1,487 | 47.5% 1,589 | 8.0% 269 |
| 1916 | 18.5% 449 | 55.8% 1,352 | 25.7% 623 |
| 1912 | 16.0% 315 | 48.7% 958 | 35.3% 694 |
Economy
During the 19th century, the county's economy was based on agriculture and ranching. Cotton and corn were the most dominant crops. By 1934, oats had become the third-largest crop. After the creation of Lake Texoma, cotton acreage had dropped to about 10 percent of its 1934 level and corn had dropped to less than 2 percent, while peanuts had become the third largest crop. By 2001, wheat had become the largest crop, followed by rye, oats and peanuts.[3]
Oil and gas production began soon after the county was formed at statehood. Pure Oil Company built an oil camp in 1940 that had 43 houses and a 35-bed bunkhouse. Pure closed the camp in 1959, after a 1957 tornado had severely damaged it. At the turn of the 21st century, oil production was about 10 percent of the 1975 quantity, while gas production was about 68 percent of the 1975 quantity.[3]
Other significant business sectors are: wood products, manufacturing (especially livestock trailers) and tourism.[3]
Communities
City
- Madill (county seat)
Towns
Census-designated place
Other unincorporated places
See also
References
- 1 2 "State & County QuickFacts". United States Census Bureau. Archived from the original on July 14, 2011. Retrieved November 9, 2013.
- ↑ "Find a County". National Association of Counties. Retrieved 2011-06-07.
- 1 2 3 4 5 6 7 O'Dell, Larry. "Marshall County," Encyclopedia of Oklahoma History and Culture, Oklahoma Historical Society, 2009. Accessed April 4, 2015.
- ↑ "2010 Census Gazetteer Files". United States Census Bureau. August 22, 2012. Retrieved February 21, 2015.
- ↑ "Population and Housing Unit Estimates". Retrieved June 9, 2017.
- ↑ "U.S. Decennial Census". United States Census Bureau. Retrieved February 21, 2015.
- ↑ "Historical Census Browser". University of Virginia Library. Retrieved February 21, 2015.
- ↑ Forstall, Richard L., ed. (March 27, 1995). "Population of Counties by Decennial Census: 1900 to 1990". United States Census Bureau. Retrieved February 21, 2015.
- ↑ "Census 2000 PHC-T-4. Ranking Tables for Counties: 1990 and 2000" (PDF). United States Census Bureau. April 2, 2001. Retrieved February 21, 2015.
- ↑ "American FactFinder". United States Census Bureau. Retrieved 2008-01-31.
- ↑ https://www.ok.gov/elections/documents/20180115%20-%20Registration%20By%20County%20%28vr2420%29.pdf
- ↑ Leip, David. "Dave Leip's Atlas of U.S. Presidential Elections". uselectionatlas.org. Retrieved 2018-03-29.
Places adjacent to Marshall County, Oklahoma | ||||||||||
|---|---|---|---|---|---|---|---|---|---|---|
| ||||||||||
Municipalities and communities of Marshall County, Oklahoma, United States | ||
|---|---|---|
| City | | |
| Towns | ||
| CDP | ||
| Other unincorporated communities |
| |