Jefferson County, Oklahoma
| Jefferson County, Oklahoma | |
|---|---|
 | |
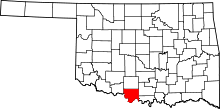 Location in the U.S. state of Oklahoma | |
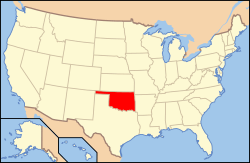 Oklahoma's location in the U.S. | |
| Founded | 1907 |
| Named for | Thomas Jefferson |
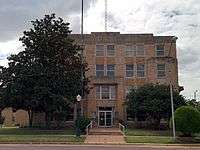
| Seat | Waurika |
| Largest city | Waurika |
| Area | |
| • Total | 774 sq mi (2,005 km2) |
| • Land | 759 sq mi (1,966 km2) |
| • Water | 15 sq mi (39 km2), 2.0% |
| Population (est.) | |
| • (2013) | 6,432 |
| • Density | 8.5/sq mi (3.3/km2) |
| Congressional district | 4th |
| Time zone | Central: UTC−6/−5 |
| Website |
www |
Jefferson County is a county located in the U.S. state of Oklahoma. As of the 2010 census, the population was 6,472.[1] Its county seat is Waurika.[2] The county was created at statehood and named in honor of President Thomas Jefferson.[3]
History
In the 1750s, the Taovaya Indians, a Wichita tribe, established twin villages along the Red River, in Jefferson County and across the river near present-day Spanish Fort, Texas. The village became “a lively emporium where Comanches brought Apache slaves, horses and mules to trade for French packs of powder, balls, knives, and textiles and for Taovaya-grown maize, melons, pumpkins, squash, and tobacco.”[4]
In 1759, in response to the destruction of the San Saba Mission, the Spanish led an expedition against the Taovaya and their allies and attacked the twin villages. The Indians defeated the Spanish army. (See Battle of the Twin Villages) The Taovaya villages were abandoned before 1841 as the Taovaya had been decimated by smallpox and encroachment by other Indians and Anglo-Americans.[5]
In the 1830s, the Choctaw tribe acquired more than two-thirds of the land now covered by Jefferson County, and the closely related Chickasaw tribe began to relocate there. In 1855, the two tribes formally divided and this area became part of the Chickasaw Nation. The western part of the present county became part of the Kiowa-Comanche-Apache Reservation, created by the 1867 Medicine Lodge Treaty. That area was opened to settlement by non-Indians by the Kiowa-Comanche-Apache Opening in 1901.[3]
After the Civil War, the Chisholm Trail, which passed through this area, was heavily used to drive cattle from Texas to markets in Kansas. In 1892, the Chicago, Rock Island and Pacific Railway laid tracks along the trail route. The Enid and Anadarko Railway, sold to the Rock Island in 1903, built a line from Lawton to Waurika. The Wichita Falls and Oklahoma Railroad built the last railroad in the county in 1923, from Texas to Waurika. It went out of business in 1942.[3] A railway line was built from Ardmore to Ringling.
Statehood in 1907 brought about the demise of the Chickasaw government and creation of Jefferson County. At that time the southeast corner of the county extended to Mud Creek including the communities of Belleville and Courtney. In 1924 the southeast corner of the county was realigned to its current boundary. The Oklahoma Constitutional Convention named Ryan as the county seat. An election for the seat was held in 1908 between Ryan, Sugden and Waurika, but none of the towns won a majority. Another election was held in 1912, resulting in Waurika being named as the county seat.[3]
Geography
According to the U.S. Census Bureau, the county has a total area of 774 square miles (2,000 km2), of which 759 square miles (1,970 km2) is land and 15 square miles (39 km2) (2.0%) is water.[6] The county drains into the Red River via Beaver and Mud creeks. Waurika Lake was created in 1971 by damming Beaver Creek in northwestern Jefferson County.[3]
Major highways
Adjacent counties
- Stephens County (north)
- Carter County (northeast)
- Love County (east)
- Montague County, Texas (south)
- Clay County, Texas (southwest)
- Cotton County (west)
Demographics
| Historical population | |||
|---|---|---|---|
| Census | Pop. | %± | |
| 1910 | 17,430 | — | |
| 1920 | 17,664 | 1.3% | |
| 1930 | 17,392 | −1.5% | |
| 1940 | 15,107 | −13.1% | |
| 1950 | 11,122 | −26.4% | |
| 1960 | 8,192 | −26.3% | |
| 1970 | 7,125 | −13.0% | |
| 1980 | 8,183 | 14.8% | |
| 1990 | 7,010 | −14.3% | |
| 2000 | 6,818 | −2.7% | |
| 2010 | 6,472 | −5.1% | |
| Est. 2016 | 6,230 | [7] | −3.7% |
| U.S. Decennial Census[8] 1790-1960[9] 1900-1990[10] 1990-2000[11] 2010-2013[1] | |||

As of the census[12] of 2000, there were 6,818 people, 2,716 households, and 1,863 families residing in the county. The population density was 9 people per square mile (3/km²). There were 3,373 housing units at an average density of 4 per square mile (2/km²). The racial makeup of the county was 87.14% White, 0.69% Black or African American, 5.24% Native American, 1.13% Asian, 0.03% Pacific Islander, 2.86% from other races, and 2.92% from two or more races. 7.01% of the population were Hispanic or Latino of any race.
There were 2,716 households out of which 29.20% had children under the age of 18 living with them, 55.60% were married couples living together, 9.20% had a female householder with no husband present, and 31.40% were non-families. 28.80% of all households were made up of individuals and 15.40% had someone living alone who was 65 years of age or older. The average household size was 2.38 and the average family size was 2.92.
In the county, the population was spread out with 24.00% under the age of 18, 7.20% from 18 to 24, 25.40% from 25 to 44, 23.30% from 45 to 64, and 20.10% who were 65 years of age or older. The median age was 40 years. For every 100 females there were 94.70 males. For every 100 females age 18 and over, there were 93.80 males.
The median income for a household in the county was $23,674, and the median income for a family was $30,563. Males had a median income of $25,195 versus $16,589 for females. The per capita income for the county was $12,899. About 16.30% of families and 19.20% of the population were below the poverty line, including 23.30% of those under age 18 and 18.40% of those age 65 or over.
Politics
| Voter Registration and Party Enrollment as of January 15, 2018[13] | |||||
|---|---|---|---|---|---|
| Party | Number of Voters | Percentage | |||
| Democratic | 1,787 | 53.39% | |||
| Republican | 1,133 | 33.25% | |||
| Unaffiliated | 447 | 13.36% | |||
| Total | 3,347 | 100% | |||
| Year | Republican | Democratic | Third parties |
|---|---|---|---|
| 2016 | 81.3% 1,910 | 15.5% 365 | 3.2% 75 |
| 2012 | 73.0% 1,634 | 27.0% 605 | |
| 2008 | 67.2% 1,652 | 32.8% 805 | |
| 2004 | 59.4% 1,546 | 40.6% 1,057 | |
| 2000 | 50.9% 1,320 | 48.0% 1,245 | 1.1% 28 |
| 1996 | 32.7% 865 | 54.0% 1,430 | 13.3% 351 |
| 1992 | 22.2% 671 | 52.3% 1,580 | 25.4% 768 |
| 1988 | 37.4% 1,063 | 62.1% 1,767 | 0.6% 16 |
| 1984 | 52.1% 1,656 | 47.1% 1,496 | 0.9% 27 |
| 1980 | 43.2% 1,440 | 54.4% 1,812 | 2.4% 80 |
| 1976 | 29.1% 956 | 70.1% 2,303 | 0.8% 26 |
| 1972 | 62.1% 1,709 | 35.2% 969 | 2.7% 73 |
| 1968 | 25.1% 780 | 52.4% 1,628 | 22.6% 701 |
| 1964 | 24.1% 811 | 75.9% 2,555 | |
| 1960 | 40.9% 1,343 | 59.2% 1,945 | |
| 1956 | 31.8% 1,186 | 68.2% 2,539 | |
| 1952 | 32.5% 1,384 | 67.5% 2,872 | |
| 1948 | 14.3% 556 | 85.7% 3,326 | |
| 1944 | 24.7% 974 | 74.9% 2,948 | 0.4% 15 |
| 1940 | 24.2% 1,226 | 75.4% 3,814 | 0.4% 20 |
| 1936 | 21.6% 1,032 | 77.9% 3,719 | 0.5% 22 |
| 1932 | 12.0% 485 | 88.0% 3,566 | |
| 1928 | 53.8% 2,251 | 45.8% 1,916 | 0.4% 18 |
| 1924 | 29.4% 1,108 | 64.9% 2,441 | 5.7% 214 |
| 1920 | 39.4% 1,733 | 52.0% 2,289 | 8.7% 381 |
| 1916 | 17.2% 493 | 60.8% 1,739 | 22.0% 630 |
| 1912 | 16.7% 361 | 51.8% 1,118 | 31.4% 678 |
Communities
See also
References
- 1 2 "State & County QuickFacts". United States Census Bureau. Archived from the original on July 12, 2011. Retrieved November 9, 2013.
- ↑ "Find a County". National Association of Counties. Archived from the original on 2011-05-31. Retrieved 2011-06-07.
- 1 2 3 4 5 Larry O'Dell, "Jefferson County," Encyclopedia of Oklahoma History and Culture, 2009. Accessed February 25, 2015.
- ↑ Elam, Earl Henry, “Anglo-American Relations with the Wichita Indians in Texas, 1822–1859.” Master’s Thesis, Texas Technological College, 1967, 11
- ↑ ANNE, MORRELL, LEA (2010-06-15). "SPANISH FORT, TX". www.tshaonline.org. Retrieved 2018-03-29.
- ↑ "2010 Census Gazetteer Files". United States Census Bureau. August 22, 2012. Retrieved February 21, 2015.
- ↑ "Population and Housing Unit Estimates". Retrieved June 9, 2017.
- ↑ "U.S. Decennial Census". United States Census Bureau. Archived from the original on May 12, 2015. Retrieved February 21, 2015.
- ↑ "Historical Census Browser". University of Virginia Library. Retrieved February 21, 2015.
- ↑ Forstall, Richard L., ed. (March 27, 1995). "Population of Counties by Decennial Census: 1900 to 1990". United States Census Bureau. Retrieved February 21, 2015.
- ↑ "Census 2000 PHC-T-4. Ranking Tables for Counties: 1990 and 2000" (PDF). United States Census Bureau. April 2, 2001. Retrieved February 21, 2015.
- ↑ "American FactFinder". United States Census Bureau. Retrieved 2008-01-31.
- ↑ https://www.ok.gov/elections/documents/20180115%20-%20Registration%20By%20County%20%28vr2420%29.pdf
- ↑ Leip, David. "Dave Leip's Atlas of U.S. Presidential Elections". uselectionatlas.org. Retrieved 2018-03-29.
External links
- Encyclopedia of Oklahoma History and Culture - Jefferson County
- Oklahoma Digital Maps: Digital Collections of Oklahoma and Indian Territory
Places adjacent to Jefferson County, Oklahoma | |
|---|---|
Municipalities and communities of Jefferson County, Oklahoma, United States | ||
|---|---|---|
| City | | |
| Towns | ||
| Unincorporated communities | ||