Pawnee County, Nebraska
| Pawnee County, Nebraska | |
|---|---|
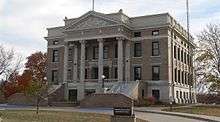 Pawnee County Courthouse in Pawnee City | |
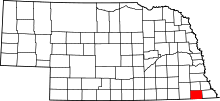 Location in the U.S. state of Nebraska | |
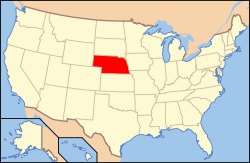 Nebraska's location in the U.S. | |
| Founded | 1854 |
| Named for | Pawnee people |
| Seat | Pawnee City |
| Largest city | Pawnee City |
| Area | |
| • Total | 433 sq mi (1,121 km2) |
| • Land | 431 sq mi (1,116 km2) |
| • Water | 1.9 sq mi (5 km2), 0.4% |
| Population | |
| • (2010) | 2,773 |
| • Density | 6.4/sq mi (2.5/km2) |
| Congressional district | 3rd |
| Time zone | Central: UTC−6/−5 |
Pawnee County is a county in the U.S. state of Nebraska. As of the 2010 census, the population was 2,773.[1] Its county seat is Pawnee City.[2]
In the Nebraska license plate system, Pawnee County is represented by the prefix 54 (it had the fifty-fourth-largest number of vehicles registered in the county when the license plate system was established in 1922).
History
Pawnee County was formed in 1854. It was named after the Pawnee Native American tribe.[3]
On May 30, 1879, the "Irving, Kansas Tornado" passed through Pawnee County. This tornado measured F4 on the Fujita scale, and had a damage path 800 yards wide and 100 miles.[4]
Geography
According to the U.S. Census Bureau, the county has an area of 433 square miles (1,120 km2), of which 431 square miles (1,120 km2) is land and 1.9 square miles (4.9 km2) (0.4%) is water.[5] Pawnee County is covered with rolling hills and farmland.
Major highways
Adjacent counties
- Richardson County (east)
- Nemaha County, Kansas (southeast)
- Marshall County, Kansas (southwest)
- Gage County (west)
- Johnson County (north)
- Nemaha County (northeast)
Demographics
| Historical population | |||
|---|---|---|---|
| Census | Pop. | %± | |
| 1860 | 882 | — | |
| 1870 | 4,171 | 372.9% | |
| 1880 | 6,920 | 65.9% | |
| 1890 | 10,340 | 49.4% | |
| 1900 | 11,770 | 13.8% | |
| 1910 | 10,582 | −10.1% | |
| 1920 | 9,578 | −9.5% | |
| 1930 | 9,423 | −1.6% | |
| 1940 | 8,514 | −9.6% | |
| 1950 | 6,744 | −20.8% | |
| 1960 | 5,356 | −20.6% | |
| 1970 | 4,473 | −16.5% | |
| 1980 | 3,937 | −12.0% | |
| 1990 | 3,317 | −15.7% | |
| 2000 | 3,087 | −6.9% | |
| 2010 | 2,773 | −10.2% | |
| Est. 2016 | 2,652 | [6] | −4.4% |
| U.S. Decennial Census[7] 1790-1960[8] 1900-1990[9] 1990-2000[10] 2010-2013[1] | |||
As of the census[11] of 2000, there were 3,087 people, 1,339 households, and 850 families residing in the county. The population density was 7 people per square mile (3/km²). There were 1,587 housing units at an average density of 4 per square mile (1/km²). The racial makeup of the county was 98.87% White, 0.19% Native American, 0.26% Asian, 0.03% from other races, and 0.65% from two or more races. 0.68% of the population were Hispanic or Latino of any race.
There were 1,339 households out of which 24.40% had children under the age of 18 living with them, 54.80% were married couples living together, 5.60% had a female householder with no husband present, and 36.50% were non-families. 32.90% of all households were made up of individuals and 20.20% had someone living alone who was 65 years of age or older. The average household size was 2.27 and the average family size was 2.86.
In the county, the population was spread out with 22.70% under the age of 18, 5.10% from 18 to 24, 21.00% from 25 to 44, 24.20% from 45 to 64, and 27.10% who were 65 years of age or older. The median age was 46 years. For every 100 females there were 92.50 males. For every 100 females age 18 and over, there were 91.30 males.
The median income for a household in the county was $29,000, and the median income for a family was $36,326. Males had a median income of $24,770 versus $17,976 for females. The per capita income for the county was $16,687. About 6.80% of families and 11.00% of the population were below the poverty line, including 13.60% of those under age 18 and 11.80% of those age 65 or over.
Politics
| Year | Republican | Democratic | Third Parties |
|---|---|---|---|
| 2016 | 73.4% 974 | 21.0% 279 | 5.6% 74 |
| 2012 | 67.0% 899 | 29.8% 400 | 3.1% 42 |
| 2008 | 62.1% 859 | 34.9% 483 | 3.0% 42 |
| 2004 | 66.5% 986 | 32.4% 481 | 1.1% 16 |
| 2000 | 61.7% 937 | 34.4% 522 | 4.0% 60 |
| 1996 | 48.8% 766 | 37.0% 580 | 14.2% 223 |
| 1992 | 37.1% 670 | 31.3% 566 | 31.6% 572 |
| 1988 | 55.5% 975 | 43.6% 767 | 0.9% 16 |
| 1984 | 69.3% 1,306 | 29.3% 552 | 1.4% 26 |
| 1980 | 71.2% 1,418 | 21.6% 431 | 7.2% 144 |
| 1976 | 52.9% 990 | 45.1% 845 | 2.0% 38 |
| 1972 | 71.3% 1,299 | 28.7% 524 | |
| 1968 | 60.3% 1,209 | 29.1% 583 | 10.6% 213 |
| 1964 | 51.2% 1,166 | 48.8% 1,111 | |
| 1960 | 63.1% 1,728 | 36.9% 1,009 | |
| 1956 | 64.2% 1,830 | 35.8% 1,022 | |
| 1952 | 75.0% 2,432 | 25.0% 810 | |
| 1948 | 57.6% 1,725 | 42.4% 1,271 | |
| 1944 | 63.9% 2,254 | 36.1% 1,275 | |
| 1940 | 62.4% 2,643 | 37.7% 1,596 | |
| 1936 | 47.1% 2,074 | 52.2% 2,297 | 0.8% 33 |
| 1932 | 36.9% 1,568 | 62.2% 2,641 | 0.9% 40 |
| 1928 | 64.3% 2,825 | 35.2% 1,547 | 0.5% 22 |
| 1924 | 55.9% 2,147 | 35.5% 1,365 | 8.6% 332 |
| 1920 | 69.9% 2,510 | 27.1% 972 | 3.1% 110 |
| 1916 | 49.7% 1,228 | 47.4% 1,171 | 3.0% 74 |
| 1912 | 25.1% 593 | 40.5% 958 | 34.5% 815 |
| 1908 | 54.9% 1,468 | 41.7% 1,115 | 3.3% 89 |
| 1904 | 68.4% 1,739 | 22.1% 562 | 9.5% 242 |
| 1900 | 56.9% 1,632 | 39.1% 1,121 | 4.0% 115 |
Communities
- Burchard
- Du Bois
- Lewiston
- Pawnee City (county seat)
- Steinauer
- Table Rock
See also
References
- 1 2 "State & County QuickFacts". United States Census Bureau. Archived from the original on July 16, 2011. Retrieved September 21, 2013.
- ↑ "Find a County". National Association of Counties. Archived from the original on May 31, 2011. Retrieved 2011-06-07.
- ↑ "Archived copy". Archived from the original on 2008-07-04. Retrieved 2010-03-30. Retrieved on March 14, 2008.
- ↑ Retrieved on March 14, 2008.
- ↑ "2010 Census Gazetteer Files". United States Census Bureau. August 22, 2012. Archived from the original on November 13, 2013. Retrieved December 11, 2014.
- ↑ "Population and Housing Unit Estimates". Retrieved June 9, 2017.
- ↑ "U.S. Decennial Census". United States Census Bureau. Archived from the original on May 12, 2015. Retrieved December 11, 2014.
- ↑ "Historical Census Browser". University of Virginia Library. Retrieved December 11, 2014.
- ↑ "Population of Counties by Decennial Census: 1900 to 1990". United States Census Bureau. Retrieved December 11, 2014.
- ↑ "Census 2000 PHC-T-4. Ranking Tables for Counties: 1990 and 2000" (PDF). United States Census Bureau. Retrieved December 11, 2014.
- ↑ "American FactFinder". United States Census Bureau. Retrieved 2008-01-31.
- ↑ http://uselectionatlas.org/RESULTS
External links
| Wikimedia Commons has media related to Pawnee County, Nebraska. |
Places adjacent to Pawnee County, Nebraska | ||||||||||
|---|---|---|---|---|---|---|---|---|---|---|
| ||||||||||
Municipalities and communities of Pawnee County, Nebraska, United States | ||
|---|---|---|
| City | ||
| Villages | ||
| Unincorporated communities | ||
| Ghost town | ||