Cook Partisan Voting Index
The Cook Partisan Voting Index, often abbreviated as CPVI or simply PVI, is a measurement of how strongly a United States congressional district or state leans toward the Democratic or Republican Party, compared to the nation as a whole. The index is updated after each election cycle. The Cook Political Report introduced the PVI in August 1997 to better gauge the competitiveness of each district using the 1992 and 1996 presidential elections as a baseline.[1] The index is based on analysis by the Center for Voting and Democracy (now FairVote) for its July 1997 Monopoly Politics report.[2]
Calculation
PVIs are calculated by comparing a congressional district's average Democratic or Republican Party share of the two-party presidential vote in the past two presidential elections to the national average share for those elections. For example, the national average for 2004 and 2008 was 51.2% Democratic to 48.8% Republican.[1] In Alaska's at-large congressional district, the Republican candidate won 63% and 61% of the two-party share in the 2004 and 2008 presidential elections, respectively. Comparing the average of these two district results (62%) against the average national share (49%), this district voted 13 percentage points more Republican than the country as a whole, or R+13.
Prior to its April 2009 update, the PVI formula compared district-level results for the past two presidential elections to nationwide results for only the most recent election. Since then, local elections are compared to synchronic national elections.[3] The change to an "apples-to-apples" comparison was the result of advocacy by David Nir of the Swing State Project.[4]
Format
The Cook PVI is formatted as a letter, plus sign, and number:
- Letter: The major party, Democratic (D) or Republican (R), to which the district leans
- Number: The extent of that lean, in rounded percentage points
For districts without a lean, the index written as "EVEN" without a number.
List
Extremes and trends
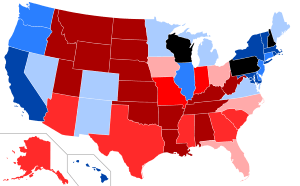
The most Democratic congressional district in the country is New York's 15th, located in the Bronx, with a PVI of D+44. The most Republican district is Texas's 13th at R+33. As for states as a whole, Wyoming and Utah are the most Republican at R+25, and Hawaii is the most Democratic at D+18.
The most Democratic district relative to its state is Tennessee's 9th, being D+28 in an R+14 state (a 42-point difference). The most Republican relative to its state is Illinois's 15th, being R+21 in a D+7 state (a 28-point difference). Of the 428 Congressional districts that are in states with more than one district, 114 lean to one party while their state leans to the other.
The most Democratic congressional district (as at time of the index) to elect a Republican is Florida's 26th with a PVI of D+6, represented by Carlos Curbelo. The most Republican (as at time of the index) to elect a Democrat is Minnesota's 7th with a PVI of R+12 and it is represented by Collin Peterson. In total there are eight paper-Democratic-leaning House districts represented by Republicans following the 2014 elections (up from five from before the election) and nine of the opposite scenario (down from 15 before the election). This represents a total of 17 out of 435 Representatives from districts with a PVI opposite to their current own party representative, whether due to political, population shift, personality factors, or redistricting.
In the Senate, the most Republican-leaning state to have a Democratic senator is West Virginia, with Joe Manchin. The least Democratic-leaning state to have two Democratic senators is New Hampshire, represented by Jeanne Shaheen and Maggie Hassan. No Republican-leaning states have elected two Democrats as of the 2016 elections. The most Democratic-leaning state to have a Republican senator is Maine – with Susan Collins. The two least Republican-leaning states to have two Republican senators are Iowa, represented by Chuck Grassley and Joni Ernst, and North Carolina, represented by Richard Burr and Thom Tillis.
Three of the (index-based) Republican-leaning states (the most so being Louisiana and Montana at R+11) have governors from the Democratic Party while eight Democratic-leaning states (the most Democratic being Vermont at D+15) have elected their current governor from the Republican Party.
All Republican-leaning states currently have a majority House delegation, as well as three Democratic-leaning states (Virginia, Michigan and Colorado at D+1) and two of the three neutral states: Pennsylvania and Wisconsin. The weakest states for the Democrats, per the index, to have a majority Democratic delegation are Nevada (D+1) and New Hampshire (with its PVI set at even, usually rendered EVEN); furthermore for New Hampshire the current Representatives are all Democrats.
Massachusetts contributes the most (House) Representatives – nine – among the six states that have entirely Democratic delegations; Oklahoma by contrast has elected all five of its Representatives as Republicans. Of the seven states with one representative two are held by Democrats (Delaware and Vermont) and the rest are currently held by Republicans (Wyoming, South Dakota, North Dakota, Montana, and Alaska).
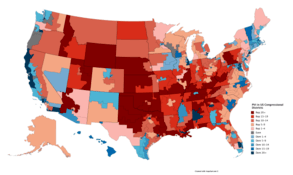
By congressional districtThis table is sourced from the Cook Political Report's 2016 analysis for districts of the 115th United States Congress, calculated according to the results of the 2012 and the 2016 U.S. presidential elections.[5] The party representations are based on the winners of the 2016 U.S. House elections. In the House, there are 241 districts that lean Republican, and 185 districts that lean Democratic. There are 16 seats at "EVEN" PVI. The number of swing seats – defined as those with PVI scores between R+5 and D+5 – has fallen to a record low of 72.[1]
The following district is ranked on the Cook PVI, as it participates in presidential elections. It is represented by a non-voting delegate.
The following districts are not ranked on the Cook PVI, as they are territories that do not participate in presidential elections. Each is represented by a non-voting delegate.
*Caucuses with Democrats
|
By stateThe PVIs for states are calculated based on the 2012 and 2016 presidential election.[6] For vacant offices, party representation is based on the most recent officeholder.
*An independent senator caucuses with the Democrats.
|
See also
- Psephology, the statistical analysis of elections.
- Political party strength in U.S. states
References
- 1 2 3 Wasserman, David (October 11, 2012). "House About PVI". The Cook Political Report. Retrieved November 17, 2012.
- ↑ "Monopoly Politics". Center for Voting and Democracy. July 1997. Retrieved November 17, 2012.
- ↑ Nir, David (2009-02-06). "Swing State Project:: A Look at the Cook Political Report's Partisan Vote Index (PVI)". Archived from the original on 24 February 2009. Retrieved 2017-08-05.
- ↑ "Cook Releases 2008 PVIs, With a Change SSPers Will Like". Swing State Project. April 9, 2009. Retrieved November 17, 2012.
- ↑ "Partisan Voting Index Districts of the 115th Congress by The Cook Political Report (Arranged by State/District)" (PDF). The Cook Political Report. Archived from the original (PDF) on June 7, 2017.
- ↑ "2016 State PVI Changes". Decision Desk HQ. 2016. Retrieved August 19, 2017.