United States presidential election in Michigan, 2008
|
| ||||||||||||||||||||||||||
| ||||||||||||||||||||||||||
| ||||||||||||||||||||||||||
 County Results
| ||||||||||||||||||||||||||
| ||||||||||||||||||||||||||
| Elections in Michigan | ||||||||||
|---|---|---|---|---|---|---|---|---|---|---|
 | ||||||||||
|
||||||||||
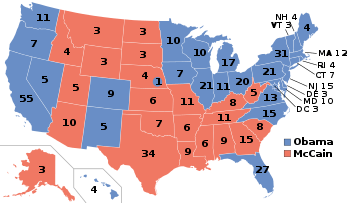
The 2008 United States presidential election in Michigan took place on November 4, 2008. It was part of the 2008 United States presidential election which happened throughout all 50 states and D.C.. Voters chose 17 representatives, or electors to the Electoral College, who voted for president and vice president.
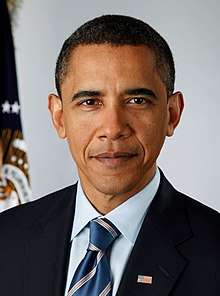
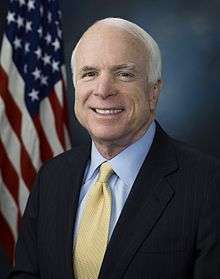
Michigan was won by Democratic nominee Barack Obama by a 16.5% margin of victory. Early on, the state was heavily targeted as a swing state. However, Obama started to pull away in the polls during the last few months, causing McCain to stop campaigning there. Prior to the election, all 17 news organizations considered this a state Obama would win, or otherwise considered as a safe blue state. The Great Lakes State has leaned Democratic, as it voted for the Democratic presidential nominee in every election from 1992 until 2016, when Donald Trump carried the state. In the end, Democratic presidential nominee Barack Obama won Michigan by a larger-than-expected margin of victory: 57.33% - 40.89%. This is the highest Democratic margin of victory since LBJ in 1964. Obama won 46 of the 83 counties.
Primaries
Campaign
Predictions
There were 17 news organizations who made state-by-state predictions of the election. Here are their last predictions before election day:
- D.C. Political Report: Democrat[1]
- Cook Political Report: Leaning Democrat[2]
- Takeaway: Solid Obama[3]
- Election Projection: Solid Obama[4]
- Electoral-vote.com: Strong Democrat[5]
- Washington Post: Solid Obama[6]
- Politico: Solid Obama[7]
- Real Clear Politics: Solid Obama[8]
- FiveThirtyEight.com: Solid Obama[6]
- CQ Politics: Safe Democrat[9]
- New York Times: Solid Democrat[10]
- CNN: Safe Democrat[11]
- NPR: Solid Obama[6]
- MSNBC: Solid Obama[6]
- Fox News: Democrat[12]
- Associated Press: Democrat[13]
- Rasmussen Reports: Safe Democrat[14]
Polling
Very early on, polling was tight as Obama was having a difficult time getting support from the pessimistic state. Since September 21, Obama swept all the polls taken from the state. The final 3 polls averaged Obama leading 54% to 40%.[15]
Fundraising
John McCain raised a total of $4,330,872 in the state. Barack Obama raised $7,299,275.[16]
Advertising and visits
Obama and his interest groups spent $12,995,614. McCain and his interest group spent $13,332,086.[17] The Democratic ticket visited the state 10 times to McCain's 9 times.[18]
Analysis
Michigan had not supported a Republican for president since 1988, and would not do so until 2016. However, the Republicans have attempted to carry the state's 17 electoral votes in the past few elections, and the margin of victory has decreased every year from 1996 to 2004. This year Republican presidential nominee John McCain put an early effort into winning Michigan, hoping to convert blue-collar voters disaffected by Obama's unfamiliarity as a liberal African-American from Chicago. Macomb County, a populous blue-collar suburb of Detroit, was a large target.
A major problem for the Obama Campaign was the 2008 Michigan Democratic Primary. Obama removed his name from the ballot after state officials moved up the primary in violation of party rules. As a result, Hillary Rodham Clinton won the state with 55%. This led to the McCain Campaign focusing heavily on winning Michigan in the general election. In May 2008, McCain was leading in a Rasmussen poll with 45% to 44%.[19] After the September financial crisis, however, McCain's general campaign fell into trouble. Polls showed Michigan, a state especially affected by the economy, turning away from McCain. Voters blamed Republicans for the crisis. In early October, with polls showing him falling further behind Obama, McCain pulled out of the state, essentially ceding it to Obama.[20] This was widely publicized, and more than likely contributed to Obama's landslide victory.
On Election Day, Barack Obama won by a double-digit margin of 16%. The state was called for Obama almost as soon as the polls closed. In Wayne County, home to Detroit, Obama piled up a 3-1 margin. Democratic strongholds Washtenaw County (home to Ann Arbor and the University of Michigan), Ingham County (home to Lansing and Michigan State) and Genesee County (home to Flint) gave Obama 65-70% of the vote. Macomb County, which McCain had focused so intensely on, voted Democratic by a comfortable margin of 9%. Oakland County, once a bastion of suburban conservatism, went for Obama by 15 points. Republican support in the state collapsed; McCain was only able to win two counties with margins of more than 10,000 votes.[21] This result signified continued evidence of Michigan's Democratic tilt, anchored by the heavily Democratic cities of Detroit, Lansing, Ann Arbor, and Flint. A Democrat can lose every other part of Michigan and still cling to victory by running up the votes in the aforementioned cities, as was the case with John Kerry in 2004, but not with Hillary Clinton eight years later.
At the same time as Obama swept the state, Democrats made more gains in Michigan. Incumbent Democratic U.S. Senator Carl Levin was reelected with 62.65% of the vote over Republican Jack Hoogendyk's 33.84%. Democrats also picked up two U.S. House seats in Michigan in the 7th District and the 9th District, with Mark Schauer and Gary Peters knocking off Tim Walberg and Joe Knollenberg, respectively. This gave Democrats the majority in Michigan's U.S. House delegation. In addition, Democrats picked up nine seats in the Michigan House of Representatives.
As of the 2016 presidential election, this is the last election in which Delta County, Clare County, St. Clair County, Benzie County, Lenawee County, Cass County, Iosco County, Alpena County, Gladwin County, Mason County, Menominee County, Ogemaw County, Ontonagon County, Presque Isle County, Schoolcraft County, Gratiot County, Alger County, Arenac County, Kent County, Jackson County, Berrien County, Clinton County, Iron County, Leelanau County, and Oceana County voted for the Democratic candidate. This is also the last election in which the Democratic candidate won the Upper Peninsula.
Results
| United States presidential election in Michigan, 2008 | ||||||
|---|---|---|---|---|---|---|
| Party | Candidate | Running mate | Votes | Percentage | Electoral votes | |
| Democratic | Barack Obama | Joe Biden | 2,872,579 | 57.33% | 17 | |
| Republican | John McCain | Sarah Palin | 2,048,639 | 40.89% | 0 | |
| Natural Law | Ralph Nader | Matt Gonzalez | 33,085 | 0.66% | 0 | |
| Libertarian | Bob Barr | Wayne Allyn Root | 23,716 | 0.47% | 0 | |
| Constitution | Chuck Baldwin | Darrell Castle | 14,685 | 0.29% | 0 | |
| Green | Cynthia McKinney | Rosa Clemente | 8,892 | 0.18% | 0 | |
| Write-Ins | Write-Ins | 8,533 | 0.17% | 0 | ||
| Totals | 5,010,129 | 100.00% | 17 | |||
| Voter turnout (Voting age population) | 66.9% | |||||
Results breakdown
Barack Obama won 46 Michigan counties compared to 37 for John McCain. The largest county with a very close winning margin was a 49.3% vs. 48.8% plurality for Obama in Kent County.[22]
By congressional district
Barack Obama carried 12 congressional districts in Michigan, including four districts held by Republicans.
| District | McCain | Obama | Representative |
|---|---|---|---|
| 1st | 48.11% | 49.93% | Bart Stupak |
| 2nd | 50.85% | 47.50% | Peter Hoekstra |
| 3rd | 49.43% | 48.84% | Vern Ehlers |
| 4th | 48.19% | 50.09% | Dave Camp |
| 5th | 34.71% | 63.67% | Dale Kildee |
| 6th | 44.18% | 54.12% | Fred Upton |
| 7th | 46.50% | 51.73% | Tim Walberg (110th Congress) |
| Mark Schauer (111th Congress) | |||
| 8th | 45.72% | 52.58% | Mike Rogers |
| 9th | 42.83% | 55.79% | Joe Knollenberg (110th Congress) |
| Gary Peters (111th Congress) | |||
| 10th | 49.85% | 48.23% | Candice Miller |
| 11th | 44.56% | 53.78% | Thaddeus McCotter |
| 12th | 33.23% | 65.05% | Sander Levin |
| 13th | 14.47% | 84.71% | Carolyn Cheeks Kilpatrick |
| 14th | 13.45% | 85.77% | John Conyers Jr. |
| 15th | 32.48% | 65.80% | John Dingell |
By county
| County | Obama% | Obama# | McCain% | McCain# | Others% | Others# | Total |
|---|---|---|---|---|---|---|---|
| Alcona County | 45.11% | 2,896 | 53.02% | 3,404 | 01.87% | 120 | 6,420 |
| Alger County | 52.04% | 2,472 | 46.06% | 2,188 | 01.89% | 90 | 4,750 |
| Allegan County | 43.71% | 24,165 | 54.38% | 30,061 | 01.90% | 1,053 | 55,279 |
| Alpena County | 51.08% | 7,705 | 47.23% | 7,125 | 01.69% | 255 | 15,085 |
| Antrim County | 43.89% | 6,079 | 54.19% | 7,506 | 01.93% | 267 | 13,852 |
| Arenac County | 51.12% | 4,155 | 46.84% | 3,807 | 02.04% | 166 | 8,128 |
| Baraga County | 47.34% | 1,725 | 50.66% | 1,846 | 02.00% | 73 | 3,644 |
| Barry County | 44.00% | 13,449 | 53.76% | 16,431 | 02.24% | 685 | 30,565 |
| Bay County | 56.75% | 32,589 | 41.43% | 23,795 | 01.82% | 1,044 | 57,428 |
| Benzie County | 52.88% | 5,451 | 45.47% | 4,687 | 01.66% | 171 | 10,309 |
| Berrien County | 51.99% | 40,381 | 46.52% | 36,130 | 01.49% | 1,155 | 77,666 |
| Branch County | 46.01% | 8,413 | 52.14% | 9,534 | 01.85% | 338 | 18,285 |
| Calhoun County | 53.84% | 34,561 | 44.48% | 28,553 | 01.69% | 1,082 | 64,196 |
| Cass County | 51.25% | 12,083 | 47.14% | 11,114 | 01.61% | 379 | 23,576 |
| Charlevoix County | 47.45% | 6,817 | 50.85% | 7,306 | 01.70% | 244 | 14,367 |
| Cheboygan County | 48.34% | 6,720 | 49.78% | 6,920 | 01.88% | 261 | 13,901 |
| Chippewa County | 48.98% | 8,184 | 49.48% | 8,267 | 01.54% | 257 | 16,708 |
| Clare County | 51.46% | 7,496 | 46.63% | 6,793 | 01.91% | 278 | 14,567 |
| Clinton County | 49.54% | 20,005 | 48.85% | 19,726 | 01.61% | 650 | 40,381 |
| Crawford County | 47.94% | 3,441 | 49.61% | 3,561 | 02.45% | 176 | 7,178 |
| Delta County | 52.32% | 9,974 | 45.97% | 8,763 | 01.72% | 327 | 19,064 |
| Dickinson County | 45.04% | 5,995 | 52.96% | 7,049 | 02.01% | 267 | 13,311 |
| Eaton County | 53.36% | 30,742 | 44.95% | 25,900 | 01.69% | 974 | 57,616 |
| Emmet County | 46.92% | 8,515 | 51.32% | 9,314 | 01.76% | 320 | 18,149 |
| Genesee County | 65.45% | 143,927 | 32.95% | 72,451 | 01.60% | 3,518 | 219,896 |
| Gladwin County | 49.77% | 6,590 | 48.27% | 6,391 | 01.96% | 260 | 13,241 |
| Gogebic County | 57.56% | 4,757 | 40.30% | 3,330 | 02.14% | 177 | 8,264 |
| Grand Traverse County | 47.73% | 23,258 | 50.72% | 24,716 | 01.56% | 759 | 48,733 |
| Gratiot County | 51.33% | 9,105 | 46.92% | 8,322 | 01.75% | 311 | 17,738 |
| Hillsdale County | 42.86% | 8,765 | 54.87% | 11,221 | 02.26% | 463 | 20,449 |
| Houghton County | 46.81% | 7,476 | 50.72% | 8,101 | 02.47% | 395 | 15,972 |
| Huron County | 48.83% | 8,367 | 49.22% | 8,434 | 01.95% | 334 | 17,135 |
| Ingham County | 65.85% | 93,994 | 32.57% | 46,483 | 01.58% | 2,252 | 142,729 |
| Ionia County | 45.99% | 12,565 | 51.82% | 14,156 | 02.19% | 598 | 27,319 |
| Iosco County | 51.52% | 7,309 | 46.40% | 6,583 | 02.08% | 295 | 14,187 |
| Iron County | 49.98% | 3,080 | 47.83% | 2,947 | 02.19% | 135 | 6,162 |
| Isabella County | 58.83% | 16,679 | 39.58% | 11,220 | 01.59% | 451 | 28,350 |
| Jackson County | 50.31% | 37,480 | 47.91% | 35,692 | 01.79% | 1,331 | 74,503 |
| Kalamazoo County | 58.92% | 77,051 | 39.42% | 51,554 | 01.66% | 2,176 | 130,781 |
| Kalkaska County | 44.48% | 3,780 | 53.27% | 4,527 | 02.26% | 192 | 8,499 |
| Kent County | 49.44% | 149,909 | 48.92% | 148,336 | 01.65% | 4,990 | 303,235 |
| Keweenaw County | 43.26% | 610 | 53.62% | 756 | 03.12% | 44 | 1,410 |
| Lake County | 55.16% | 2,919 | 42.88% | 2,269 | 01.97% | 104 | 5,292 |
| Lapeer County | 47.30% | 21,457 | 50.33% | 22,831 | 02.37% | 1,074 | 45,362 |
| Leelanau County | 50.85% | 7,355 | 47.97% | 6,938 | 01.18% | 171 | 14,464 |
| Lenawee County | 51.62% | 24,640 | 46.56% | 22,225 | 01.82% | 869 | 47,734 |
| Livingston County | 42.50% | 42,349 | 55.79% | 55,592 | 01.70% | 1,697 | 99,638 |
| Luce County | 43.47% | 1,191 | 54.38% | 1,490 | 02.15% | 59 | 2,740 |
| Mackinac County | 47.33% | 3,027 | 51.09% | 3,268 | 01.58% | 101 | 6,396 |
| Macomb County | 53.38% | 223,784 | 44.77% | 187,663 | 01.85% | 7,769 | 419,216 |
| Manistee County | 55.62% | 7,235 | 42.36% | 5,510 | 02.03% | 264 | 13,009 |
| Marquette County | 59.17% | 19,635 | 38.89% | 12,906 | 01.94% | 644 | 33,185 |
| Mason County | 51.35% | 7,817 | 46.95% | 7,147 | 01.70% | 259 | 15,223 |
| Mecosta County | 48.76% | 9,101 | 49.50% | 9,238 | 01.74% | 325 | 18,664 |
| Menominee County | 54.02% | 5,981 | 43.85% | 4,855 | 02.13% | 236 | 11,072 |
| Midland County | 47.36% | 20,701 | 50.94% | 22,263 | 01.70% | 743 | 43,707 |
| Missaukee County | 38.68% | 2,898 | 59.65% | 4,469 | 01.67% | 125 | 7,492 |
| Monroe County | 51.27% | 39,180 | 46.92% | 35,858 | 01.81% | 1,384 | 76,422 |
| Montcalm County | 48.83% | 13,208 | 49.13% | 13,291 | 02.04% | 552 | 27,051 |
| Montmorency County | 44.83% | 2,403 | 53.00% | 2,841 | 02.16% | 116 | 5,360 |
| Muskegon County | 63.87% | 53,821 | 34.58% | 29,145 | 01.55% | 1,305 | 84,271 |
| Newaygo County | 46.70% | 10,790 | 51.34% | 11,862 | 01.96% | 453 | 23,105 |
| Oakland County | 56.53% | 372,566 | 42.02% | 276,956 | 01.45% | 9,546 | 659,068 |
| Oceana County | 51.20% | 6,405 | 46.85% | 5,860 | 01.95% | 244 | 12,509 |
| Ogemaw County | 50.07% | 5,391 | 47.67% | 5,133 | 02.27% | 244 | 10,768 |
| Ontonagon County | 50.60% | 1,966 | 46.92% | 1,823 | 02.47% | 96 | 3,885 |
| Osceola County | 44.03% | 4,855 | 54.17% | 5,973 | 01.80% | 198 | 11,026 |
| Oscoda County | 43.60% | 1,887 | 53.60% | 2,320 | 02.80% | 121 | 4,328 |
| Otsego County | 44.66% | 5,634 | 53.52% | 6,752 | 01.82% | 230 | 12,616 |
| Ottawa County | 37.30% | 50,828 | 61.15% | 83,330 | 01.55% | 2,110 | 136,268 |
| Presque Isle County | 49.59% | 3,722 | 48.05% | 3,606 | 02.36% | 177 | 7,505 |
| Roscommon County | 50.40% | 7,082 | 47.88% | 6,727 | 01.72% | 242 | 14,051 |
| Saginaw County | 57.91% | 60,276 | 40.57% | 42,225 | 01.53% | 1,589 | 104,090 |
| St. Clair County | 50.28% | 40,677 | 47.63% | 38,536 | 02.09% | 1,687 | 80,900 |
| St. Joseph County | 47.94% | 12,322 | 50.14% | 12,886 | 01.92% | 494 | 25,702 |
| Sanilac County | 44.86% | 9,047 | 52.95% | 10,679 | 02.20% | 443 | 20,169 |
| Schoolcraft County | 50.49% | 2,184 | 47.57% | 2,058 | 01.94% | 84 | 4,326 |
| Shiawassee County | 53.27% | 19,397 | 44.67% | 16,268 | 02.06% | 750 | 36,415 |
| Tuscola County | 48.58% | 13,503 | 49.43% | 13,740 | 02.00% | 555 | 27,798 |
| Van Buren County | 53.47% | 18,588 | 44.68% | 15,534 | 01.85% | 644 | 34,766 |
| Washtenaw County | 69.78% | 130,578 | 28.83% | 53,946 | 01.38% | 2,591 | 187,115 |
| Wayne County | 74.14% | 660,085 | 24.66% | 219,582 | 01.20% | 10,659 | 890,326 |
| Wexford County | 46.99% | 7,379 | 51.22% | 8,044 | 01.79% | 281 | 15,704 |
Electors
Technically the voters of Michigan cast their ballots for electors: representatives to the Electoral College. Michigan is allocated 17 electors because it has 15 congressional districts and 2 senators. All candidates who appear on the ballot or qualify to receive write-in votes must submit a list of 17 electors, who pledge to vote for their candidate and his or her running mate. Whoever wins the majority of votes in the state is awarded all 17 electoral votes. Their chosen electors then vote for president and vice president. Although electors are pledged to their candidate and running mate, they are not obligated to vote for them.[23] An elector who votes for someone other than his or her candidate is known as a faithless elector.
The electors of each state and the District of Columbia met on December 15, 2008, to cast their votes for president and vice president. The Electoral College itself never meets as one body. Instead the electors from each state and the District of Columbia met in their respective capitols.
The following were the members of the Electoral College from the state. All 17 were pledged to Obama and Biden:
- Brenda Abbey
- Dallas Dean
- Ida DeHaas
- Ron Gettelfinger
- James Hoffa
- Kenneth Paul Jenkins
- Harry Kalogerakos
- Jessica Mistak
- Arturo Reyes
- Griffin Rivers
- Gary Shepherd
- Roger Short
- Arthur Shy
- Richard West
- Whitney Randall Wolcott
- David Woodward
- Charlene Yarbrough
References
- ↑ D.C.'s Political Report: The complete source for campaign summaries
- ↑ Presidential | The Cook Political Report Archived May 5, 2015, at the Wayback Machine.
- ↑ Adnaan (2008-09-20). "Track the Electoral College vote predictions". The Takeaway. Archived from the original on April 22, 2009. Retrieved 2009-11-14.
- ↑ Election Projection: 2008 Elections - Polls, Projections, Results
- ↑ Electoral-vote.com: President, Senate, House Updated Daily
- 1 2 3 4 Based on Takeaway
- ↑ POLITICO's 2008 Swing State Map - POLITICO.com
- ↑ RealClearPolitics - Electoral Map
- ↑ CQ Politics | CQ Presidential Election Maps, 2008 Archived October 29, 2008, at the Wayback Machine.
- ↑ "Electoral College Map". The New York Times. Retrieved 2010-05-26.
- ↑ "October – 2008 – CNN Political Ticker - CNN.com Blogs". CNN. Retrieved 2010-05-26.
- ↑ "Winning the Electoral College". Fox News. 2010-04-27.
- ↑ roadto270
- ↑ Election 2008: Electoral College Update - Rasmussen Reports™
- ↑ Election 2008 Polls - Dave Leip's Atlas of U.S. Presidential Elections
- ↑ Presidential Campaign Finance
- ↑ "Map: Campaign Ad Spending - Election Center 2008 from CNN.com". CNN. Retrieved 2010-05-26.
- ↑ "Map: Campaign Candidate Visits - Election Center 2008 from CNN.com". CNN. Retrieved 2010-05-26.
- ↑ "Archived copy". Archived from the original on 2009-02-27. Retrieved 2009-05-30.
- ↑ "McCain pulling out of Michigan - Yahoo! News". Retrieved 2008-12-20.
- ↑ "Election Results 2008". The New York Times. Archived from the original on November 3, 2004. Retrieved 2009-04-05.
- ↑ Dave Leip. "2008 Presidential General Election Data Graphs - Michigan". Atlas of U.S. Presidential Elections. Retrieved 2016-09-02.
- ↑ "Electoral College". California Secretary of State. Archived from the original on October 30, 2008. Retrieved 2008-11-01.