United States House of Representatives elections, 2008
|
| |||||||||||||||||||||||||||||||||||||
| |||||||||||||||||||||||||||||||||||||
All 435 seats in the United States House of Representatives and 6 non-voting members 218 seats were needed for a majority | |||||||||||||||||||||||||||||||||||||
|---|---|---|---|---|---|---|---|---|---|---|---|---|---|---|---|---|---|---|---|---|---|---|---|---|---|---|---|---|---|---|---|---|---|---|---|---|---|
| |||||||||||||||||||||||||||||||||||||
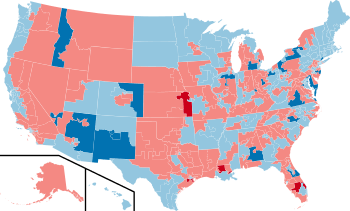 Results: Democratic hold Democratic gain Republican hold Republican gain | |||||||||||||||||||||||||||||||||||||
| |||||||||||||||||||||||||||||||||||||
The 2008 United States House of Representatives elections were held on November 4, 2008, to elect members to the United States House of Representatives to serve in the 111th United States Congress from January 3, 2009, until January 3, 2011. It coincided with the election of Barack Obama as President. All 435 voting seats, as well as all 6 non-voting seats, were up for election. The Democratic Party, which won a majority of seats in the 2006 election, expanded its control in 2008. The Republican Party, hoping to regain the majority it lost in the 2006 or at least expand its congressional membership, lost additional seats. With one exception (Louisiana's 2nd district), the only seats to switch from Democratic to Republican had been Republican-held prior to the 2006 elections. Republicans gained five Democratic seats total, while losing 26 of their own, giving the Democrats a net gain of 21 seats, effectively erasing all gains made by the GOP since 1994.[1] In addition, with the defeat of a Republican congressman in Connecticut's 4th district, this became the first time since the 1850s that no Republican represented the New England region.[2][3] Turnout increased due to the 2008 presidential election. The presidential election, 2008 Senate elections, and 2008 state gubernatorial elections, as well as many other state and local elections, occurred on the same date.
Composition entering the election
At the end of the 110th Congress (2nd Session), the membership of the U.S. House of Representatives was composed of 235 Democrats, 199 Republicans, and one vacancy.
Special elections in 2008 for the 110th Congress
In 2008 there were eight special elections for vacant seats in the United States House of Representatives, for the 110th United States Congress. In the special elections, Democrats gained three seats while keeping hold of five seats. Republicans held only one of their four seats.
Retiring incumbents
Thirty-three incumbents voluntarily retired.[4]
Democratic incumbents
All six seats held by retiring Democrats were won by Democrats.
- Alabama's 5th congressional district: Bud Cramer: "[T]o spend more time with my family and begin another chapter in my life"[5]
- Colorado's 2nd congressional district: Mark Udall: Ran for and won the U.S. Senate seat vacated by Wayne Allard.
- Maine's 1st congressional district: Tom Allen: Ran against and lost to Susan Collins in the U.S. Senate election.
- New Mexico's 3rd congressional district: Tom Udall: Ran for and won the U.S. Senate seat vacated by Pete Domenici.
- New York's 21st congressional district: Michael McNulty: "[I]t's not what I want to do for the rest of my life."[6]
- Oregon's 5th congressional district: Darlene Hooley: Because of the "cumulative effect of arduous travel, the relentless demands of fund-raising and 32 years of public service"[7]
Republican incumbents
Twenty-seven Republicans retired. Thirteen of their seats were then won by Democrats (see Open seat gains, below).
- Alabama's 2nd congressional district: Terry Everett: Because of age and health[8]
- Arizona's 1st congressional district: Rick Renzi: To fight federal criminal charges involving a land-swap deal[9]
- California's 4th congressional district: John Doolittle: To fight an FBI corruption investigation[10]
- California's 52nd congressional district: Duncan Hunter Ran for and lost the race for the Republican nomination for President. Already planned to retire
- Colorado's 6th congressional district: Tom Tancredo: Ran for and lost the race for the Republican nomination for President
- Florida's 15th congressional district: Dave Weldon: To return to his medical practice[11]
- Illinois's 11th congressional district: Jerry Weller: To spend more time with his family,[12] amid questions about his Nicaraguan land dealings, his wife's investments, and his relationship to an indicted defense contractor[13]
- Illinois's 18th congressional district: Ray LaHood (On December 19, 2008, President-elect Barack Obama announced his intention to nominate LaHood to serve as the next Secretary of Transportation.) He was later confirmed.
- Kentucky's 2nd congressional district: Ron Lewis
- Louisiana's 4th congressional district: Jim McCrery
- Minnesota's 3rd congressional district: Jim Ramstad
- Mississippi's 3rd congressional district: Chip Pickering
- Missouri's 9th congressional district: Kenny Hulshof: Ran for and lost the election for governor
- New Jersey's 3rd congressional district: Jim Saxton: Because of age and health[14]
- New Jersey's 7th congressional district: Mike Ferguson: To spend more time with his family[15]
- New Mexico's 1st congressional district: Heather Wilson: Ran in and lost the Republican primary for New Mexico's open U.S. Senate seat
- New Mexico's 2nd congressional district: Steve Pearce: Ran for and lost the election for New Mexico's open U.S. Senate seat
- New York's 13th congressional district: Vito Fossella: Amid scandal following a drunk driving arrest which led to revelations of infidelity and a secret family he maintained in Virginia
- New York's 25th congressional district: Jim Walsh
- New York's 26th congressional district: Tom Reynolds
- Ohio's 7th congressional district: Dave Hobson: "I wanted to go out on top"[16]
- Ohio's 15th congressional district: Deborah Pryce: To spend more time with her family[17]
- Ohio's 16th congressional district: Ralph Regula
- Pennsylvania's 5th congressional district: John Peterson: To spend more time with his family[18][19]
- Puerto Rico's at-large congressional district: Luis Fortuño: Ran for and won the Governorship of Puerto Rico defeating Gov. Aníbal Acevedo Vilá[20]
- Virginia's 11th congressional district: Thomas M. Davis: "It's time for me to take a sabbatical"[21]
- Wyoming's at-large congressional district: Barbara Cubin[22]
Defeated incumbents
Incumbents defeated in primary election
One Republican lost in a primary and the seat was eventually won by a Democrat. One Democrat lost the primary as did two Republicans. The primary winners, however, managed to retain the seat for the same party.
- Maryland's 1st congressional district: Wayne Gilchrest (R), whose seat was later won by a Democrat
- Maryland's 4th congressional district: Albert Wynn (D), who subsequently resigned May 31, 2008
- Utah's 3rd congressional district: Chris Cannon (R)
- Tennessee's 1st congressional district: David Davis (R)
Incumbents defeated in general election
Fourteen Republicans and Five Democrats lost their general elections, thereby losing their seats to the other party.
- Colorado's 4th congressional district: Marilyn Musgrave (R)
- Connecticut's 4th congressional district: Christopher Shays (R)
- Florida's 8th congressional district: Ric Keller (R)
- Florida's 16th congressional district: Tim Mahoney (D)
- Florida's 24th congressional district: Tom Feeney (R)
- Idaho's 1st congressional district: Bill Sali (R)[23]
- Kansas's 2nd congressional district: Nancy Boyda (D)
- Louisiana's 2nd congressional district: William J. Jefferson (D)
- Louisiana's 6th congressional district: Don Cazayoux (D)
- Michigan's 7th congressional district: Tim Walberg (R)
- Michigan's 9th congressional district: Joe Knollenberg (R)
- Nevada's 3rd congressional district: Jon Porter (R)
- New York's 29th congressional district: Randy Kuhl (R)
- North Carolina's 8th congressional district: Robin Hayes (R)
- Ohio's 1st congressional district: Steve Chabot (R)
- Pennsylvania's 3rd congressional district: Phil English (R)
- Texas's 22nd congressional district: Nick Lampson (D)
- Virginia's 2nd congressional district: Thelma Drake (R)
- Virginia's 5th congressional district: Virgil Goode (R)
Open seat gains
Twelve seats (and one delegate's seat) held by retiring Republicans were won by Democrats. No Democratic retirements were picked up by Republicans.
- Alabama's 2nd congressional district (Democratic gain)
- Arizona's 1st congressional district (Democratic gain)
- Illinois's 11th congressional district (Democratic gain)
- Maryland's 1st congressional district (Democratic gain)
- New Jersey's 3rd congressional district (Democratic gain)
- New Mexico's 1st congressional district (Democratic gain)
- New Mexico's 2nd congressional district (Democratic gain)
- New York's 13th congressional district (Democratic gain)
- New York's 25th congressional district (Democratic gain)
- Ohio's 15th congressional district (Democratic gain)
- Ohio's 16th congressional district (Democratic gain)
- Puerto Rico's at-large congressional district (NPP – caucusing with the Democrats – gain)
- Virginia's 11th congressional district (Democratic gain)
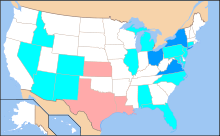
Predictions
Shortly after the November 2006 election, Scott Elliott of ElectionProjection.com said that the Democratic majority would be tough to beat - at most the GOP could take back fourteen House seats - two short of a majority.[24]
On April 8, 2008, analyst Stuart Rothenberg of The Rothenberg Political Report (who bills himself as non-partisan) stated that the fight for the House would be a "one-sided battle, with Democrats having most of the targets." He points to a list of one dozen seats (out of all 435 seats in the House) that are most likely to change hands, of those twelve, ten are open seats, seats which Republicans won by 3% or less in 2006 or otherwise endangered GOP seats.[25]
In May 2007, conservative columnist Robert Novak wrote that he believed there were at least a few House seats that were won by Democrats in 2006 "solely because of GOP corruption," and that such seats would be "the most likely to return to the Republican column in 2008". He also said,
a continued sour mood over the Iraq War could produce another massive Republican defeat in 2008 that makes 2006 look tame by comparison. Republicans in Washington generally concede that the continued presence of U.S. troops in Iraq by next November could mean disaster for the party.
Novak qualified this by saying that in "previous elections, major House gains by either party have always been followed by losses in the next election".[26]
InTrade.com, the only betting site that offered odds on control of the House, put the likelihood of the Democrats retaining control at about 90% as of October 2008.[27]
There have been three special elections for open Republican seats, IL-14 (formerly held by Dennis Hastert), LA-06 (formerly held by Richard Baker) and MS-01 (formerly held by Roger Wicker). Democrats won all three elections. After the MS-01 loss, Ron Gunzburger wrote, "GOP insiders in DC now privately acknowledge the Democratic victory in this seat likely foreshadows a dismal general election ahead for congressional Republicans."[28]
The following table rates the competitiveness of selected races from around the country according to noted political analysts. Races not included should be considered safe for the incumbent's party. (Incumbents not running for re-election have parentheses around their name.)
| District | Incumbent | Cook[29] | Rothenberg[30] | CQ Politics[31] | Crystal Ball[32] |
|---|---|---|---|---|---|
| AL-2 | (Everett) (R) | Tossup | Pure Tossup | No Clear Favorite | Republican Hold |
| AL-3 | Rogers (R) | Likely R | Limited Risk | R Favored | Safe R |
| AL-5 | (Cramer) (D) | Tossup | Pure Tossup | No Clear Favorite | Democratic Hold |
| AK-AL | Young (R) | Tossup | D Favored | Leans D | Democratic Pick-up |
| AZ-1 | (Renzi) (R) | Likely D | D Favored | Leans D | Democratic Pick-up |
| AZ-3 | Shadegg (R) | Leans R | R Favored | Leans R | Republican Hold |
| AZ-5 | Mitchell (D) | Likely D | Limited Risk | Leans D | Democratic Hold |
| AZ-8 | Giffords (D) | Likely D | Limited Risk | Leans D | Democratic Hold |
| CA-3 | Lungren (R) | Likely R | R Favored | R Favored | Safe R |
| CA-4 | (Doolittle) (R) | Tossup | Pure Tossup | No Clear Favorite | Democratic Pick-up |
| CA-11 | McNerney (D) | Leans D | Leans D | D Favored | Democratic Hold |
| CA-26 | Dreier (R) | Likely R | Limited Risk | R Favored | Safe R |
| CA-45 | Bono (R) | Likely R | Limited Risk | Safe R | Safe R |
| CA-46 | Rohrabacher (R) | Likely R | R Favored | R Favored | Safe R |
| CA-50 | Bilbray (R) | Leans R | Limited Risk | R Favored | Republican Hold |
| CO-4 | Musgrave (R) | Tossup | Leans D | Leans D | Democratic Pick-up |
| CT-2 | Courtney (D) | Solid D | Limited Risk | D Favored | Safe D |
| CT-4 | Shays (R) | Tossup | Tossup/Tilts D | No Clear Favorite | Democratic Pick-up |
| CT-5 | Murphy (D) | Solid D | Limited Risk | Leans D | Democratic Hold |
| FL-8 | Keller (R) | Tossup | Leans D | Leans D | Democratic Pick-up |
| FL-13 | Buchanan (R) | Likely R | R Favored | Leans R | Republican Hold |
| FL-15 | (Weldon) (R) | Solid R | Limited Risk | R Favored | Safe R |
| FL-16 | Mahoney (D) | Likely R | R Favored | Leans R | Republican Pick-up |
| FL-18 | Ros-Lehtinen (R) | Likely R | Limited Risk | R Favored | Safe R |
| FL-21 | L. Diaz-Balart (R) | Tossup | Pure Tossup | Leans R | Republican Hold |
| FL-22 | Klein (D) | Solid D | Limited Risk | D Favored | Safe D |
| FL-24 | Feeney (R) | Leans D | D Favored | Leans D | Democratic Pick-up |
| FL-25 | M. Diaz-Balart (R) | Tossup | Tossup/Tilts R | Leans R | Democratic Pick-up |
| GA-8 | Marshall (D) | Leans D | Tossup/Tilts D | Leans D | Democratic Hold |
| GA-12 | Barrow (D) | Solid D | Limited Risk | D Favored | Democratic Hold |
| GA-13 | Scott (D) | Solid D | Limited Risk | D Favored | Safe D |
| ID-1 | Sali (R) | Tossup | Tossup/Tilts D | No Clear Favorite | Democratic Pick-up |
| IL-6 | Roskam (R) | Likely R | Limited Risk | R Favored | Safe R |
| IL-8 | Bean (D) | Solid D | Limited Risk | D Favored | Democratic Hold |
| IL-10 | Kirk (R) | Tossup | Tossup/Tilts R | No Clear Favorite | Democratic Pick-up |
| IL-11 | (Weller) (R) | Leans D | Leans D | Leans D | Democratic Pick-up |
| IL-13 | Biggert (R) | Likely R | Limited Risk | R Favored | Safe R |
| IL-14 | Foster (D) | Likely D | Limited Risk | D Favored | Democratic Hold |
| IL-18 | (LaHood) (R) | Solid R | Limited Risk | R Favored | Republican Hold |
| IN-3 | Souder (R) | Leans R | R Favored | Leans R | Republican Hold |
| IN-8 | Ellsworth (D) | Solid D | Limited Risk | Safe D | Democratic Hold |
| IN-9 | Hill (D) | Likely D | Limited Risk | D Favored | Democratic Hold |
| IA-4 | Latham (R) | Likely R | Limited Risk | R Favored | Republican Hold |
| KS-2 | Boyda (D) | Leans D | Tossup/Tilts D | No Clear Favorite | Democratic Hold |
| KS-3 | Moore (D) | Likely D | Limited Risk | D Favored | Democratic Hold |
| KY-2 | (Lewis) (R) | Tossup | Pure Tossup | Leans R | Republican Hold |
| KY-3 | Yarmuth (D) | Likely D | Limited Risk | D Favored | Democratic Hold |
| LA-1 | Scalise (R) | Solid R | Limited Risk | R Favored | Safe R |
| LA-4 | (McCrery) (R) | Tossup | Pure Tossup | No Clear Favorite | Republican Hold |
| LA-6 | Cazayoux (D) | Tossup | Pure Tossup | No Clear Favorite | Democratic Hold |
| LA-7 | Boustany (R) | Likely R | Limited Risk | R Favored | Republican Hold |
| ME-1 | (Allen) (D) | Solid D | Limited Risk | D Favored | Safe D |
| MD-1 | (Gilchrest) (R) | Tossup | Pure Tossup | No Clear Favorite | Republican Hold |
| MI-7 | Walberg (R) | Tossup | Pure Tossup | No Clear Favorite | Democratic Pick-up |
| MI-8 | Rogers (R) | Likely R | Limited Risk | Safe R | Safe R |
| MI-9 | Knollenberg (R) | Tossup | Leans D | Leans D | Democratic Pick-up |
| MI-11 | McCotter (R) | Likely R | Limited Risk | Safe R | Safe R |
| MN-1 | Walz (D) | Likely D | Limited Risk | D Favored | Democratic Hold |
| MN-2 | Kline (R) | Likely R | Limited Risk | R Favored | Safe R |
| MN-3 | (Ramstad) (R) | Tossup | Tossup/Tilts D | No Clear Favorite | Republican Hold |
| MN-6 | Bachmann (R) | Tossup | Tossup/Tilts D | No Clear Favorite | Democratic Pick-up |
| MS-1 | Childers (D) | Likely D | Limited Risk | Leans D | Democratic Hold |
| MO-6 | Graves (R) | Leans R | Limited Risk | Leans R | Republican Hold |
| MO-9 | (Hulshof) (R) | Tossup | Tossup/Tilts R | Leans R | Republican Hold |
| NE-2 | Terry (R) | Tossup | Tossup/Tilts D | Leans R | Republican Hold |
| NV-2 | Heller (R) | Leans R | R Favored | Leans R | Republican Hold |
| NV-3 | Porter (R) | Tossup | Tossup/Tilts D | No Clear Favorite | Democratic Pick-up |
| NH-1 | Shea-Porter (D) | Tossup | Tossup/Tilts D | No Clear Favorite | Democratic Hold |
| NH-2 | Hodes (D) | Solid D | Limited Risk | D Favored | Democratic Hold |
| NJ-3 | (Saxton) (R) | Tossup | Tossup/Tilts D | No Clear Favorite | Democratic Pick-up |
| NJ-5 | Garrett (R) | Likely R | Limited Risk | R Favored | Republican Hold |
| NJ-7 | (Ferguson) (R) | Tossup | Pure Tossup | No Clear Favorite | Democratic Pick-up |
| NM-1 | (Wilson) (R) | Leans D | Leans D | No Clear Favorite | Democratic Pick-up |
| NM-2 | (Pearce) (R) | Tossup | Leans D | No Clear Favorite | Democratic Pick-up |
| NY-13 | (Fossella) (R) | Likely D | D Favored | D Favored | Democratic Pick-up |
| NY-19 | Hall (D) | Solid D | Limited Risk | D Favored | Democratic Hold |
| NY-20 | Gillibrand (D) | Likely D | Limited Risk | Leans D | Democratic Hold |
| NY-24 | Arcuri (D) | Likely D | Limited Risk | D Favored | Democratic Hold |
| NY-25 | (Walsh) (R) | Likely D | D Favored | D Favored | Democratic Pick-up |
| NY-26 | (Reynolds) (R) | Tossup | Tossup/Tilts R | Leans R | Republican Hold |
| NY-29 | Kuhl (R) | Tossup | Tossup/Tilts D | Leans D | Democratic Pick-up |
| NC-5 | Foxx (R) | Likely R | Limited Risk | Safe R | Safe R |
| NC-8 | Hayes (R) | Tossup | Leans D | No Clear Favorite | Democratic Pick-up |
| NC-10 | McHenry (R) | Solid R | Limited Risk | R Favored | Safe R |
| OH-1 | Chabot (R) | Tossup | Pure Tossup | No Clear Favorite | Democratic Pick-up |
| OH-2 | Schmidt (R) | Leans R | Leans R | Leans R | Republican Hold |
| OH-7 | (Hobson) (R) | Likely R | Limited Risk | R Favored | Safe R |
| OH-12 | Tiberi (R) | Likely R | Limited Risk | R Favored | Safe R |
| OH-14 | LaTourette (R) | Likely R | Limited Risk | R Favored | Safe R |
| OH-15 | (Pryce) (R) | Leans D | Tossup/Tilts D | Leans D | Democratic Pick-up |
| OH-16 | (Regula) (R) | Leans D | D Favored | Leans D | Democratic Pick-up |
| OH-18 | Space (D) | Likely D | Limited Risk | D Favored | Democratic Hold |
| OK-1 | Sullivan (R) | Likely R | Limited Risk | Safe R | Safe R |
| OK-4 | Cole (R) | Likely R | Limited Risk | Safe R | Safe R |
| OR-5 | (Hooley) (D) | Likely D | Limited Risk | D Favored | Democratic Hold |
| PA-3 | English (R) | Tossup | Tossup/Tilts D | No Clear Favorite | Democratic Pick-up |
| PA-4 | Altmire (D) | Likely D | Limited Risk | D Favored | Democratic Hold |
| PA-5 | (Peterson) (R) | Likely R | Limited Risk | Safe R | Safe R |
| PA-6 | Gerlach (R) | Likely R | Limited Risk | R Favored | Republican Hold |
| PA-8 | Murphy (D) | Solid D | Limited Risk | D Favored | Democratic Hold |
| PA-10 | Carney (D) | Leans D | D Favored | Leans D | Democratic Hold |
| PA-11 | Kanjorski (D) | Tossup | Pure Tossup | No Clear Favorite | Republican Pick-up |
| PA-12 | Murtha (D) | Leans D | D Favored | Leans D | Democratic Hold |
| PA-15 | Dent (R) | Likely R | Limited Risk | R Favored | Republican Hold |
| PA-18 | Murphy (R) | Likely R | Limited Risk | R Favored | Republican Hold |
| SC-1 | Brown (R) | Leans R | Leans R | Leans R | Republican Hold |
| SC-2 | Wilson (R) | Likely R | Limited Risk | R Favored | Safe R |
| TX-7 | Culberson (R) | Leans R | R Favored | Leans R | Republican Hold |
| TX-10 | McCaul (R) | Leans R | R Favored | Leans R | Republican Hold |
| TX-22 | Lampson (D) | Tossup | Leans R | No Clear Favorite | Republican Pick-up |
| TX-23 | Rodriguez (D) | Likely D | Limited Risk | Leans D | Democratic Hold |
| VA-2 | Drake (R) | Tossup | Pure Tossup | Leans R | Republican Hold |
| VA-5 | Goode (R) | Leans R | Leans R | Leans R | Republican Hold |
| VA-10 | Wolf (R) | Likely R | Limited Risk | R Favored | Safe R |
| VA-11 | (Davis) (R) | Likely D | D Favored | D Favored | Democratic Pick-up |
| WA-8 | Reichert (R) | Tossup | Pure Tossup | No Clear Favorite | Democratic Pick-up |
| WV-2 | Capito (R) | Leans R | R Favored | Leans R | Republican Hold |
| WI-8 | Kagen (D) | Leans D | D Favored | Leans D | Democratic Hold |
| WY-AL | (Cubin) (R) | Leans R | Leans R | No Clear Favorite | Republican Hold |
Results
| 257 | 178 |
| Democratic | Republican |
| United States House of Representatives elections, 2008 | |||||||||||
|---|---|---|---|---|---|---|---|---|---|---|---|
| Party | Voting members[33][34] | Non-voting members[35] | |||||||||
| Votes | Percentage | Seats | +/− | Votes | Percentage | Seats | +/− | ||||
| Democratic[A] | 65,237,840 | 53.22% | 257 | +21 | 1,952,133 | 94.34% | 4 | +1 | |||
| Republican | 52,249,491 | 42.62% | 178 | −21 | 1,919 | 0.09% | 0 | −1 | |||
| Libertarian | 1,083,096 | 0.88% | 0 | 0 | — | — | 0 | 0 | |||
| Independent[B][C] | 729,798 | 0.60% | 0 | 0 | 21,574 | 1.04% | 2 | +1 | |||
| Green | 580,263 | 0.47% | 0 | 0 | 14,386 | 0.70% | 0 | 0 | |||
| Constitution | 179,261 | 0.15% | 0 | 0 | — | — | 0 | 0 | |||
| Independence | 168,939 | 0.14% | 0 | 0 | — | — | 0 | 0 | |||
| Peace and Freedom | 47,659 | 0.04% | 0 | 0 | — | — | 0 | 0 | |||
| Conservative | 26,182 | 0.02% | 0 | 0 | — | — | 0 | 0 | |||
| Reform | 22,603 | 0.02% | 0 | 0 | — | — | 0 | 0 | |||
| Hsing for Congress | 16,419 | 0.01% | 0 | 0 | — | — | 0 | 0 | |||
| Working Families | 12,104 | 0.01% | 0 | 0 | — | — | 0 | 0 | |||
| Vermont Progressive | 9,081 | 0.01% | 0 | 0 | — | — | 0 | 0 | |||
| American Independent | 6,286 | 0.01% | 0 | 0 | — | — | 0 | 0 | |||
| Liberty Union | 5,307 | <0.01% | 0 | 0 | — | — | 0 | 0 | |||
| Common Sense Ideas | 4,802 | <0.01% | 0 | 0 | — | — | 0 | 0 | |||
| Socialist Workers | 3,989 | <0.01% | 0 | 0 | — | — | 0 | 0 | |||
| Vote People Change | 3,708 | <0.01% | 0 | 0 | — | — | 0 | 0 | |||
| Regular Independent | 3,531 | <0.01% | 0 | 0 | — | — | 0 | 0 | |||
| For the People | 3,526 | <0.01% | 0 | 0 | — | — | 0 | 0 | |||
| All-Day Breakfast | 3,259 | <0.01% | 0 | 0 | — | — | 0 | 0 | |||
| Independent Progressive | 3,200 | <0.01% | 0 | 0 | — | — | 0 | 0 | |||
| Prosperity Not War | 2,671 | <0.01% | 0 | 0 | — | — | 0 | 0 | |||
| Unity | 2,176 | <0.01% | 0 | 0 | — | — | 0 | 0 | |||
| Term Limits | 2,042 | <0.01% | 0 | 0 | — | — | 0 | 0 | |||
| Rock the Boat | 1,312 | <0.01% | 0 | 0 | — | — | 0 | 0 | |||
| Back to Basics | 1,258 | <0.01% | 0 | 0 | — | — | 0 | 0 | |||
| Think Independently | 1,010 | <0.01% | 0 | 0 | — | — | 0 | 0 | |||
| Eliminate the Primary | 975 | <0.01% | 0 | 0 | — | — | 0 | 0 | |||
| Socialist | 648 | <0.01% | 0 | 0 | — | — | 0 | 0 | |||
| Lindsay for Congress | 508 | <0.01% | 0 | 0 | — | — | 0 | 0 | |||
| Other votes | 2,173,349 | 1.77% | |||||||||
| Totals | 122,586,293[36] | 100.00% | 435 | — | 2,069,306 | 100.00% | 6 | +1 | |||
| Voter turnout | |||||||||||
- A The number of non-voting members also includes the non-voting member-elect from Puerto Rico, Pedro Pierluisi, who is a member of the New Progressive Party of Puerto Rico, but will caucus with the Democrats. The New Progressive Party is affiliated with both the Democratic and Republican Parties and the last representative from Puerto Rico, Luis Fortuño, caucused with the Republicans. The vote total for the non-voting members also includes the Popular Democratic Party of Puerto Rico, which has ties to the Democratic Party.
- B Both non-voting independents, American Samoa's representative Eni Faleomavaega and the Northern Mariana Islands' representative-elect Gregorio Sablan, will caucus with the Democrats. In America Samoa all elections are non-partisan.[37] In the Northern Mariana Islands, Sablan appeared on the ballot as an independent.[38]
- C Write-in candidates are included with the vote totals.
Alabama
| District | Incumbent | Party | First elected |
Results | Candidates |
|---|---|---|---|---|---|
| Alabama 1 | Jo Bonner | Republican | 2002 | Incumbent re-elected. | √ Jo Bonner (Republican) Unopposed |
| Alabama 2 | Terry Everett | Republican | 1992 | Incumbent retired. New member elected. Democratic gain. |
√ Bobby Bright (Democratic) 50.2% Jay Love (Republican) 49.6% |
| Alabama 3 | Mike Rogers | Republican | 2002 | Incumbent re-elected. | √ Mike Rogers (Republican) 54.0% Joshua Segall (Democratic) 45.8% |
| Alabama 4 | Robert Aderholt | Republican | 1996 | Incumbent re-elected. | √ Robert Aderholt (Republican) 74.8% Nicholas Sparks (Democratic) 25.1% |
| Alabama 5 | Bud Cramer | Democratic | 1990 | Incumbent retired. New member elected. Democratic hold. |
√ Parker Griffith (Democratic) 51.5% Wayne Parker (Republican) 47.9% |
| Alabama 6 | Spencer Bachus | Republican | 1992 | Incumbent re-elected. | √ Spencer Bachus (Republican) Unopposed |
| Alabama 7 | Artur Davis | Democratic | 2002 | Incumbent re-elected. | √ Artur Davis (Democratic) Unopposed |
Alaska
| District | Incumbent | Party | First elected |
Results | Candidates |
|---|---|---|---|---|---|
| Alaska at-large | Don Young | Republican | 1973 | Incumbent re-elected. | √ Don Young (Republican) 50.2% Ethan Berkowitz (Democratic) 45.0% Don Wright (Alaskan Independence) 4.5% |
Arizona
| District | Incumbent | Party | First elected |
Results | Candidates |
|---|---|---|---|---|---|
| Arizona 1 | Rick Renzi | Republican | 2002 | Incumbent retired. New member elected. Democratic gain. |
√ Ann Kirkpatrick (Democratic) 55.9% Sydney Hay (Republican) 39.4% Brent Maupin (Independent) 3.4% Thane Eichenauer (Libertarian) 1.3% |
| Arizona 2 | Trent Franks | Republican | 2002 | Incumbent re-elected. | √ Trent Franks (Republican) 59.4% John Thrasher (Democratic) 37.2% Powell Gammill (Libertarian) 2.3% William Crum (Green) 1.1% |
| Arizona 3 | John Shadegg | Republican | 1994 | Incumbent re-elected. | √ John Shadegg (Republican) 54.1% Bob Lord (Democratic) 42.1% Michael Shoen (Libertarian) 3.8% |
| Arizona 4 | Ed Pastor | Democratic | 1991 | Incumbent re-elected. | √ Ed Pastor (Democratic) 72.1% Don Karg (Republican) 21.2% Rebecca DeWitt (Green) 3.6% Joe Cobb (Libertarian) 3.1% |
| Arizona 5 | Harry Mitchell | Democratic | 2006 | Incumbent re-elected. | √ Harry Mitchell (Democratic) 53.2% David Schweikert (Republican) 43.6% Warren Severin (Libertarian) 3.2% |
| Arizona 6 | Jeff Flake | Republican | 2000 | Incumbent re-elected. | √ Jeff Flake (Republican) 62.5% Rebecca Schneider (Democratic) 34.5% Rick Biondi (Libertarian) 3.0% |
| Arizona 7 | Raul Grijalva | Democratic | 2002 | Incumbent re-elected. | √ Raul Grijalva (Democratic) 63.3% Joseph Sweeney (Republican) 32.8% Raymond Patrick Petrulsky (Libertarian) 3.9% |
| Arizona 8 | Gabrielle Giffords | Democratic | 2006 | Incumbent re-elected. | √ Gabrielle Giffords (Democratic) 54.7% Tim Bee (Republican) 42.8% Paul Davis (Libertarian) 2.5% |
Arkansas
| District | Incumbent | Party | First elected |
Results | Candidates |
|---|---|---|---|---|---|
| Arkansas 1 | Marion Berry | Democratic | 1996 | Incumbent re-elected. | √ Marion Berry (Democratic) Unopposed |
| Arkansas 2 | Vic Snyder | Democratic | 1996 | Incumbent re-elected. | √ Vic Snyder (Democratic) 76.5% Deb McFarland (Green) 23.2% Danial Suits (Write-In) 0.2% |
| Arkansas 3 | John Boozman | Republican | 2000 | Incumbent re-elected. | √ John Boozman (Republican) 78.5% Abel Tomlinson (Green) 21.5% |
| Arkansas 4 | Mike Ross | Democratic | 2000 | Incumbent re-elected. | √ Mike Ross (Democratic) 86.2% Joshua Drake (Green) 13.8% |
California
| District | Incumbent | Party | First elected |
Results | Candidates |
|---|---|---|---|---|---|
| California 1 | Mike Thompson | Democratic | 1998 | Incumbent re-elected. | √ Mike Thompson (Democratic) 68.2% Zane Starkewolf (Republican) 23.3% Carol Wolman (Green) 8.5% |
| California 2 | Wally Herger | Republican | 1986 | Incumbent re-elected. | √ Wally Herger (Republican) 57.9% Jeff Morris (Democratic) 42.1% |
| California 3 | Dan Lungren | Republican | 1998 | Incumbent re-elected. | √ Dan Lungren (Republican) 49.5% Bill Durston (Democratic) 44.0% Dina Padilla (Peace and Freedom) 4.2% Douglas Arthur Tuma (Libertarian) 2.3% |
| California 4 | John Doolittle | Republican | 1990 | Incumbent retired. New member elected. Republican hold. |
√ Tom McClintock (Republican) 50.3% Charles Brown (Democratic) 49.7% |
| California 5 | Doris Matsui | Democratic | 2005 | Incumbent re-elected. | √ Doris Matsui (Democratic) 74.3% Paul Smith (Republican) 20.9% L.R. Roberts (Peace and Freedom) 4.8% |
| California 6 | Lynn Woolsey | Democratic | 1992 | Incumbent re-elected. | √ Lynn Woolsey (Democratic) 71.7% Mike Halliwell (Republican) 24.1% Joel Smolen (Libertarian) 4.2% |
| California 7 | George Miller | Democratic | 1974 | Incumbent re-elected. | √ George Miller (Democratic) 72.9% Roger Allen Petersen (Republican) 21.8% Bill Callison (Peace and Freedom) 2.8% Camden McConnell (Libertarian) 2.5% |
| California 8 | Nancy Pelosi | Democratic | 1987 | Incumbent re-elected. | √ Nancy Pelosi (Democratic) 71.9% Cindy Sheehan (Independent) 16.2% Dana Walsh (Republican) 9.7% Philip Berg (Libertarian) 2.2% |
| California 9 | Barbara Lee | Democratic | 1998 | Incumbent re-elected. | √ Barbara Lee (Democratic) 86.1% Charles Hargrave (Republican) 9.7% James Eyer (Libertarian) 4.2% |
| California 10 | Ellen Tauscher | Democratic | 1996 | Incumbent re-elected. | √ Ellen Tauscher (Democratic) 65.2% Nicholas Gerber (Republican) 31.1% Eugene Ruyle (Peace and Freedom) 3.7% |
| California 11 | Jerry McNerney | Democratic | 2006 | Incumbent re-elected. | √ Jerry McNerney (Democratic) 55.3% Dean Andal (Republican) 44.7% |
| California 12 | Jackie Speier | Democratic | April 8, 2008 (Special) |
Incumbent re-elected. | √ Jackie Speier (Democratic) 75.2% Greg Conlon (Republican) 18.5% Nathalie Hrizi (Peace and Freedom) 2.2% Barry Hermanson (Green) 2.1% Kevin Dempsey Peterson (Libertarian) 2.0% |
| California 13 | Pete Stark | Democratic | 1972 | Incumbent re-elected. | √ Pete Stark (Democratic) 76.5% Raymond Chui (Republican) 23.5% |
| California 14 | Anna Eshoo | Democratic | 1992 | Incumbent re-elected. | √ Anna Eshoo (Democratic) 69.8% Ronny Santana (Republican) 22.3% Brian Holtz (Libertarian) 4.3% Carol Brouillet (Green) 3.6% |
| California 15 | Mike Honda | Democratic | 2000 | Incumbent re-elected. | √ Mike Honda (Democratic) 71.7% Joyce Stoer Cordi (Republican) 23.3% Peter Myers (Green) 5.0% |
| California 16 | Zoe Lofgren | Democratic | 1994 | Incumbent re-elected. | √ Zoe Lofgren (Democratic) 71.4% Charel Winston (Republican) 24.0% Steven Wells (Libertarian) 4.6% |
| California 17 | Sam Farr | Democratic | 1992 | Incumbent re-elected. | √ Sam Farr (Democratic) 73.9% Jeff Taylor (Republican) 25.9% Peter Andresen (Write-In) 0.2% |
| California 18 | Dennis Cardoza | Democratic | 2002 | Incumbent re-elected. | √ Dennis Cardoza (Democratic) Unopposed |
| California 19 | George Radanovich | Republican | 1994 | Incumbent re-elected. | √ George Radanovich (Republican) 98.5% Peter Leinau (Write-In) 1.3% Phil Rockey (Write-In) 0.2% |
| California 20 | Jim Costa | Democratic | 2004 | Incumbent re-elected. | √ Jim Costa (Democratic) 74.4% Jim Lopez (Republican) 25.6% |
| California 21 | Devin Nunes | Republican | 2002 | Incumbent re-elected. | √ Devin Nunes (Republican) 68.4% Larry Johnson (Democratic) 31.6% |
| California 22 | Kevin McCarthy | Republican | 2006 | Incumbent re-elected. | √ Kevin McCarthy (Republican) Unopposed |
| California 23 | Lois Capps | Democratic | 1998 | Incumbent re-elected. | √ Lois Capps (Democratic) 68.1% Matt Kokkonen (Republican) 31.9% |
| California 24 | Elton Gallegly | Republican | 1986 | Incumbent re-elected. | √ Elton Gallegly (Republican) 58.2% Marta Ann Jorgensen (Democratic) 41.8% |
| California 25 | Howard McKeon | Republican | 1992 | Incumbent re-elected. | √ Howard McKeon (Republican) 57.8% Jackie Conaway (Democratic) 42.2% |
| California 26 | David Dreier | Republican | 1980 | Incumbent re-elected. | √ David Dreier (Republican) 52.7% Russ Warner (Democratic) 40.4% Ted Brown (Libertarian) 6.9% |
| California 27 | Brad Sherman | Democratic | 1996 | Incumbent re-elected. | √ Brad Sherman (Democratic) 68.6% Navraj Singh (Republican) 24.8% Tim Denton (Libertarian) 6.6% |
| California 28 | Howard Berman | Democratic | 1982 | Incumbent re-elected. | √ Howard Berman (Democratic) 99.9% Michael J. Koch (Write-In) 0.1% |
| California 29 | Adam Schiff | Democratic | 2000 | Incumbent re-elected. | √ Adam Schiff (Democratic) 69.0% Charles Hahn (Republican) 26.7% Alan Pyeatt (Libertarian) 4.3% |
| California 30 | Henry Waxman | Democratic | 1974 | Incumbent re-elected. | √ Henry Waxman (Democratic) Unopposed |
| California 31 | Xavier Becerra | Democratic | 1992 | Incumbent re-elected. | √ Xavier Becerra (Democratic) Unopposed |
| California 32 | Hilda Solis | Democratic | 2000 | Incumbent re-elected. | √ Hilda Solis (Democratic) Unopposed |
| California 33 | Diane Watson | Democratic | 2001 | Incumbent re-elected. | √ Diane Watson (Democratic) 87.6% David Crowley (Republican) 12.4% |
| California 34 | Lucille Roybal-Allard | Democratic | 1992 | Incumbent re-elected. | √ Lucille Roybal-Allard (Democratic) 77.1% Christopher Balding (Republican) 22.9% |
| California 35 | Maxine Waters | Democratic | 1990 | Incumbent re-elected. | √ Maxine Waters (Democratic) 82.6% Ted Hayes (Republican) 13.3% Herb Peters (Libertarian) 4.1% |
| California 36 | Jane Harman | Democratic | 1992 | Incumbent re-elected. | √ Jane Harman (Democratic) 68.7% Brian Gibson (Republican) 31.3% |
| California 37 | Laura Richardson | Democratic | 2007 | Incumbent re-elected. | √ Laura Richardson (Democratic) 75.0% Nick Dibs (Independent) 24.4% Peter Mathews (Write-In) 0.3% June Viena Pouesi (Write-In) 0.3% |
| California 38 | Grace Napolitano | Democratic | 1998 | Incumbent re-elected. | √ Grace Napolitano (Democratic) 81.8% Christopher Agrella (Libertarian) 18.2% |
| California 39 | Linda Sánchez | Democratic | 2002 | Incumbent re-elected. | √ Linda Sánchez (Democratic) 69.7% Diane Lenning (Republican) 30.3% |
| California 40 | Ed Royce | Republican | 1992 | Incumbent re-elected. | √ Ed Royce (Republican) 62.6% Christina Avalos (Democratic) 37.4% |
| California 41 | Jerry Lewis | Republican | 1978 | Incumbent re-elected. | √ Jerry Lewis (Republican) 61.7% Tim Prince (Democratic) 38.3% |
| California 42 | Gary Miller | Republican | 1998 | Incumbent re-elected. | √ Gary Miller (Republican) 60.2% Ed Chau (Democratic) 39.8% |
| California 43 | Joe Baca | Democratic | 1999 | Incumbent re-elected. | √ Joe Baca (Democratic) 69.2% John Roberts (Republican) 30.8% |
| California 44 | Ken Calvert | Republican | 1992 | Incumbent re-elected. | √ Ken Calvert (Republican) 51.2% Bill Hedrick (Democratic) 48.8% |
| California 45 | Mary Bono | Republican | 1998 | Incumbent re-elected. | √ Mary Bono Mack (Republican) 58.3% Julie Bornstein (Democratic) 41.7% |
| California 46 | Dana Rohrabacher | Republican | 1988 | Incumbent re-elected. | √ Dana Rohrabacher (Republican) 52.6% Debbie Cook (Democratic) 43.1% Thomas Lash (Green) 2.8% Ernst Gasteiger (Libertarian) 1.5% |
| California 47 | Loretta Sanchez | Democratic | 1996 | Incumbent re-elected. | √ Loretta Sanchez (Democratic) 69.5% Rosie Avila (Republican) 25.5% Robert Lauten (American Independent) 5.0% |
| California 48 | John Campbell | Republican | 2005 | Incumbent re-elected. | √ John Campbell (Republican) 55.7% Steve Young (Democratic) 40.6% Don Patterson (Libertarian) 3.7% |
| California 49 | Darrell Issa | Republican | 2000 | Incumbent re-elected. | √ Darrell Issa (Republican) 58.3% Robert Hamilton (Democratic) 37.5% Lars Grossmith (Libertarian) 4.2% |
| California 50 | Brian Bilbray | Republican | 2006 | Incumbent re-elected. | √ Brian Bilbray (Republican) 50.3% Nick Leibham (Democratic) 45.2% Wayne Dunlap (Libertarian) 4.5% |
| California 51 | Bob Filner | Democratic | 1992 | Incumbent re-elected. | √ Bob Filner (Democratic) 72.8% David Lee Joy (Republican) 24.2% Dan Litwin (Libertarian) 3.0% |
| California 52 | Duncan L. Hunter | Republican | 1980 | Incumbent retired. New member elected. Republican hold. |
√ Duncan D. Hunter (Republican) 56.4% Mike Lumpkin (Democratic) 39.0% Michael Benoit (Libertarian) 4.6% |
| California 53 | Susan Davis | Democratic | 2000 | Incumbent re-elected. | √ Susan Davis (Democratic) 68.5% Michael Crimmins (Republican) 27.5% Edward Teyssier (Libertarian) 4.0% |
Colorado
| District | Incumbent | Party | First elected |
Results | Candidates |
|---|---|---|---|---|---|
| Colorado 1 | Diana DeGette | Democratic | 1996 | Incumbent re-elected. | √ Diana DeGette (Democratic) 71.9% George Lilly (Republican) 23.8% Martin Buchanan (Libertarian) 4.3% |
| Colorado 2 | Mark Udall | Democratic | 1998 | Incumbent retired to run for U.S. Senator | √ Jared Polis (Democratic) 62.6% Scott Starin (Republican) 33.9% J.A. Calhoun (Green) 2.9% Bill Hammons (Unity) 0.6% |
| Colorado 3 | John Salazar | Democratic | 2004 | Incumbent re-elected. | √ John Salazar (Democratic) 61.6% Wayne Wolf (Republican) 38.4% |
| Colorado 4 | Marilyn Musgrave | Republican | 2002 | Incumbent lost re-election. New member elected. Democratic gain. |
√ Betsy Markey (Democratic) 56.2% Marilyn Musgrave (Republican) 43.8% |
| Colorado 5 | Doug Lamborn | Republican | 2006 | Incumbent re-elected. | √ Doug Lamborn (Republican) 60.0% Hal Bidlack (Democratic) 37.0% Brian Scott (Constitution) 2.9% |
| Colorado 6 | Tom Tancredo | Republican | 1998 | Incumbent retired. New member elected. Republican hold. |
√ Mike Coffman (Republican) 60.7% Hank Eng (Democratic) 39.3% |
| Colorado 7 | Ed Perlmutter | Democratic | 2006 | Incumbent re-elected. | √ Ed Perlmutter (Democratic) 63.5% John Lerew (Republican) 36.5% |
Connecticut
| District | Incumbent | Party | First elected |
Results | Candidates |
|---|---|---|---|---|---|
| Connecticut 1 | John Larson | Democratic | 1998 | Incumbent re-elected. | √ John Larson (Democratic) 71.6% Joe Visconti (Republican) 26.0% Stephen Fournier (Green) 2.4% |
| Connecticut 2 | Joe Courtney | Democratic | 2006 | Incumbent re-elected. | √ Joe Courtney (Democratic) 65.7% Sean Sullivan (Republican) 32.4% Scott Deshefy (Green) 1.9% |
| Connecticut 3 | Rosa DeLauro | Democratic | 1990 | Incumbent re-elected. | √ Rosa DeLauro (Democratic) 77.4% Bo Itshaky (Republican) 19.7% Ralph Ferrucci (Green) 2.9% |
| Connecticut 4 | Chris Shays | Republican | 1987 | Incumbent lost re-election. New member elected. Democratic gain. |
√ Jim Himes (Democratic) 51.3% Chris Shays (Republican) 47.6% Michael Carrano (Libertarian) 0.7% Richard Duffee (Green) 0.4% |
| Connecticut 5 | Chris Murphy | Democratic | 2006 | Incumbent re-elected. | √ Chris Murphy (Democratic) 59.2% David Cappiello (Republican) 39.0% Harold Burbank (Green) 1.0% Thomas Winn (Independent) 0.8% |
Delaware
| District | Incumbent | Party | First elected |
Results | Candidates |
|---|---|---|---|---|---|
| Delaware at-large | Michael Castle | Republican | 1992 | Incumbent re-elected. | √ Michael Castle (Republican) 61.1% Karen Hartley-Nagle (Democratic) 38.0% Mark Anthony Parks (Libertarian) 0.9% |
Florida
| District | Incumbent | Party | First elected |
Results | Candidates |
|---|---|---|---|---|---|
| Florida 1 | Jeff Miller | Republican | 2001 | Incumbent re-elected. | √ Jeff Miller (Republican) 70.2% James Jim Bryan (Democratic) 29.8% |
| Florida 2 | Allen Boyd | Democratic | 1996 | Incumbent re-elected. | √ Allen Boyd (Democratic) 61.9% Mark Mulligan (Republican) 38.1% |
| Florida 3 | Corrine Brown | Democratic | 1992 | Incumbent re-elected. | √ Corrine Brown (Democratic) Unopposed |
| Florida 4 | Ander Crenshaw | Republican | 2000 | Incumbent re-elected. | √ Ander Crenshaw (Republican) 65.3% Jay McGovern (Democratic) 34.7% |
| Florida 5 | Ginny Brown-Waite | Republican | 2002 | Incumbent re-elected. | √ Ginny Brown-Waite (Republican) 61.2% John Russell (Democratic) 38.8% |
| Florida 6 | Cliff Stearns | Republican | 1988 | Incumbent re-elected. | √ Cliff Stearns (Republican) 60.9% Tim Cunha (Democratic) 39.1% |
| Florida 7 | John Mica | Republican | 1992 | Incumbent re-elected. | √ John Mica (Republican) 62.0% Faye Armitage (Democratic) 38.0% |
| Florida 8 | Ric Keller | Republican | 2000 | Incumbent lost re-election. New member elected. Democratic gain. |
√ Alan Grayson (Democratic) 52.0% Ric Keller (Republican) 48.0% |
| Florida 9 | Gus Bilirakis | Republican | 2006 | Incumbent re-elected. | √ Gus Bilirakis (Republican) 62.2% Bill Mitchell (Democratic) 36.3% John Kalimnios (Independent) 1.0% Richard Emmons (Term Limits) 0.6% |
| Florida 10 | Bill Young | Republican | 1970 | Incumbent re-elected. | √ Bill Young (Republican) 60.7% Bob Hackworth (Democratic) 39.3% |
| Florida 11 | Kathy Castor | Democratic | 2006 | Incumbent re-elected. | √ Kathy Castor (Democratic) 71.7% Eddie Adams (Republican) 28.3% |
| Florida 12 | Adam Putnam | Republican | 2000 | Incumbent re-elected. | √ Adam Putnam (Republican) 57.5% Doug Tudor (Democratic) 42.5% |
| Florida 13 | Vern Buchanan | Republican | 2006 | Incumbent re-elected. | √ Vern Buchanan (Republican) 55.5% Christine Jennings (Democratic) 37.5% Jan Schneider (Independent) 5.5% Don Baldauf (Independent) 1.5% |
| Florida 14 | Connie Mack IV | Republican | 2004 | Incumbent re-elected. | √ Connie Mack (Republican) 59.4% Robert Neeld (Democratic) 24.8% Burt Saunders (Independent) 14.5% Jeff George (Independent) 1.3% |
| Florida 15 | Dave Weldon | Republican | 1994 | Incumbent retired. New member elected. Republican hold. |
√ Bill Posey (Republican) 53.1% Stephen Blythe (Democratic) 42.0% Frank Zilaitis (Independent) 3.9% Trevor Lowing (Independent) 1.0% |
| Florida 16 | Tim Mahoney | Democratic | 2006 | Incumbent lost re-election. New member elected. Republican gain. |
√ Tom Rooney (Republican) 60.1% Tim Mahoney (Democratic) 39.9% |
| Florida 17 | Kendrick Meek | Democratic | 2002 | Incumbent re-elected. | √ Kendrick Meek (Democratic) Unopposed |
| Florida 18 | Ileana Ros-Lehtinen | Republican | 1989 | Incumbent re-elected. | √ Ileana Ros-Lehtinen (Republican) 57.9% Annette Taddeo (Democratic) 42.1% |
| Florida 19 | Robert Wexler | Democratic | 1996 | Incumbent re-elected. | √ Robert Wexler (Democratic) 66.2% Edward Lynch (Republican) 27.2% Ben Graber (Independent) 6.6% |
| Florida 20 | Debbie Wasserman Schultz | Democratic | 2004 | Incumbent re-elected. | √ Debbie Wasserman Schultz (Democratic) 77.5% Margaret Hostetter (Independent) 22.5% |
| Florida 21 | Lincoln Diaz-Balart | Republican | 1992 | Incumbent re-elected. | √ Lincoln Diaz-Balart (Republican) 57.9% Raul Martinez (Democratic) 42.1% |
| Florida 22 | Ron Klein | Democratic | 2006 | Incumbent re-elected. | √ Ron Klein (Democratic) 54.7% Allen West (Republican) 45.3% |
| Florida 23 | Alcee Hastings | Democratic | 1992 | Incumbent re-elected. | √ Alcee Hastings (Democratic) 82.1% Marion Thorpe (Republican) 17.8% |
| Florida 24 | Tom Feeney | Republican | 2002 | Incumbent lost re-election. New member elected. Democratic gain. |
√ Suzanne Kosmas (Democratic) 57.2% Tom Feeney (Republican) 41.1% Gaurav Bhola (Independent) 1.7% |
| Florida 25 | Mario Diaz-Balart | Republican | 2002 | Incumbent re-elected. | √ Mario Diaz-Balart (Republican) 53.1% Joe Garcia (Democratic) 46.9% |
Georgia
| District | Incumbent | Party | First elected |
Results | Candidates |
|---|---|---|---|---|---|
| Georgia 1 | Jack Kingston | Republican | 1992 | Incumbent re-elected. | √ Jack Kingston (Republican) 66.5% Bill Gillespie (Democratic) 33.5% |
| Georgia 2 | Sanford Bishop | Democratic | 1992 | Incumbent re-elected. | √ Sanford Bishop (Democratic) 68.9% Lee Ferrell (Republican) 31.1% |
| Georgia 3 | Lynn Westmoreland | Republican | 2004 | Incumbent re-elected. | √ Lynn Westmoreland (Republican) 65.7% Stephen Camp (Democratic) 34.3% |
| Georgia 4 | Hank Johnson | Democratic | 2006 | Incumbent re-elected. | √ Hank Johnson (Democratic) 99.9% Loren Christopher Collins (Write-In) 0.1% |
| Georgia 5 | John Lewis | Democratic | 1986 | Incumbent re-elected. | √ John Lewis (Democratic) Unopposed |
| Georgia 6 | Tom Price | Republican | 2004 | Incumbent re-elected. | √ Tom Price (Republican) 68.5% Bill Jones (Democratic) 31.5% |
| Georgia 7 | John Linder | Republican | 1992 | Incumbent re-elected. | √ John Linder (Republican) 62.0% Doug Heckman (Democratic) 38.0% |
| Georgia 8 | Jim Marshall | Democratic | 2002 | Incumbent re-elected. | √ Jim Marshall (Democratic) 57.2% Rick Goddard (Republican) 42.8% |
| Georgia 9 | Nathan Deal | Republican | 1992 | Incumbent re-elected. | √ Nathan Deal (Republican) 75.5% Jeff Scott (Democratic) 24.5% |
| Georgia 10 | Paul Broun | Republican | 2007 | Incumbent re-elected. | √ Paul Broun (Republican) 60.7% Bobby Saxon (Democratic) 39.3% |
| Georgia 11 | Phil Gingrey | Republican | 2002 | Incumbent re-elected. | √ Phil Gingrey (Republican) 68.2% Hugh Gammon (Democratic) 31.8% |
| Georgia 12 | John Barrow | Democratic | 2004 | Incumbent re-elected. | √ John Barrow (Democratic) 66.0% John Stone (Republican) 34.0% |
| Georgia 13 | David Scott | Democratic | 2002 | Incumbent re-elected. | √ David Scott (Democratic) 69.0% Deborah Honeycutt (Republican) 31.0% |
Hawaii
| District | Incumbent | Party | First elected |
Results | Candidates |
|---|---|---|---|---|---|
| Hawaii 1 | Neil Abercrombie | Democratic | 1990 | Incumbent re-elected. | √ Neil Abercrombie (Democratic) 77.1% Steve Tataii (Republican) 19.1% Li Zhao (Libertarian) 3.8% |
| Hawaii 2 | Mazie Hirono | Democratic | 2006 | Incumbent re-elected. | √ Mazie Hirono (Democratic) 76.1% Roger B. Evans (Republican) 20.4% Shaun Stenshol (Independent) 1.9% Jeff Mallan (Libertarian) 1.7% |
Idaho
| District | Incumbent | Party | First elected |
Results | Candidates |
|---|---|---|---|---|---|
| Idaho 1 | Bill Sali | Republican | 2006 | Incumbent lost re-election. New member elected. Democratic gain. |
√ Walt Minnick (Democratic) 50.6% Bill Sali (Republican) 49.4% |
| Idaho 2 | Mike Simpson | Republican | 1998 | Incumbent re-elected. | √ Mike Simpson (Republican) 71.0% Debbie Holmes (Democratic) 29.0% |
Illinois
| District | Incumbent | Party | First elected |
Results | Candidates |
|---|---|---|---|---|---|
| Illinois 1 | Bobby Rush | Democratic | 1992 | Incumbent re-elected. | √ Bobby Rush (Democratic) 85.9% Antoine Members (Republican) 14.1% |
| Illinois 2 | Jesse Jackson Jr. | Democratic | 1995 | Incumbent re-elected. | √ Jesse Jackson Jr. (Democratic) 89.4% Anthony Williams (Republican) 10.6% |
| Illinois 3 | Dan Lipinski | Democratic | 2004 | Incumbent re-elected. | √ Dan Lipinski (Democratic) 73.3% Michael Hawkins (Republican) 21.4% Jerome Pohlen (Green) 5.3% |
| Illinois 4 | Luis Gutiérrez | Democratic | 1992 | Incumbent re-elected. | √ Luis Gutiérrez (Democratic) 80.6% Daniel Cunningham (Republican) 11.5% Omar Lopez (Green) 7.9% |
| Illinois 5 | Rahm Emanuel | Democratic | 2002 | Incumbent re-elected. | √ Rahm Emanuel (Democratic) 73.9% Tom Hanson (Republican) 22.0% Alan Augustson (Green) 4.1% |
| Illinois 6 | Peter Roskam | Republican | 2006 | Incumbent re-elected. | √ Peter Roskam (Republican) 57.6% Jill Morgenthaler (Democratic) 42.4% |
| Illinois 7 | Danny Davis | Democratic | 1996 | Incumbent re-elected. | √ Danny Davis (Democratic) 85.0% Steve Miller (Republican) 15.0% |
| Illinois 8 | Melissa Bean | Democratic | 2004 | Incumbent re-elected. | √ Melissa Bean (Democratic) 60.7% Steve Greenberg (Republican) 39.3% |
| Illinois 9 | Jan Schakowsky | Democratic | 1998 | Incumbent re-elected. | √ Jan Schakowsky (Democratic) 74.7% Michael Younan (Republican) 22.0% Morris Shanfield (Green) 3.3% |
| Illinois 10 | Mark Kirk | Republican | 2000 | Incumbent re-elected. | √ Mark Kirk (Republican) 52.6% Daniel Seals (Democratic) 47.4% |
| Illinois 11 | Jerry Weller | Republican | 1994 | Incumbent retired. New member elected. Democratic gain. |
√ Debbie Halvorson (Democratic) 58.4% Marty Ozinga (Republican) 34.5% Jason Wallace (Green) 7.1% |
| Illinois 12 | Jerry Costello | Democratic | 1988 | Incumbent re-elected. | √ Jerry Costello (Democratic) 71.1% Tim Richardson (Republican) 25.0% Rodger Jennings (Green) 3.9% |
| Illinois 13 | Judy Biggert | Republican | 1998 | Incumbent re-elected. | √ Judy Biggert (Republican) 53.6% Scott Harper (Democratic) 43.7% Steve Alesch (Green) 2.7% |
| Illinois 14 | Bill Foster | Democratic | March 8, 2008 (Special) |
Incumbent re-elected. | √ Bill Foster (Democratic) 57.7% Jim Oberweis (Republican) 42.3% |
| Illinois 15 | Tim Johnson | Republican | 2000 | Incumbent re-elected. | √ Tim Johnson (Republican) 64.2% Steve Cox (Democratic) 35.8% |
| Illinois 16 | Donald Manzullo | Republican | 1992 | Incumbent re-elected. | √ Donald Manzullo (Republican) 60.9% Bob Abboud (Democratic) 36.1% Scott Summers (Green) 3.0% |
| Illinois 17 | Phil Hare | Democratic | 2006 | Incumbent re-elected. | √ Phil Hare (Democratic) Unopposed |
| Illinois 18 | Ray LaHood | Republican | 1994 | Incumbent retired. New member elected. Republican hold. |
√ Aaron Schock (Republican) 58.9% Colleen Callahan (Democratic) 37.9% Sheldon Schafer (Green) 3.2% |
| Illinois 19 | John Shimkus | Republican | 1996 | Incumbent re-elected. | √ John Shimkus (Republican) 64.5% Daniel Davis (Democratic) 33.4% Troy Dennis (Green) 2.1% |
Indiana
| District | Incumbent | Party | First elected |
Results | Candidates |
|---|---|---|---|---|---|
| Indiana 1 | Pete Visclosky | Democratic | 1984 | Incumbent re-elected. | √ Pete Visclosky (Democratic) 70.9% Mark Leyva (Republican) 27.2% Jeff Duensing (Libertarian) 1.9% |
| Indiana 2 | Joe Donnelly | Democratic | 2006 | Incumbent re-elected. | √ Joe Donnelly (Democratic) 67.1% Luke Puckett (Republican) 30.2% Mark Vogel (Libertarian) 2.7% |
| Indiana 3 | Mark Souder | Republican | 1994 | Incumbent re-elected. | √ Mark Souder (Republican) 55.0% Mike Montagano (Democratic) 39.7% William Larsen (Libertarian) 5.3% |
| Indiana 4 | Steve Buyer | Republican | 1992 | Incumbent re-elected. | √ Steve Buyer (Republican) 59.9% Nels Ackerson (Democratic) 40.1% |
| Indiana 5 | Dan Burton | Republican | 1982 | Incumbent re-elected. | √ Dan Burton (Republican) 65.5% Mary Etta Ruley (Democratic) 34.5% |
| Indiana 6 | Mike Pence | Republican | 2000 | Incumbent re-elected. | √ Mike Pence (Republican) 63.9% Barry Welsh (Democratic) 33.4% George Holland (Libertarian) 2.7% |
| Indiana 7 | André Carson | Democratic | March 11, 2008 (Special) |
Incumbent re-elected. | √ André Carson (Democratic) 65.1% Gabrielle Campo (Republican) 34.9% |
| Indiana 8 | Brad Ellsworth | Democratic | 2006 | Incumbent re-elected. | √ Brad Ellsworth (Democratic) 64.7% Greg Goode (Republican) 35.3% |
| Indiana 9 | Baron Hill | Democratic | 2006 | Incumbent re-elected. | √ Baron Hill (Democratic) 57.8% Mike Sodrel (Republican) 38.4% D. Eric Schansberg (Libertarian) 3.8% |
Iowa
| District | Incumbent | Party | First elected |
Results | Candidates |
|---|---|---|---|---|---|
| Iowa 1 | Bruce Braley | Democratic | 2006 | Incumbent re-elected. | √ Bruce Braley (Democratic) 64.6% David Hartsuch (Republican) 35.4% |
| Iowa 2 | David Loebsack | Democratic | 2006 | Incumbent re-elected. | √ David Loebsack (Democratic) 57.2% Mariannette Miller-Meeks (Republican) 38.8% Wendy Barth (Green) 2.2% Brian White (Independent) 1.8% |
| Iowa 3 | Leonard Boswell | Democratic | 1996 | Incumbent re-elected. | √ Leonard Boswell (Democratic) 56.4% Kim Schmett (Republican) 42.1% Frank Forrestal (Socialist Workers) 1.5% |
| Iowa 4 | Tom Latham | Republican | 1994 | Incumbent re-elected. | √ Tom Latham (Republican) 60.6% Becky Greenwald (Democratic) 39.4% |
| Iowa 5 | Steve King | Republican | 2002 | Incumbent re-elected. | √ Steve King (Republican) 59.8% Rob Hubler (Democratic) 37.4% Victor Vara (Independent) 2.8% |
Kansas
| District | Incumbent | Party | First elected |
Results | Candidates |
|---|---|---|---|---|---|
| Kansas 1 | Jerry Moran | Republican | 1996 | Incumbent re-elected. | √ Jerry Moran (Republican) 81.8% James Bordonaro (Democratic) 13.2% Kathleen Burton (Reform) 2.7% Jack Warner (Libertarian) 2.1% |
| Kansas 2 | Nancy Boyda | Democratic | 2006 | Incumbent lost re-election. New member elected. Republican gain. |
√ Lynn Jenkins (Republican) 50.6% Nancy Boyda (Democratic) 46.2% Leslie Martin (Reform) 1.6% Robert Garrard (Libertarian) 1.5% |
| Kansas 3 | Dennis Moore | Democratic | 1998 | Incumbent re-elected. | √ Dennis Moore (Democratic) 56.4% Nick Jordan (Republican) 39.6% Joe Bellis (Libertarian) 2.8% Roger Tucker (Reform) 1.0% |
| Kansas 4 | Todd Tiahrt | Republican | 1994 | Incumbent re-elected. | √ Todd Tiahrt (Republican) 63.4% Donald Betts Jr. (Democratic) 32.3% Susan Ducey (Reform) 2.2% Steve Rosile (Libertarian) 1.9% |
Kentucky
| District | Incumbent | Party | First elected |
Results | Candidates |
|---|---|---|---|---|---|
| Kentucky 1 | Ed Whitfield | Republican | 1994 | Incumbent re-elected. | √ Ed Whitfield (Republican) 64.3% Heather Ryan (Democratic) 35.7% |
| Kentucky 2 | Ron Lewis | Republican | 1994 | Incumbent retired. New member elected. Republican hold. |
√ Brett Guthrie (Republican) 52.6% David Boswell (Democratic) 47.4% |
| Kentucky 3 | John Yarmuth | Democratic | 2006 | Incumbent re-elected. | √ John Yarmuth (Democratic) 59.4% Anne Northup (Republican) 40.6% |
| Kentucky 4 | Geoff Davis | Republican | 2004 | Incumbent re-elected. | √ Geoff Davis (Republican) 63.0% Michael Kelly (Democratic) 37.0% |
| Kentucky 5 | Hal Rogers | Republican | 1980 | Incumbent re-elected. | √ Hal Rogers (Republican) 84.1% Jim Holbert (Independent) 15.9% |
| Kentucky 6 | Ben Chandler | Democratic | 2004 | Incumbent re-elected. | √ Ben Chandler (Democratic) 64.7% Jon Larson (Republican) 35.3% |
Louisiana
Note: In Louisiana's 2nd and 4th districts, primary runoffs were held November 4, 2008 and the general election for both of these races were held December 6, 2008.
| District | Incumbent | Party | First elected |
Results | Candidates |
|---|---|---|---|---|---|
| Louisiana 1 | Steve Scalise | Republican | May 3, 2008 (Special) |
Incumbent re-elected. | √ Steve Scalise (Republican) 65.7% Jim Harlan (Democratic) 34.3% |
| Louisiana 2 | Bill Jefferson | Democratic | 1990 | Incumbent lost re-election. New member elected. Republican gain. |
√ Joseph Cao (Republican) 49.5% Bill Jefferson (Democratic) 46.8% Malik Rahim (Green) 2.8% Gregory Kahn (Libertarian) 0.8% |
| Louisiana 3 | Charlie Melancon | Democratic | 2004 | Incumbent re-elected. | √ Charlie Melancon (Democratic) Unopposed |
| Louisiana 4 | Jim McCrery | Republican | 1988 | Incumbent retired. New member elected. Republican hold. |
√ John Fleming (Republican) 48.1% Paul Carmouche (Democratic) 47.7% Chester T. Kelly (Independent) 3.5% Gerard Bowen Jr. (Independent) 0.7% |
| Louisiana 5 | Rodney Alexander | Republican | 2002 | Incumbent re-elected. | √ Rodney Alexander (Republican) Unopposed |
| Louisiana 6 | Don Cazayoux | Democratic | May 3, 2008 (Special) |
Incumbent lost re-election. New member elected. Republican gain. |
√ Bill Cassidy (Republican) 48.1% Don Cazayoux (Democratic) 40.3% Michael Jackson (Independent) 11.6% |
| Louisiana 7 | Charles Boustany | Republican | 2004 | Incumbent re-elected. | √ Charles Boustany (Republican) 61.9% Don Cravins Jr. (Democratic) 34.3% Peter Vidrine (Constitution) 3.8% |
Maine
| District | Incumbent | Party | First elected |
Results | Candidates |
|---|---|---|---|---|---|
| Maine 1 | Tom Allen | Democratic | 1996 | Incumbent retired to run for U.S. Senator. New member elected. Democratic hold. |
√ Chellie Pingree (Democratic) 54.9% Charlie Summers (Republican) 45.1% |
| Maine 2 | Mike Michaud | Democratic | 2002 | Incumbent re-elected. | √ Mike Michaud (Democratic) 67.4% John Frary (Republican) 32.6% |
Maryland
| District | Incumbent | Party | First elected |
Results | Candidates |
|---|---|---|---|---|---|
| Maryland 1 | Wayne Gilchrest | Republican | 1990 | Incumbent lost renomination. New member elected. Democratic gain. |
√ Frank Kratovil (Democratic) 49.1% Andy Harris (Republican) 48.3% Richard James Davis (Libertarian) 2.5% |
| Maryland 2 | Dutch Ruppersberger | Democratic | 2002 | Incumbent re-elected. | √ Dutch Ruppersberger (Democratic) 71.9% Richard Matthews (Republican) 24.8% Lorenzo Gaztanaga (Libertarian) 3.2% |
| Maryland 3 | John Sarbanes | Democratic | 2006 | Incumbent re-elected. | √ John Sarbanes (Democratic) 69.7% Tom Harris (Republican) 30.1% |
| Maryland 4 | Donna Edwards | Democratic | June 17, 2008 (Special) |
Incumbent re-elected. | √ Donna Edwards (Democratic) 85.8% Peter James (Republican) 12.9% Thibeaux Lincecum (Libertarian) 1.1% |
| Maryland 5 | Steny Hoyer | Democratic | 1981 | Incumbent re-elected. | √ Steny Hoyer (Democratic) 73.6% Collins Bailey (Republican) 24.0% Darlene H. Nicholas (Libertarian) 2.3% |
| Maryland 6 | Roscoe Bartlett | Republican | 1992 | Incumbent re-elected. | √ Roscoe Bartlett (Republican) 57.8% Jennifer Dougherty (Democratic) 38.8% Gary Hoover (Libertarian) 3.3% |
| Maryland 7 | Elijah Cummings | Democratic | 1996 | Incumbent re-elected. | √ Elijah Cummings (Democratic) 79.5% Michael Hargadon (Republican) 18.6% Ronald M. Owens-Bey (Libertarian) 1.8% |
| Maryland 8 | Chris Van Hollen Jr. | Democratic | 2002 | Incumbent re-elected. | √ Chris Van Hollen Jr. (Democratic) 75.1% Steve Hudson (Republican) 21.7% Gordon Clark (Green) 2.2% Ian Thomas (Libertarian) 0.8% |
Massachusetts
| District | Incumbent | Party | First elected |
Results | Candidates |
|---|---|---|---|---|---|
| Massachusetts 1 | John Olver | Democratic | 1991 | Incumbent re-elected. | √ John Olver (Democratic) 72.8% Nate Bech (Republican) 27.0% |
| Massachusetts 2 | Richard Neal | Democratic | 1988 | Incumbent re-elected. | √ Richard Neal (Democratic) Unopposed |
| Massachusetts 3 | Jim McGovern | Democratic | 1996 | Incumbent re-elected. | √ Jim McGovern (Democratic) Unopposed |
| Massachusetts 4 | Barney Frank | Democratic | 1980 | Incumbent re-elected. | √ Barney Frank (Democratic) 68.0% Earl Sholley (Republican) 25.3% Susan Allen (Independent) 6.6% |
| Massachusetts 5 | Niki Tsongas | Democratic | 2007 | Incumbent re-elected. | √ Niki Tsongas (Democratic) Unopposed |
| Massachusetts 6 | John Tierney | Democratic | 1996 | Incumbent re-elected. | √ John Tierney (Democratic) 70.4% Richard Baker (Republican) 29.5% |
| Massachusetts 7 | Ed Markey | Democratic | 1976 | Incumbent re-elected. | √ Ed Markey (Democratic) 75.6% John Cunningham (Republican) 24.2% |
| Massachusetts 8 | Mike Capuano | Democratic | 1998 | Incumbent re-elected. | √ Mike Capuano (Democratic) Unopposed |
| Massachusetts 9 | Stephen Lynch | Democratic | 2001 | Incumbent re-elected. | √ Stephen Lynch (Democratic) Unopposed |
| Massachusetts 10 | Bill Delahunt | Democratic | 1996 | Incumbent re-elected. | √ Bill Delahunt (Democratic) Unopposed |
Michigan
| District | Incumbent | Party | First elected |
Results | Candidates |
|---|---|---|---|---|---|
| Michigan 1 | Bart Stupak | Democratic | 1992 | Incumbent re-elected. | √ Bart Stupak (Democratic) 65.0% Tom Casperson (Republican) 32.7% Jean Marie Treacy (Green) 0.8% Dan Grow (Libertarian) 0.8% Joshua Warren (United States Taxpayers) 0.6% |
| Michigan 2 | Pete Hoekstra | Republican | 1992 | Incumbent re-elected. | √ Pete Hoekstra (Republican) 62.4% Fred Johnson (Democratic) 34.8% Dan Johnson (Libertarian) 1.6% Ron Graeser (United States Taxpayers) 1.2% |
| Michigan 3 | Vern Ehlers | Republican | 1993 | Incumbent re-elected. | √ Vern Ehlers (Republican) 61.1% Henry Sanchez (Democratic) 35.4% Erwin Haas (Libertarian) 3.4% |
| Michigan 4 | Dave Camp | Republican | 1990 | Incumbent re-elected. | √ Dave Camp (Republican) 61.9% Andrew Concannon (Democratic) 35.7% John Emerick (United States Taxpayers) 1.2% Allitta Hren (Libertarian) 1.1% |
| Michigan 5 | Dale Kildee | Democratic | 1976 | Incumbent re-elected. | √ Dale Kildee (Democratic) 70.4% Matt Sawicki (Republican) 27.0% Leonard Schwartz (Libertarian) 1.4% Ken Mathenia (Green) 1.3% |
| Michigan 6 | Fred Upton | Republican | 1986 | Incumbent re-elected. | √ Fred Upton (Republican) 58.9% Don Cooney (Democratic) 38.6% Greg Merle (Libertarian) 1.5% Edward Pinkney (Green) 1.1% |
| Michigan 7 | Tim Walberg | Republican | 2006 | Incumbent lost re-election. New member elected. Democratic gain. |
√ Mark Schauer (Democratic) 48.8% Tim Walberg (Republican) 46.5% Lynn Meadows (Green) 3.0% Ken Proctor (Libertarian) 1.8% |
| Michigan 8 | Mike Rogers | Republican | 2000 | Incumbent re-elected. | √ Mike Rogers (Republican) 56.5% Robert Alexander (Democratic) 40.2% Will Tyler White (Libertarian) 1.2% Aaron Stuttman (Green) 1.1% George Zimmer (United States Taxpayers) 1.0% |
| Michigan 9 | Joe Knollenberg | Republican | 1992 | Incumbent lost re-election. New member elected. Democratic gain. |
√ Gary Peters (Democratic) 52.1% Joe Knollenberg (Republican) 42.6% Jack Kevorkian (Independent) 2.6% Adam Goodman (Libertarian) 1.4% Douglas Campbell (Green) 1.4% |
| Michigan 10 | Candice Miller | Republican | 2002 | Incumbent re-elected. | √ Candice Miller (Republican) 66.3% Robert Denison (Democratic) 31.2% Neil Stephenson (Libertarian) 1.3% Candace Caveny (Green) 1.2% |
| Michigan 11 | Thad McCotter | Republican | 2002 | Incumbent re-elected. | √ Thad McCotter (Republican) 51.4% Joseph Larkin (Democratic) 45.4% John Tatar (Libertarian) 1.7% Erik Shelley (Green) 1.5% |
| Michigan 12 | Sander Levin | Democratic | 1982 | Incumbent re-elected. | √ Sander Levin (Democratic) 72.1% Bert Copple (Republican) 23.9% John Vico (Libertarian) 1.5% Les Townsend (United States Taxpayers) 1.3% William Opalicky (Green) 1.2% |
| Michigan 13 | Carolyn Kilpatrick | Democratic | 1996 | Incumbent re-elected. | √ Carolyn Kilpatrick (Democratic) 74.1% Edward Gubics (Republican) 19.1% George Corsetti (Green) 4.2% Greg Creswell (Libertarian) 2.6% |
| Michigan 14 | John Conyers Jr. | Democratic | 1964 | Incumbent re-elected. | √ John Conyers Jr. (Democratic) 92.4% Rick Secula (Libertarian) 4.4% Clyde Shabazz (Green) 3.2% |
| Michigan 15 | John Dingell | Democratic | 1955 | Incumbent re-elected. | √ John Dingell (Democratic) 70.7% John Lynch (Republican) 25.0% Aimee Smith (Green) 2.2% Greg Stempfle (Libertarian) 1.2% James Wagner (United States Taxpayers) 1.0% |
Minnesota
| District | Incumbent | Party | First elected |
Results | Candidates |
|---|---|---|---|---|---|
| Minnesota 1 | Tim Walz | Democratic | 2006 | Incumbent re-elected. | √ Tim Walz (Democratic–Farmer–Labor) 62.5% Brian Davis (Republican) 32.9% Gregory Mikkelson (Independence) 4.5% |
| Minnesota 2 | John Kline | Republican | 2002 | Incumbent re-elected. | √ John Kline (Republican) 57.3% Steve Sarvi (Democratic–Farmer–Labor) 42.6% |
| Minnesota 3 | Jim Ramstad | Republican | 1990 | Incumbent retired. New member elected. Republican hold. |
√ Erik Paulsen (Republican) 48.5% Ashwin Madia (Democratic–Farmer–Labor) 40.9% David Dillon (Independence) 10.6% |
| Minnesota 4 | Betty McCollum | Democratic | 2000 | Incumbent re-elected. | √ Betty McCollum (Democratic–Farmer–Labor) 68.4% Ed Matthews (Republican) 31.3% |
| Minnesota 5 | Keith Ellison | Democratic | 2006 | Incumbent re-elected. | √ Keith Ellison (Democratic–Farmer–Labor) 70.9% Barb Davis White (Republican) 22.0% Bill McGaughey (Independence) 6.9% |
| Minnesota 6 | Michele Bachmann | Republican | 2006 | Incumbent re-elected. | √ Michele Bachmann (Republican) 46.4% Elwyn Tinklenberg (Democratic–Farmer–Labor) 43.4% Bob Anderson (Independence) 10.0% |
| Minnesota 7 | Collin Peterson | Democratic | 1990 | Incumbent re-elected. | √ Collin Peterson (Democratic–Farmer–Labor) 72.2% Glenn Menze (Republican) 27.7% |
| Minnesota 8 | Jim Oberstar | Democratic | 1974 | Incumbent re-elected. | √ Jim Oberstar (Democratic–Farmer–Labor) 67.7% Michael Cummins (Republican) 32.2% |
Mississippi
| District | Incumbent | Party | First elected |
Results | Candidates |
|---|---|---|---|---|---|
| Mississippi 1 | Travis Childers | Democratic | May 13, 2008 (Special) |
Incumbent re-elected. | √ Travis Childers (Democratic) 54.5% Greg Davis (Republican) 43.9% Wally Pang (Independent) 1.1% John Wages Jr. (Green) 0.6% |
| Mississippi 2 | Bennie Thompson | Democratic | 1993 | Incumbent re-elected. | √ Bennie Thompson (Democratic) 69.1% Richard Cook (Republican) 30.9% |
| Mississippi 3 | Chip Pickering | Republican | 1996 | Incumbent retired. New member elected. Republican hold. |
√ Gregg Harper (Republican) 62.5% Joel Gill (Democratic) 37.5% |
| Mississippi 4 | Gene Taylor | Democratic | 1989 | Incumbent re-elected. | √ Gene Taylor (Democratic) 74.5% John McCay (Republican) 25.5% |
Missouri
| District | Incumbent | Party | First elected |
Results | Candidates |
|---|---|---|---|---|---|
| Missouri 1 | Lacy Clay | Democratic | 2000 | Incumbent re-elected. | √ Lacy Clay (Democratic) 86.9% Robb Cunningham (Libertarian) 13.1% |
| Missouri 2 | Todd Akin | Republican | 2000 | Incumbent re-elected. | √ Todd Akin (Republican) 62.3% Bill Haas (Democratic) 35.4% Thomas Knapp (Libertarian) 2.3% |
| Missouri 3 | Russ Carnahan | Democratic | 2004 | Incumbent re-elected. | √ Russ Carnahan (Democratic) 66.4% Chris Sander (Republican) 30.4% Kevin Babcock (Libertarian) 1.8% Cindy Redburn (Constitution) 1.4% |
| Missouri 4 | Ike Skelton | Democratic | 1976 | Incumbent re-elected. | √ Ike Skelton (Democratic) 65.9% Jeff Parnell (Republican) 34.1% |
| Missouri 5 | Emanuel Cleaver | Democratic | 2004 | Incumbent re-elected. | √ Emanuel Cleaver (Democratic) 64.4% Jacob Turk (Republican) 35.6% |
| Missouri 6 | Sam Graves | Republican | 2000 | Incumbent re-elected. | √ Sam Graves (Republican) 59.4% Kay Barnes (Democratic) 36.9% Dave Browning (Libertarian) 3.7% |
| Missouri 7 | Roy Blunt | Republican | 1996 | Incumbent re-elected. | √ Roy Blunt (Republican) 67.8% Richard Monroe (Democratic) 28.1% Kevin Craig (Libertarian) 2.2% Travis Maddox (Constitution) 1.9% |
| Missouri 8 | Jo Ann Emerson | Republican | 1996 | Incumbent re-elected. | √ Jo Ann Emerson (Republican) 71.4% Joe Allen (Democratic) 26.2% Branden McCullough (Libertarian) 1.6% Richard Smith (Constitution) 0.8% |
| Missouri 9 | Kenny Hulshof | Republican | 1996 | Incumbent retired to run for Governor. New member elected. Republican hold. |
√ Blaine Luetkemeyer (Republican) 50.0% Judy Baker (Democratic) 47.5% Tamara Millay (Libertarian) 2.5% |
Montana
| District | Incumbent | Party | First elected |
Results | Candidates |
|---|---|---|---|---|---|
| Montana at-large | Denny Rehberg | Republican | 2000 | Incumbent re-elected. | √ Denny Rehberg (Republican) 64.2% John Driscoll (Democratic) 32.4% Mike Fellows (Libertarian) 3.4% |
Nebraska
| District | Incumbent | Party | First elected |
Results | Candidates |
|---|---|---|---|---|---|
| Nebraska 1 | Jeff Fortenberry | Republican | 2004 | Incumbent re-elected. | √ Jeff Fortenberry (Republican) 70.4% Max Yashirin (Democratic) 29.6% |
| Nebraska 2 | Lee Terry | Republican | 1998 | Incumbent re-elected. | √ Lee Terry (Republican) 51.9% Jim Esch (Democratic) 48.1% |
| Nebraska 3 | Adrian Smith | Republican | 2006 | Incumbent re-elected. | √ Adrian Smith (Republican) 76.9% Jay Stoddard (Democratic) 23.1% |
Nevada
| District | Incumbent | Party | First elected |
Results | Candidates |
|---|---|---|---|---|---|
| Nevada 1 | Shelley Berkley | Democratic | 1998 | Incumbent re-elected. | √ Shelley Berkley (Democratic) 67.6% Kenneth Wegner (Republican) 28.4% Caren Alexander (Independent American) 2.0% Raymond James Duensing Jr. (Libertarian) 2.0% |
| Nevada 2 | Dean Heller | Republican | 2006 | Incumbent re-elected. | √ Dean Heller (Republican) 51.8% Jill Derby (Democratic) 41.4% John Everhart (Independent American) 3.4% Sean Patrick Morse (Libertarian) 1.7% Craig Bergland (Green) 1.6% |
| Nevada 3 | Jon Porter | Republican | 2002 | Incumbent lost re-election. New member elected. Democratic gain. |
√ Dina Titus (Democratic) 47.4% Jon Porter (Republican) 42.3% Jeffrey Reeves (Independent) 4.3% Joseph Silvestri (Libertarian) 2.9% Floyd Fitzgibbons (Independent American) 2.0% Bob Gianquinta (Green) 1.1% |
New Hampshire
| District | Incumbent | Party | First elected |
Results | Candidates |
|---|---|---|---|---|---|
| New Hampshire 1 | Carol Shea-Porter | Democratic | 2006 | Incumbent re-elected. | √ Carol Shea-Porter (Democratic) 51.7% Jeb Bradley (Republican) 45.8% Robert Kingsbury (Libertarian) 2.4% |
| New Hampshire 2 | Paul Hodes | Democratic | 2006 | Incumbent re-elected. | √ Paul Hodes (Democratic) 56.4% Jennifer Horn (Republican) 41.4% Chester Lapointe II (Libertarian) 2.1% |
New Jersey
| District | Incumbent | Party | First elected |
Results | Candidates |
|---|---|---|---|---|---|
| New Jersey 1 | Rob Andrews | Democratic | 1990 | Incumbent re-elected. | √ Rob Andrews (Democratic) 72.4% Dale Glading (Republican) 26.0% Matthew Thieke (Green) 0.7% Margaret Chapman (Independent) 0.4% Everitt Williams III (Independent) 0.3% Alvin Lindsay Jr. (Independent) 0.2% |
| New Jersey 2 | Frank LoBiondo | Republican | 1994 | Incumbent re-elected. | √ Frank LoBiondo (Republican) 59.1% David Kurkowski (Democratic) 39.1% Jason Grover (Green) 0.6% Peter Boyce (Constitution) 0.5% Gary Stein (Independent) 0.5% Constantino Rozzo (Socialist) 0.2% |
| New Jersey 3 | Jim Saxton | Republican | 1984 | Incumbent retired. New member elected. Democratic gain. |
√ John Adler (Democratic) 52.1% Chris Myers (Republican) 47.9% |
| New Jersey 4 | Chris Smith | Republican | 1980 | Incumbent re-elected. | √ Chris Smith (Republican) 66.2% Joshua Zeitz (Democratic) 32.6% Steven Welzer (Green) 1.2% |
| New Jersey 5 | Scott Garrett | Republican | 2000 | Incumbent re-elected. | √ Scott Garrett (Republican) 55.9% Dennis Shulman (Democratic) 42.4% Ed Fanning (Green) 1.7% |
| New Jersey 6 | Frank Pallone | Democratic | 1988 | Incumbent re-elected. | √ Frank Pallone (Democratic) 66.9% Robert McLeod (Republican) 31.6% Herbert Tarbous (Independent) 1.4% |
| New Jersey 7 | Mike Ferguson | Republican | 2000 | Incumbent retired. New member elected. Republican hold. |
√ Leonard Lance (Republican) 50.2% Linda Stender (Democratic) 42.2% Michael Hsing (Independent) 5.6% Dean Greco (Independent) 1.1% Thomas Abrams (Independent) 0.9% |
| New Jersey 8 | Bill Pascrell | Democratic | 1996 | Incumbent re-elected. | √ Bill Pascrell (Democratic) 71.1% Rollie Straten (Republican) 28.2% Derek DeMarco (Libertarian) 0.7% |
| New Jersey 9 | Steve Rothman | Democratic | 1996 | Incumbent re-elected. | √ Steve Rothman (Democratic) 69.5% Vince Micco (Republican) 31.0% Michael Perrone Jr. (Independent) 0.5% |
| New Jersey 10 | Don Payne | Democratic | 1988 | Incumbent re-elected. | √ Don Payne (Democratic) 98.9% Michael Taber (Socialist Workers) 1.1% |
| New Jersey 11 | Rodney Frelinghuysen | Republican | 1994 | Incumbent re-elected. | √ Rodney Frelinghuysen (Republican) 61.8% Tom Wyka (Democratic) 37.0% Chandler Tedholm (Independent) 1.2% |
| New Jersey 12 | Rush Holt | Democratic | 1998 | Incumbent re-elected. | √ Rush Holt (Democratic) 63.1% Alan Bateman (Republican) 35.3% David Corsi (Independent) 1.6% |
| New Jersey 13 | Albio Sires | Democratic | 2006 | Incumbent re-elected. | √ Albio Sires (Democratic) 75.4% Joseph Turula (Republican) 21.7% Julio Fernandez (Independent) 2.3% Louis Vernotico (Independent) 0.6% |
New Mexico
| District | Incumbent | Party | First elected |
Results | Candidates |
|---|---|---|---|---|---|
| New Mexico 1 | Heather Wilson | Republican | 1998 | Incumbent retired to run for U.S. Senator. New member elected. Democratic gain. |
√ Martin Heinrich (Democratic) 55.7% Darren White (Republican) 44.3% |
| New Mexico 2 | Steve Pearce | Republican | 2002 | Incumbent retired to run for U.S. Senator. New member elected. Democratic gain. |
√ Harry Teague (Democratic) 56.0% Edward Tinsley (Republican) 44.0% |
| New Mexico 3 | Tom Udall | Democratic | 1998 | Incumbent retired to run for U.S. Senator | √ Ben Lujan (Democratic) 56.7% Daniel East (Republican) 30.5% Carol Miller (Independent) 12.8% |
New York
| District | Incumbent | Party | First elected |
Results | Candidates |
|---|---|---|---|---|---|
| New York 1 | Tim Bishop | Democratic | 2002 | Incumbent re-elected. | √ Tim Bishop (Democratic) 58.4% Lee Zeldin (Republican) 41.6% |
| New York 2 | Steve Israel | Democratic | 2000 | Incumbent re-elected. | √ Steve Israel (Democratic) 66.9% Frank Stalzer (Republican) 33.1% |
| New York 3 | Peter King | Republican | 1992 | Incumbent re-elected. | √ Peter King (Republican) 63.9% Graham Long (Democratic) 36.1% |
| New York 4 | Carolyn McCarthy | Democratic | 1996 | Incumbent re-elected. | √ Carolyn McCarthy (Democratic) 64.0% Jack Martins (Republican) 36.0% |
| New York 5 | Gary Ackerman | Democratic | 1983 | Incumbent re-elected. | √ Gary Ackerman (Democratic) 70.7% Elizabeth Berney (Republican) 27.4% Jun Policarpo (Conservative) 1.9% |
| New York 6 | Gregory Meeks | Democratic | 1998 | Incumbent re-elected. | √ Gregory Meeks (Democratic) Unopposed |
| New York 7 | Joseph Crowley | Democratic | 1998 | Incumbent re-elected. | √ Joseph Crowley (Democratic) 84.7% William Britt (Republican) 15.3% |
| New York 8 | Jerrold Nadler | Democratic | 1992 | Incumbent re-elected. | √ Jerrold Nadler (Democratic) 80.5% Grace Lin (Republican) 19.5% |
| New York 9 | Anthony Weiner | Democratic | 1998 | Incumbent re-elected. | √ Anthony Weiner (Democratic) 93.3% Alfred Donohue (Conservative) 6.7% |
| New York 10 | Ed Towns | Democratic | 1982 | Incumbent re-elected. | √ Ed Towns (Democratic) 94.2% Salvatore Grupico (Republican) 5.8% |
| New York 11 | Yvette Clarke | Democratic | 2006 | Incumbent re-elected. | √ Yvette Clarke (Democratic) 92.8% Hugh Carr (Republican) 6.4% Cartrell Gore (Conservative) 0.8% |
| New York 12 | Nydia Velazquez | Democratic | 1992 | Incumbent re-elected. | √ Nydia Velazquez (Democratic) 90.0% Allan Romaguera (Republican) 10.0% |
| New York 13 | Vito Fossella | Republican | 1997 | Incumbent retired. New member elected. Democratic gain. |
√ Michael McMahon (Democratic) 60.9% Robert Straniere (Republican) 33.3% Timothy Cochrane (Conservative) 3.1% Carmine Morano (Independence) 2.7% |
| New York 14 | Carolyn Maloney | Democratic | 1992 | Incumbent re-elected. | √ Carolyn Maloney (Democratic) 79.8% Robert Heim (Republican) 19.0% Isaiah Matos (Libertarian) 1.2% |
| New York 15 | Charles Rangel | Democratic | 1970 | Incumbent re-elected. | √ Charles Rangel (Democratic) 89.2% Edward Daniels (Republican) 7.9% Craig Schely (Independent) 1.9% Martin Koppel (Socialist Workers) 1.1% |
| New York 16 | Jose Serrano | Democratic | 1990 | Incumbent re-elected. | √ Jose Serrano (Democratic) 96.6% Ali Mohamed (Republican) 3.4% |
| New York 17 | Eliot Engel | Democratic | 1988 | Incumbent re-elected. | √ Eliot Engel (Democratic) 79.9% Robert Goodman (Republican) 20.1% |
| New York 18 | Nita Lowey | Democratic | 1988 | Incumbent re-elected. | √ Nita Lowey (Democratic) 68.5% Jim Russell (Republican) 31.5% |
| New York 19 | John Hall | Democratic | 2006 | Incumbent re-elected. | √ John Hall (Democratic) 58.7% Kieran Michael Lalor (Republican) 41.3% |
| New York 20 | Kirsten Gillibrand | Democratic | 2006 | Incumbent re-elected. | √ Kirsten Gillibrand (Democratic) 62.1% Sandy Treadwell (Republican) 37.9% |
| New York 21 | Mike McNulty | Democratic | 1988 | Incumbent retired. New member elected. Democratic hold. |
√ Paul Tonko (Democratic) 62.1% James Buhrmaster (Republican) 35.0% Phillip Steck (Independence) 2.9% |
| New York 22 | Maurice Hinchey | Democratic | 1992 | Incumbent re-elected. | √ Maurice Hinchey (Democratic) 66.3% George Phillips (Republican) 33.7% |
| New York 23 | John McHugh | Republican | 1992 | Incumbent re-elected. | √ John McHugh (Republican) 65.3% Michael Oot (Democratic) 34.7% |
| New York 24 | Mike Arcuri | Democratic | 2006 | Incumbent re-elected. | √ Mike Arcuri (Democratic) 52.0% Richard L. Hanna (Republican) 48.0% |
| New York 25 | Jim Walsh | Republican | 1988 | Incumbent retired. New member elected. Democratic gain. |
√ Dan Maffei (Democratic) 54.8% Dale Sweetland (Republican) 41.9% Howie Hawkins (Green) 3.3% |
| New York 26 | Tom Reynolds | Republican | 1998 | Incumbent retired. New member elected. Republican hold. |
√ Christoper Lee (Republican) 55.0% Alice Kryzan (Democratic) 40.5% Jonathan Powers (Working Families) 4.5% |
| New York 27 | Brian Higgins | Democratic | 2004 | Incumbent re-elected. | √ Brian Higgins (Democratic) 74.4% Daniel Humiston (Republican) 22.6% Harold Schroeder (Conservative) 3.0% |
| New York 28 | Louise Slaughter | Democratic | 1986 | Incumbent re-elected. | √ Louise Slaughter (Democratic) 78.0% David Crimmen (Republican) 22.0% |
| New York 29 | Randy Kuhl | Republican | 2004 | Incumbent lost re-election. New member elected. Democratic gain. |
√ Eric Massa (Democratic) 51.0% Randy Kuhl (Republican) 49.0% |
North Carolina
| District | Incumbent | Party | First elected |
Results | Candidates |
|---|---|---|---|---|---|
| North Carolina 1 | G. K. Butterfield | Democratic | 2004 | Incumbent re-elected. | √ G.K. Butterfield (Democratic) 70.3% Dean Stephens (Republican) 29.7% |
| North Carolina 2 | Bob Etheridge | Democratic | 1996 | Incumbent re-elected. | √ Bob Etheridge (Democratic) 66.9% Dan Mansell (Republican) 31.3% Will Adkins (Libertarian) 1.8% |
| North Carolina 3 | Walter Jones Jr. | Republican | 1994 | Incumbent re-elected. | √ Walter Jones (Republican) 65.9% Craig Weber (Democratic) 34.1% |
| North Carolina 4 | David Price | Democratic | 1996 | Incumbent re-elected. | √ David Price (Democratic) 63.3% B.J. Lawson (Republican) 36.7% |
| North Carolina 5 | Virginia Foxx | Republican | 2004 | Incumbent re-elected. | √ Virginia Foxx (Republican) 58.4% Roy Carter (Democratic) 41.6% |
| North Carolina 6 | Howard Coble | Republican | 1984 | Incumbent re-elected. | √ Howard Coble (Republican) 67.0% Teresa Sue Bratton (Democratic) 33.0% |
| North Carolina 7 | Mike McIntyre | Democratic | 1996 | Incumbent re-elected. | √ Mike McIntyre (Democratic) 68.8% Will Breazeale (Republican) 31.2% |
| North Carolina 8 | Robin Hayes | Republican | 1998 | Incumbent lost re-election. New member elected. Democratic gain. |
√ Larry Kissell (Democratic) 55.4% Robin Hayes (Republican) 44.6% |
| North Carolina 9 | Sue Myrick | Republican | 1994 | Incumbent re-elected. | √ Sue Myrick (Republican) 62.4% Harry Taylor (Democratic) 35.9% Andy Grum (Libertarian) 1.7% |
| North Carolina 10 | Patrick McHenry | Republican | 2004 | Incumbent re-elected. | √ Patrick McHenry (Republican) 57.6% Daniel Johnson (Democratic) 42.4% |
| North Carolina 11 | Heath Shuler | Democratic | 2006 | Incumbent re-elected. | √ Heath Shuler (Democratic) 62.0% Carl Mumpower (Republican) 35.8% Keith Smith (Libertarian) 2.2% |
| North Carolina 12 | Mel Watt | Democratic | 1992 | Incumbent re-elected. | √ Mel Watt (Democratic) 71.6% Ty Cobb (Republican) 28.4% |
| North Carolina 13 | Brad Miller | Democratic | 2002 | Incumbent re-elected. | √ Brad Miller (Democratic) 65.9% Hugh Webster (Republican) 34.1% |
North Dakota
| District | Incumbent | Party | First elected |
Results | Candidates |
|---|---|---|---|---|---|
| North Dakota at-large | Earl Pomeroy | Democratic-NPL | 1992 | Incumbent re-elected. | √ Earl Pomeroy (Democratic–Non-Partisan League) 62.0% Duane Sand (Republican) 38.0% |
Ohio
| District | Incumbent | Party | First elected |
Results | Candidates |
|---|---|---|---|---|---|
| Ohio 1 | Steve Chabot | Republican | 1994 | Incumbent lost re-election. New member elected. Democratic gain. |
√ Steven Driehaus (Democratic) 52.4% Steve Chabot (Republican) 47.5% |
| Ohio 2 | Jean Schmidt | Republican | 2005 | Incumbent re-elected. | √ Jean Schmidt (Republican) 44.8% Victoria Wulsin (Democratic) 37.5% David Krikorian (Independent) 17.7% |
| Ohio 3 | Mike Turner | Republican | 2002 | Incumbent re-elected. | √ Mike Turner (Republican) 63.3% Jane Mitakides (Democratic) 36.7% |
| Ohio 4 | Jim Jordan | Republican | 2006 | Incumbent re-elected. | √ Jim Jordan (Republican) 65.2% Mike Carroll (Democratic) 34.8% |
| Ohio 5 | Bob Latta | Republican | 2007 | Incumbent re-elected. | √ Bob Latta (Republican) 64.1% George Mays (Democratic) 35.9% |
| Ohio 6 | Charlie Wilson | Democratic | 2006 | Incumbent re-elected. | √ Charlie Wilson (Democratic) 62.3% Dick Stobbs (Republican) 32.8% Dennis Spisak (Green) 4.9% |
| Ohio 7 | Dave Hobson | Republican | 1990 | Incumbent retired. New member elected. Republican hold. |
√ Steve Austria (Republican) 58.2% Sharen Neuhardt (Democratic) 41.8% |
| Ohio 8 | John Boehner | Republican | 1990 | Incumbent re-elected. | √ John Boehner (Republican) 67.9% Nick von Stein (Democratic) 32.1% |
| Ohio 9 | Marcy Kaptur | Democratic | 1982 | Incumbent re-elected. | √ Marcy Kaptur (Democratic) 74.4% Bradley Leavitt (Republican) 25.6% |
| Ohio 10 | Dennis Kucinich | Democratic | 1996 | Incumbent re-elected. | √ Dennis Kucinich (Democratic) 57.0% Jim Trakas (Republican) 39.1% Paul Conroy (Libertarian) 3.9% |
| Ohio 11 | Vacant | Stephanie Tubbs Jones (Democratic) died August 20, 2008. New member elected. Democratic hold. |
√ Marcia Fudge (Democratic) 85.2% Thomas Pekarek (Republican) 14.7% Craig Willis (Write-In) 0.1% | ||
| Ohio 12 | Pat Tiberi | Republican | 2000 | Incumbent re-elected. | √ Pat Tiberi (Republican) 54.8% David Robinson (Democratic) 42.2% Steven Linnabary (Libertarian) 3.0% |
| Ohio 13 | Betty Sutton | Democratic | 2006 | Incumbent re-elected. | √ Betty Sutton (Democratic) 64.5% David Potter (Republican) 35.4% |
| Ohio 14 | Steve LaTourette | Republican | 1994 | Incumbent re-elected. | √ Steve LaTourette (Republican) 58.3% William O'Neill (Democratic) 38.7% David Macko (Libertarian) 2.9% |
| Ohio 15 | Deborah Pryce | Republican | 1992 | Incumbent retired. New member elected. Democratic gain. |
√ Mary Jo Kilroy (Democratic) 45.9% Steve Stivers (Republican) 45.2% Mark Michael Noble (Libertarian) 4.6% Don Elijah Eckhart (Independent) 4.3% |
| Ohio 16 | Ralph Regula | Republican | 1972 | Incumbent retired. New member elected. Democratic gain. |
√ John Boccieri (Democratic) 55.4% Kirk Schuring (Republican) 44.6% |
| Ohio 17 | Tim Ryan | Democratic | 2002 | Incumbent re-elected. | √ Tim Ryan (Democratic) 78.2% Duane Grassell (Republican) 21.8% |
| Ohio 18 | Zack Space | Democratic | 2006 | Incumbent re-elected. | √ Zack Space (Democratic) 59.9% Fred Dailey (Republican) 40.1% |
Oklahoma
| District | Incumbent | Party | First elected |
Results | Candidates |
|---|---|---|---|---|---|
| Oklahoma 1 | John Sullivan | Republican | 2002 | Incumbent re-elected. | √ John Sullivan (Republican) 66.2% Georgianna Oliver (Democratic) 33.8% |
| Oklahoma 2 | Dan Boren | Democratic | 2004 | Incumbent re-elected. | √ Dan Boren (Democratic) 70.5% Raymond Wickson (Republican) 29.5% |
| Oklahoma 3 | Frank Lucas | Republican | 1994 | Incumbent re-elected. | √ Frank Lucas (Republican) 69.7% Frankie Robbins (Democratic) 23.6% Forrest Michael (Independent) 6.7% |
| Oklahoma 4 | Tom Cole | Republican | 2002 | Incumbent re-elected. | √ Tom Cole (Republican) 66.0% Blake Cummings (Democratic) 29.2% David E. Joyce (Independent) 4.8% |
| Oklahoma 5 | Mary Fallin | Republican | 2006 | Incumbent re-elected. | √ Mary Fallin (Republican) 65.9% Stephen L. Perry (Democratic) 34.1% |
Oregon
| District | Incumbent | Party | First elected |
Results | Candidates |
|---|---|---|---|---|---|
| Oregon 1 | David Wu | Democratic | 1998 | Incumbent re-elected. | √ David Wu (Democratic) 71.5% Joel Haugen (Independent) 17.5% Scott Semrau (Constitution) 4.3% H. Joe Tabor (Libertarian) 3.3% Chris Henry (Pacific Green) 2.1% |
| Oregon 2 | Greg Walden | Republican | 1998 | Incumbent re-elected. | √ Greg Walden (Republican) 69.5% Noah Lemas (Democratic) 25.8% Tristin Mock (Pacific Green) 2.8% Richard Hake (Constitution) 1.7% |
| Oregon 3 | Earl Blumenauer | Democratic | 1996 | Incumbent re-elected. | √ Earl Blumenauer (Democratic) 74.5% Delia Lopez (Republican) 20.8% Michael Meo (Pacific Green) 4.4% |
| Oregon 4 | Peter DeFazio | Democratic | 1986 | Incumbent re-elected. | √ Peter DeFazio (Democratic) 82.3% Jaynee Germond (Constitution) 12.9% Mike Beilstein (Pacific Green) 3.9% |
| Oregon 5 | Darlene Hooley | Democratic | 1996 | Incumbent retired. New member elected. Democratic hold. |
√ Kurt Schrader (Democratic) 54.3% Mike Erickson (Republican) 38.3% Sean Bates (Independent) 2.0% Douglas Patterson (Constitution) 2.0% Alex Polikoff (Pacific Green) 1.6% Steve Milligan (Libertarian) 1.4% |
Pennsylvania
| District | Incumbent | Party | First elected |
Results | Candidates |
|---|---|---|---|---|---|
| Pennsylvania 1 | Bob Brady | Democratic | 1998 | Incumbent re-elected. | √ Bob Brady (Democratic) 90.8% Mike Muhammad (Republican) 9.2% |
| Pennsylvania 2 | Chaka Fattah | Democratic | 1994 | Incumbent re-elected. | √ Chaka Fattah (Democratic) 88.9% Adam Lang (Republican) 11.1% |
| Pennsylvania 3 | Phil English | Republican | 1994 | Incumbent lost re-election. New member elected. Democratic gain. |
√ Kathy Dahlkemper (Democratic) 51.2% Phil English (Republican) 48.8% |
| Pennsylvania 4 | Jason Altmire | Democratic | 2006 | Incumbent re-elected. | √ Jason Altmire (Democratic) 55.9% Melissa Hart (Republican) 44.1% |
| Pennsylvania 5 | John Peterson | Republican | 1996 | Incumbent retired. New member elected. Republican hold. |
√ G.T. Thompson (Republican) 56.7% Mark McCracken (Democratic) 41.0% James Fryman (Libertarian) 2.2% |
| Pennsylvania 6 | Jim Gerlach | Republican | 2002 | Incumbent re-elected. | √ Jim Gerlach (Republican) 52.1% Bob Roggio (Democratic) 47.9% |
| Pennsylvania 7 | Joe Sestak | Democratic | 2006 | Incumbent re-elected. | √ Joe Sestak (Democratic) 59.6% Craig Williams (Republican) 40.4% |
| Pennsylvania 8 | Patrick Murphy | Democratic | 2006 | Incumbent re-elected. | √ Patrick Murphy (Democratic) 56.8% Tom Manion (Republican) 41.6% Tom Lingenfelter (Independent) 1.6% |
| Pennsylvania 9 | Bill Shuster | Republican | 2001 | Incumbent re-elected. | √ Bill Shuster (Republican) 63.9% Tony Barr (Democratic) 36.1% |
| Pennsylvania 10 | Chris Carney | Democratic | 2006 | Incumbent re-elected. | √ Chris Carney (Democratic) 56.3% Chris Hackett (Republican) 43.7% |
| Pennsylvania 11 | Paul Kanjorski | Democratic | 1984 | Incumbent re-elected. | √ Paul Kanjorski (Democratic) 51.6% Lou Barletta (Republican) 48.4% |
| Pennsylvania 12 | John Murtha | Democratic | 1974 | Incumbent re-elected. | √ John Murtha (Democratic) 57.9% William Russell (Republican) 42.1% |
| Pennsylvania 13 | Allyson Schwartz | Democratic | 2004 | Incumbent re-elected. | √ Allyson Schwartz (Democratic) 62.8% Marina Kats (Republican) 34.5% John McDermott (Constitution) 2.7% |
| Pennsylvania 14 | Mike Doyle | Democratic | 1994 | Incumbent re-elected. | √ Mike Doyle (Democratic) 91.3% Titus North (Green) 8.7% |
| Pennsylvania 15 | Charlie Dent | Republican | 2004 | Incumbent re-elected. | √ Charlie Dent (Republican) 58.6% Sam Bennett (Democratic) 41.4% |
| Pennsylvania 16 | Joe Pitts | Republican | 1996 | Incumbent re-elected. | √ Joe Pitts (Republican) 55.8% Bruce Slater (Democratic) 39.4% John Murphy (Independent) 3.9% Daniel Frank (Constitution) 0.9% |
| Pennsylvania 17 | Tim Holden | Democratic | 1992 | Incumbent re-elected. | √ Tim Holden (Democratic) 63.7% Toni Gilhooley (Republican) 36.3% |
| Pennsylvania 18 | Tim Murphy | Republican | 2002 | Incumbent re-elected. | √ Tim Murphy (Republican) 64.1% Steve O'Donnell (Democratic) 35.9% |
| Pennsylvania 19 | Todd Platts | Republican | 2000 | Incumbent re-elected. | √ Todd Platts (Republican) 66.6% Phil Avillo (Democratic) 33.4% |
Rhode Island
| District | Incumbent | Party | First elected |
Results | Candidates |
|---|---|---|---|---|---|
| Rhode Island 1 | Patrick Kennedy | Democratic | 1994 | Incumbent re-elected. | √ Patrick Kennedy (Democratic) 68.6% Jonathan Scott (Republican) 24.3% Kenneth Capalbo (Independent) 7.1% |
| Rhode Island 2 | Jim Langevin | Democratic | 2000 | Incumbent re-elected. | √ Jim Langevin (Democratic) 70.1% Mark Zaccaria (Republican) 29.9% |
South Carolina
| District | Incumbent | Party | First elected |
Results | Candidates |
|---|---|---|---|---|---|
| South Carolina 1 | Henry E. Brown Jr. | Republican | 2000 | Incumbent re-elected. | √ Henry E. Brown Jr. (Republican) 51.9% Linda Ketner (Democratic) 47.9% |
| South Carolina 2 | Joe Wilson | Republican | 2001 | Incumbent re-elected. | √ Joe Wilson (Republican) 53.7% Robert Miller (Democratic) 46.2% |
| South Carolina 3 | J. Gresham Barrett | Republican | 2002 | Incumbent re-elected. | √ J. Gresham Barrett (Republican) 64.7% Jane Ballard Dyer (Democratic) 35.2% |
| South Carolina 4 | Bob Inglis | Republican | 2004 | Incumbent re-elected. | √ Bob Inglis (Republican) 60.1% Paul Corden (Democratic) 36.9% C. Faye Walters (Green) 2.4% |
| South Carolina 5 | John Spratt | Democratic | 1982 | Incumbent re-elected. | √ John Spratt (Democratic) 61.6% Albert F. Spencer (Republican) 37.0% Frank Waggoner (Constitution) 1.3% |
| South Carolina 6 | Jim Clyburn | Democratic | 1992 | Incumbent re-elected. | √ Jim Clyburn (Democratic) 67.5% Nancy Harrelson (Republican) 32.5% |
South Dakota
| District | Incumbent | Party | First elected |
Results | Candidates |
|---|---|---|---|---|---|
| South Dakota at-large | Stephanie Herseth Sandlin | Democratic | 2004 | Incumbent re-elected. | √ Stephanie Herseth Sandlin (Democratic) 67.6% Chris Lien (Republican) 32.4% |
Tennessee
| District | Incumbent | Party | First elected |
Results | Candidates |
|---|---|---|---|---|---|
| Tennessee 1 | David Davis | Republican | 2006 | Incumbent lost renomination. New member elected. Republican hold. |
√ Phil Roe (Republican) 71.8% Rob Russell (Democratic) 24.5% Joel Goodman (Independent) 1.7% James Reeves (Independent) 1.1% Thomas Owens (Independent) 0.8% |
| Tennessee 2 | Jimmy Duncan | Republican | 1998 | Incumbent re-elected. | √ Jimmy Duncan (Republican) 78.1% Bob Scott (Democratic) 21.9% |
| Tennessee 3 | Zach Wamp | Republican | 1994 | Incumbent re-elected. | √ Zach Wamp (Republican) 69.4% Doug Vandagriff (Democratic) 27.4% Jean Howard-Hill (Independent) 1.8% Ed Choate (Independent) 1.4% |
| Tennessee 4 | Lincoln Davis | Democratic | 2002 | Incumbent re-elected. | √ Lincoln Davis (Democratic) 58.8% Monty Lankford (Republican) 37.8% James Anthony Gray (Independent) 1.9% Kevin Ragsdale (Independent) 1.5% |
| Tennessee 5 | Jim Cooper | Democratic | 2002 | Incumbent re-elected. | √ Jim Cooper (Democratic) 65.9% Gerard Donovan (Republican) 31.0% Jon Jackson (Independent) 2.0% John Miglietta (Green) 1.2% |
| Tennessee 6 | Bart Gordon | Democratic | 1984 | Incumbent re-elected. | √ Bart Gordon (Democratic) 74.4% Chris Baker (Independent) 25.6% |
| Tennessee 7 | Marsha Blackburn | Republican | 2002 | Incumbent re-elected. | √ Marsha Blackburn (Republican) 68.6% Randy Morris (Democratic) 31.4% |
| Tennessee 8 | John Tanner | Democratic | 1988 | Incumbent re-elected. | √ John Tanner (Democratic) Unopposed |
| Tennessee 9 | Steve Cohen | Democratic | 2006 | Incumbent re-elected. | √ Steve Cohen (Democratic) 87.9% Jake Ford (Independent) 4.9% Dewey Clark (Independent) 4.4% Mary White (Independent) 2.8% |
Texas
| District | Incumbent | Party | First elected |
Results | Candidates |
|---|---|---|---|---|---|
| Texas 1 | Louie Gohmert | Republican | 2004 | Incumbent re-elected. | √ Louie Gohmert (Republican) 87.6% Roger Owen (Independent) 12.4% |
| Texas 2 | Ted Poe | Republican | 2004 | Incumbent re-elected. | √ Ted Poe (Republican) 88.9% Craig Wolfe (Libertarian) 11.1% |
| Texas 3 | Sam Johnson | Republican | 1991 | Incumbent re-elected. | √ Sam Johnson (Republican) 59.7% Tom Daley (Democratic) 38.0% Christopher Claytor (Libertarian) 2.2% |
| Texas 4 | Ralph Hall | Republican | 1980 | Incumbent re-elected. | √ Ralph Hall (Republican) 68.8% Glenn Melancon (Democratic) 29.3% Fred Annett (Libertarian) 1.9% |
| Texas 5 | Jeb Hensarling | Republican | 2002 | Incumbent re-elected. | √ Jeb Hensarling (Republican) 83.6% Ken Ashby (Libertarian) 16.4% |
| Texas 6 | Joe Barton | Republican | 1984 | Incumbent re-elected. | √ Joe Barton (Republican) 62.0% Ludwig Otto (Democratic) 35.6% Max Koch (Libertarian) 2.4% |
| Texas 7 | John Culberson | Republican | 2000 | Incumbent re-elected. | √ John Culberson (Republican) 55.9% Michael Skelly (Democratic) 42.4% Drew Parks (Libertarian) 1.7% |
| Texas 8 | Kevin Brady | Republican | 1996 | Incumbent re-elected. | √ Kevin Brady (Republican) 72.6% Kent Hargett (Democratic) 24.8% Brian Stevens (Libertarian) 2.7% |
| Texas 9 | Al Green | Democratic | 2004 | Incumbent re-elected. | √ Al Green (Democratic) 93.6% Brad Walters (Libertarian) 6.4% |
| Texas 10 | Michael McCaul | Republican | 2004 | Incumbent re-elected. | √ Michael McCaul (Republican) 53.9% Larry Joe Doherty (Democratic) 43.1% Matt Finkel (Libertarian) 3.0% |
| Texas 11 | Mike Conaway | Republican | 2004 | Incumbent re-elected. | √ Mike Conaway (Republican) 88.3% John Strohm (Libertarian) 11.7% |
| Texas 12 | Kay Granger | Republican | 1996 | Incumbent re-elected. | √ Kay Granger (Republican) 67.6% Tracey Smith (Democratic) 30.6% Shiloh Sidney Shambaugh (Libertarian) 1.8% |
| Texas 13 | Mac Thornberry | Republican | 1994 | Incumbent re-elected. | √ Mac Thornberry (Republican) 77.6% Roger Waun (Democratic) 22.4% |
| Texas 14 | Ron Paul | Republican | 1996 | Incumbent re-elected. | √ Ron Paul (Republican) Unopposed |
| Texas 15 | Ruben Hinojosa | Democratic | 1996 | Incumbent re-elected. | √ Ruben Hinojosa (Democratic) 65.7% Eddie Zamora (Republican) 31.9% Gricha Raether (Libertarian) 2.3% |
| Texas 16 | Silvestre Reyes | Democratic | 1996 | Incumbent re-elected. | √ Silvestre Reyes (Democratic) 82.1% Mette Baker (Libertarian) 10.3% Ben Mendoza (Independent) 7.6% |
| Texas 17 | Chet Edwards | Democratic | 1990 | Incumbent re-elected. | √ Chet Edwards (Democratic) 53.0% Rob Curnock (Republican) 45.5% Gardner Osborne (Libertarian) 1.5% |
| Texas 18 | Sheila Jackson Lee | Democratic | 1994 | Incumbent re-elected. | √ Sheila Jackson Lee (Democratic) 77.3% John Faulk (Republican) 20.3% Mike Taylor (Libertarian) 2.3% |
| Texas 19 | Randy Neugebauer | Republican | 2002 | Incumbent re-elected. | √ Randy Neugebauer (Republican) 72.4% Dwight Fullingim (Democratic) 24.9% Chip Peterson (Libertarian) 2.6% |
| Texas 20 | Charlie Gonzalez | Democratic | 1998 | Incumbent re-elected. | √ Charlie Gonzalez (Democratic) 71.9% Robert Litoff (Republican) 25.2% Michael Idrogo (Libertarian) 2.9% |
| Texas 21 | Lamar Smith | Republican | 1986 | Incumbent re-elected. | √ Lamar Smith (Republican) 80.0% James Arthur Strohm (Libertarian) 20.0% |
| Texas 22 | Nick Lampson | Democratic | 2006 | Incumbent lost re-election. New member elected. Republican gain. |
√ Pete Olson (Republican) 52.4% Nick Lampson (Democratic) 45.4% John Wieder (Libertarian) 2.2% |
| Texas 23 | Ciro Rodriguez | Democratic | 2006 | Incumbent re-elected. | √ Ciro Rodriguez (Democratic) 55.8% Lyle Larson (Republican) 41.9% Lani Connolly (Libertarian) 2.3% |
| Texas 24 | Kenny Marchant | Republican | 2004 | Incumbent re-elected. | √ Kenny Marchant (Republican) 56.0% Tom Love (Democratic) 41.1% David Casey (Libertarian) 2.9% |
| Texas 25 | Lloyd Doggett | Democratic | 1994 | Incumbent re-elected. | √ Lloyd Doggett (Democratic) 65.8% George Morovich (Republican) 30.4% Jim Stutsman (Libertarian) 3.7% |
| Texas 26 | Michael Burgess | Republican | 2002 | Incumbent re-elected. | √ Michael Burgess (Republican) 60.2% Ken Leach (Democratic) 36.4% Stephanie Weiss (Libertarian) 3.4% |
| Texas 27 | Solomon Ortiz | Democratic | 1982 | Incumbent re-elected. | √ Solomon Ortiz (Democratic) 57.9% Willie Vaden (Republican) 38.4% Robert Powell (Libertarian) 3.7% |
| Texas 28 | Henry Cuellar | Democratic | 2004 | Incumbent re-elected. | √ Henry Cuellar (Democratic) 68.7% Jim Fish (Republican) 29.2% Ross Lynn Leone (Libertarian) 2.1% |
| Texas 29 | Gene Green | Democratic | 1992 | Incumbent re-elected. | √ Gene Green (Democratic) 74.6% Eric Story (Republican) 23.9% Joel Grace (Libertarian) 1.5% |
| Texas 30 | Eddie Bernice Johnson | Democratic | 1992 | Incumbent re-elected. | √ Eddie Bernice Johnson (Democratic) 82.5% Fred Wood (Republican) 15.9% Jarrett Woods (Libertarian) 1.6% |
| Texas 31 | John Carter | Republican | 2002 | Incumbent re-elected. | √ John Carter (Republican) 60.3% Brian Ruiz (Democratic) 36.6% Barry Cooper (Libertarian) 3.1% |
| Texas 32 | Pete Sessions | Republican | 1996 | Incumbent re-elected. | √ Pete Sessions (Republican) 57.2% Eric Roberson (Democratic) 40.6% Alex Bischoff (Libertarian) 2.2% |
Utah
| District | Incumbent | Party | First elected |
Results | Candidates |
|---|---|---|---|---|---|
| Utah 1 | Rob Bishop | Republican | 2002 | Incumbent re-elected. | √ Rob Bishop (Republican) 64.9% Morgan Bowen (Democratic) 30.5% Kirk Pearson (Constitution) 2.4% Joseph Geddes Buchman (Libertarian) 2.2% |
| Utah 2 | Jim Matheson | Democratic | 2000 | Incumbent re-elected. | √ Jim Matheson (Democratic) 63.4% Bill Dew (Republican) 34.5% Matthew Arndt (Libertarian) 1.3% Dennis Ray Emery (Constitution) 0.8% |
| Utah 3 | Chris Cannon | Republican | 1996 | Incumbent lost renomination. New member elected. Republican hold. |
√ Jason Chaffetz (Republican) 65.6% Bennion L. Spencer (Democratic) 28.3% Jim Noorlander (Constitution) 6.1% |
Vermont
| District | Incumbent | Party | First elected |
Results | Candidates |
|---|---|---|---|---|---|
| Vermont at-large | Peter Welch | Democratic | 2006 | Incumbent re-elected. | √ Peter Welch (Democratic & Republican) 83.2% Mike Bethel (Independent) 4.8% Jerry Trudell (Independent) 3.6% Thomas James Herman (Vermont Progressive) 3.0% Cris Ericson (Independent) 2.6% Jane Newton (Liberty Union) 1.7% |
Virginia
| District | Incumbent | Party | First elected |
Results | Candidates |
|---|---|---|---|---|---|
| Virginia 1 | Rob Wittman | Republican | 2007 | Incumbent re-elected. | √ Rob Wittman (Republican) 56.6% Bill Day (Democratic) 41.8% Nathan Larson (Libertarian) 1.5% |
| Virginia 2 | Thelma Drake | Republican | 2004 | Incumbent lost re-election. New member elected. Democratic gain. |
√ Glenn Nye (Democratic) 52.4% Thelma Drake (Republican) 47.5% |
| Virginia 3 | Bobby Scott | Democratic | 1992 | Incumbent re-elected. | √ Bobby Scott (Democratic) Unopposed |
| Virginia 4 | Randy Forbes | Republican | 2001 | Incumbent re-elected. | √ Randy Forbes (Republican) 59.6% Andrea Miller (Democratic) 40.2% |
| Virginia 5 | Virgil Goode | Republican | 1996 | Incumbent lost re-election. New member elected. Democratic gain. |
√ Tom Perriello (Democratic) 50.1% Virgil Goode (Republican) 49.9% |
| Virginia 6 | Bob Goodlatte | Republican | 1992 | Incumbent re-elected. | √ Bob Goodlatte (Republican) 61.6% Sam Rasoul (Democratic) 36.6% Janice Lee Allen (Independent) 1.7% |
| Virginia 7 | Eric Cantor | Republican | 2000 | Incumbent re-elected. | √ Eric Cantor (Republican) 62.7% Anita Hartke (Democratic) 37.1% |
| Virginia 8 | Jim Moran | Democratic | 1990 | Incumbent re-elected. | √ Jim Moran (Democratic) 67.9% Mark Ellmore (Republican) 29.7% J. Ron Fisher (Independent Green) 2.1% |
| Virginia 9 | Rick Boucher | Democratic | 1982 | Incumbent re-elected. | √ Rick Boucher (Democratic) Unopposed |
| Virginia 10 | Frank Wolf | Republican | 1980 | Incumbent re-elected. | √ Frank Wolf (Republican) 58.8% Judy Feder (Democratic) 38.8% Neeraj Nigam (Independent) 2.2% |
| Virginia 11 | Tom Davis | Republican | 1994 | Incumbent retired. New member elected. Democratic gain. |
√ Gerry Connolly (Democratic) 54.7% Keith Fimian (Republican) 43.0% Joseph Oddo (Independent Green) 2.0% |
Washington
| District | Incumbent | Party | First elected |
Results | Candidates |
|---|---|---|---|---|---|
| Washington 1 | Jay Inslee | Democratic | 1998 | Incumbent re-elected. | √ Jay Inslee (Democratic) 67.8% Larry Ishmael (Republican) 32.2% |
| Washington 2 | Rick Larsen | Democratic | 2000 | Incumbent re-elected. | √ Rick Larsen (Democratic) 62.4% Rick Bart (Republican) 37.6% |
| Washington 3 | Brian Baird | Democratic | 1998 | Incumbent re-elected. | √ Brian Baird (Democratic) 64.0% Michael Delavar (Republican) 36.0% |
| Washington 4 | Doc Hastings | Republican | 1994 | Incumbent re-elected. | √ Doc Hastings (Republican) 63.1% George Fearing (Democratic) 36.9% |
| Washington 5 | Cathy McMorris Rodgers | Republican | 2004 | Incumbent re-elected. | √ Cathy McMorris Rodgers (Republican) 65.3% Mark Mays (Democratic) 34.7% |
| Washington 6 | Norm Dicks | Democratic | 1976 | Incumbent re-elected. | √ Norm Dicks (Democratic) 66.9% Doug Cloud (Republican) 33.1% |
| Washington 7 | Jim McDermott | Democratic | 1988 | Incumbent re-elected. | √ Jim McDermott (Democratic) 83.6% Steve Beren (Republican) 16.4% |
| Washington 8 | Dave Reichert | Republican | 2004 | Incumbent re-elected. | √ Dave Reichert (Republican) 52.8% Darcy Burner (Democratic) 47.2% |
| Washington 9 | Adam Smith | Democratic | 1996 | Incumbent re-elected. | √ Adam Smith (Democratic) 65.5% James Postma (Republican) 34.5% |
West Virginia
| District | Incumbent | Party | First elected |
Results | Candidates |
|---|---|---|---|---|---|
| West Virginia 1 | Alan Mollohan | Democratic | 1982 | Incumbent re-elected. | √ Alan Mollohan (Democratic) Unopposed |
| West Virginia 2 | Shelley Capito | Republican | 2000 | Incumbent re-elected. | √ Shelley Capito (Republican) 57.1% Anne Barth (Democratic) 42.9% |
| West Virginia 3 | Nick Rahall | Democratic | 1976 | Incumbent re-elected. | √ Nick Rahall (Democratic) 66.9% Marty Gearheart (Republican) 33.1% |
Wisconsin
| District | Incumbent | Party | First elected |
Results | Candidates |
|---|---|---|---|---|---|
| Wisconsin 1 | Paul Ryan | Republican | 1998 | Incumbent re-elected. | √ Paul Ryan (Republican) 64.0% Marge Krupp (Democratic) 34.7% Joseph Kexel (Libertarian) 1.3% |
| Wisconsin 2 | Tammy Baldwin | Democratic | 1998 | Incumbent re-elected. | √ Tammy Baldwin (Democratic) 69.3% Peter Theron (Republican) 30.6% |
| Wisconsin 3 | Ron Kind | Democratic | 1996 | Incumbent re-elected. | √ Ron Kind (Democratic) 63.2% Paul Stark (Republican) 34.4% Kevin Barrett (Libertarian) 2.3% |
| Wisconsin 4 | Gwen Moore | Democratic | 2004 | Incumbent re-elected. | √ Gwen Moore (Democratic) 87.6% Michael LaForest (Independent) 11.5% |
| Wisconsin 5 | Jim Sensenbrenner | Republican | 1978 | Incumbent re-elected. | √ Jim Sensenbrenner (Republican) 79.6% Robert R. Raymond (Independent) 20.2% |
| Wisconsin 6 | Tom Petri | Republican | 1979 | Incumbent re-elected. | √ Tom Petri (Republican) 63.7% Roger Kittelson (Democratic) 36.2% |
| Wisconsin 7 | Dave Obey | Democratic | 1969 | Incumbent re-elected. | √ Dave Obey (Democratic) 60.8% Dan Mielke (Republican) 39.1% |
| Wisconsin 8 | Steve Kagen | Democratic | 2006 | Incumbent re-elected. | √ Steve Kagen (Democratic) 54.0% John Gard (Republican) 45.9% |
Wyoming
| District | Incumbent | Party | First elected |
Results | Candidates |
|---|---|---|---|---|---|
| Wyoming at-large | Barbara Cubin | Republican | 1994 | Incumbent retired. New member elected. Republican hold. |
√ Cynthia Lummis (Republican) 52.6% Gary Trauner (Democratic) 42.8% W. David Herbert (Libertarian) 4.4% |
Non-voting Delegates
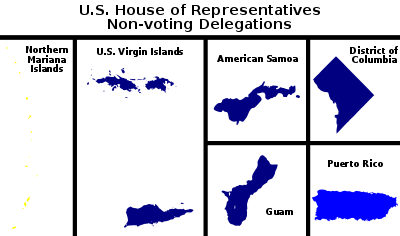
American Samoa
| District | Incumbent | Party | First elected |
Results | Candidates |
|---|---|---|---|---|---|
| American Samoa at-large | Eni Faleomavaega | Democratic | 1988 | Incumbent re-elected. | √ Eni Faleomavaega (Democratic) 60.4% Aumua Amata Coleman (Republican) 35.0% Rosie F. Tago Lancaster (Independent) 4.6% |
District of Columbia
| District | Incumbent | Party | First elected |
Results | Candidates |
|---|---|---|---|---|---|
| District of Columbia at-large | Eleanor Holmes Norton | Democratic | 1990 | Incumbent re-elected. | √ Eleanor Holmes Norton (Democratic) 92.3% Maude Hills (Green) 6.8% |
Guam
| District | Incumbent | Party | First elected |
Results | Candidates |
|---|---|---|---|---|---|
| Guam at-large | Madeleine Bordallo | Democratic | 2002 | Incumbent re-elected. | √ Madeleine Bordallo (Democratic) Unopposed |
Northern Mariana Islands
| District | Incumbent | Party | First elected |
Results | Candidates |
|---|---|---|---|---|---|
| Northern Mariana Islands at-large | New seat | New member elected. Independent gain. |
√ Gregorio Sablan (Independent) 24.5% Pedro Tenorio (Republican) 20.7% John Gonzales (Independent) 18.7% Juan Lizama (Independent) 17.3% Luis Cristostimo (Independent) 9.5% David Cing (Democratic) 2.9% Felipe Atalig (Independent) 2.5% Chong Won (Independent) 2.4% John Davis (Independent) 1.5% | ||
Puerto Rico
| District | Incumbent | Party | First elected |
Results | Candidates |
|---|---|---|---|---|---|
| Puerto Rico at-large | Luis Fortuño | New Progressive Party | 2004 | New member elected. New Progressive hold. |
√ Pedro Pierluisi (New Progressive)[39] 53.1% Alfredo Salazar (PPD) 42.5% Carlos Alberto Velazquez Lopez (PPR) 2.4% Jessica Martinez (Puerto Rican Independence) 2.0% |
United States Virgin Islands
| District | Incumbent | Party | First elected |
Results | Candidates |
|---|---|---|---|---|---|
| U.S. Virgin Islands at-large | Donna Christian-Christensen | Democratic | 1996 | Incumbent re-elected. | √ Donna Christian-Christensen (Democratic) Unopposed |
See also
References
- ↑ Barbara Bradley Hagerty & Deborah Tedford (November 4, 2008). "Democrats Poised For Landslide Wins In House". NPR.
- ↑ Susan Haigh (November 9, 2008). "G.O.P. a Dying Breed in New England". USA Today. Retrieved April 18, 2014.
- ↑ Jon Lender & Mark Pazniokas (November 5, 2008). "Jim Himes Defeats Christopher Shays in 4th District". The Hartford Courant. Retrieved April 18, 2014.
- ↑ "2008 House Summary". Cook Political Report. August 21, 2008. Archived from the original on October 16, 2008. Retrieved October 13, 2008.
- ↑ "Cramer will not seek re-election to Congress". Birmingham News. March 13, 2008.
- ↑ Judy Holland (May 27, 2008). "'Average guy,' remarkable career: Retiring McNulty looks back with pride on 20 years in the House". Times Union.
- ↑ Kosseff, Jeff; Charles Pope (February 7, 2008). "Rep. Hooley will not run for re-election". The Oregonian.
- ↑ "Congressman Everett Announces Intentions to Retire". Website of Congressman Terry Everett. September 26, 2007. Archived from the original on December 7, 2008. Retrieved June 28, 2008.
- ↑ J. Wilke (August 24, 2007). "Renzi Won't Seek Re-election as Federal Inquiry Broadens". Wall Street Journal. p. A6.
- ↑ Peter Hecht (June 2, 2008). "Fight to replace Doolittle divides Placer Republicans". The Sacramento Bee.
- ↑ Jackie Kucinich and Aaron Blake (January 25, 2008). "Weldon will not seek reelection". The Hill.
- ↑ "Rep. Weller will not seek another term in Congress". The State Journal-Register. September 9, 2007. Retrieved September 24, 2007.
- ↑ Hal Dardick (September 21, 2007). "Weller won't seek new term". Chicago Tribune.
- ↑ Raymond Hernandez (November 10, 2007). "Citing Health, Lawmaker Announces Plan to Retire". The New York Times. Retrieved December 1, 2007. , "Representative Jim Saxton of New Jersey, a Republican who has served in Congress since 1984, said Friday that he would not seek re-election next year because he had prostate cancer."
- ↑ Raju Chebium (November 19, 2007). "Ferguson won't seek re-election to Congress". Home News Tribune. Archived from the original on February 29, 2008. Retrieved November 19, 2007. , "Rep. Mike Ferguson, R-Warren Township, said today he won't seek re-election next year to a fifth term ... he next elections are in November 2008; Stender is again a Democratic candidate for the 7th district seat Ferguson currently occupies."
- ↑ "Ohio Representative David Hobson Announces Retirement". Fox News. Associated Press. October 15, 2007. Retrieved June 1, 2009.
- ↑ 8-term Ohio Rep. Deborah Pryce to retire - politics | NBC News. MSNBC (2007-08-16). Retrieved on 2013-08-16.
- ↑ "GOP Rep. Peterson Will Retire at End of Term". CQ Politics. January 3, 2008. Archived from the original on September 18, 2008.
- ↑ Josh Kraushaar (January 3, 2008). "Peterson To Retire". CBS News.
- ↑ "Top Hispanic Republican Wins Gubernatorial Election in Puerto Rico". Market Watch. Archived from the original on December 9, 2008. Retrieved September 12, 2018.
- ↑ Amy Gardner (January 30, 2008). "U.S. Rep. Davis to Retire, Ending 14-Year Tenure in Congress". The Washington Post.
- ↑ Marie Horrigan (November 9, 2007). "Wyoming Republican Cubin to Leave the House". Archived from the original on September 18, 2008.
- ↑ 2008 Idaho Secretary of State Archived February 20, 2015, at the Wayback Machine.- General Elections Statewide Totals
- ↑ Elliott, Scott (November 8, 2006). "The future of the Congress". ElectionProjection.com. Archived from the original on 2007-02-07. Retrieved 2007-02-15.
- ↑ Rothenberg, Stuart (April 8, 2008). "Dangerous Dozen Open House Seats". RealClearPolitics.com. Retrieved 2008-04-08.
- ↑ Novak, Robert (May 2, 2007). "Evans-Novak Political Report". Human Events. Retrieved 2007-05-02.
- ↑ "Contract - Democratic or GOP control of the House of Representatives, 2008". InTrade.com. Archived from the original on September 19, 2008. Retrieved February 6, 2008.
- ↑ Gunzburger, Ron (May 14, 2008). "Politics1.com". Politics1.com. Archived from the original on March 14, 2010. Retrieved May 14, 2008.
- ↑ Cook Political Report Archived December 9, 2008, at the Wayback Machine., as of November 4, 2008
- ↑ Rothenberg Political Report, as of November 2, 2008
- ↑ CQ Politics, as of November 3, 2008
- ↑ The Last Last Word, as of November 3, 2008
- ↑ "U.S. House". CNN. November 5, 2008. Retrieved November 5, 2008.
- ↑ "The Green Papers 2008 U.S. House Popular Vote and FEC Total Receipts by Party". The Green Papers. Retrieved November 13, 2008.
- ↑ "2008 General Election". The Green Papers. Retrieved November 13, 2008.
- ↑ http://history.house.gov/Institution/Election-Statistics/Election-Statistics/
- ↑ "American Samoa 2008 General Election". The Green Papers. Retrieved November 11, 2008.
- ↑ "Northern Marianas 2008 General Election". The Green Papers. Retrieved November 11, 2008.
- ↑ Access Denied. NationalJournal.com. Retrieved on 2013-08-16.
External links
- "House Competitive Race Charts". The Cook Political Report.
- "House: Races to Watch". CQ Politics. Archived from the original on December 13, 2007.
- "2008 House Ratings". The Rothenberg Political Report.
- "House Outlook". Larry Sabato's Crystal Ball.
- United States Election 2008 Web Archive from the U.S. Library of Congress
| Political activities |  | |
|---|---|---|
| Family |
| |