Pennsylvania Democratic primary, 2016
|
| |||||||||||||||||||
| |||||||||||||||||||
| |||||||||||||||||||
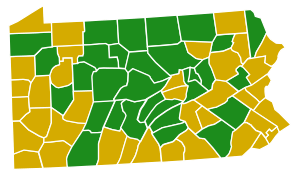 Election results by county.
Hillary Clinton
Bernie Sanders | |||||||||||||||||||

The 2016 Pennsylvania Democratic primary was held on April 26 in the U.S. state of Pennsylvania as one of the Democratic Party's primaries ahead of the 2016 presidential election.
The Democratic Party's primaries in Connecticut, Delaware, Maryland and Rhode Island were held the same day, as were Republican primaries in the same five states, including their own Pennsylvania primary. Despite winning the Pennsylvania primary, Clinton went on to lose the state in the general election. The victory in Pennsylvania, together with other states in the so-called Blue Wall, won Trump the presidency.
Opinion polling
| Poll source | Date | 1st | 2nd | 3rd | Other |
|---|---|---|---|---|---|
| Official Primary results | April 26, 2016 | Hillary Clinton 55.6% |
Bernie Sanders 43.5% |
Other 0.9% | |
| FOX 29/Opinion Savvy[1]
Margin of error: ± 3.2%
|
April 24, 2016 | Hillary Clinton 52% |
Bernie Sanders 41% |
Others / Undecided 7% | |
| CPEC LLC[2]
Margin of error: ± 2.3%
|
April 22–24, 2016 | Hillary Clinton 63% |
Bernie Sanders 37% |
||
| Public Policy Polling[3]
Margin of error: ± 3.6%
|
April 22–24, 2016 | Hillary Clinton 51% |
Bernie Sanders 41% |
Others / Undecided 9% | |
| American Research Group[4]
Margin of error: ± 5.0%
|
April 21-24, 2016 | Hillary Clinton 58% |
Bernie Sanders 38% |
Others / Undecided 4% | |
| Harper Polling[5]
Margin of error: ± 3.9%
|
April 21-23, 2016 | Hillary Clinton 61% |
Bernie Sanders 33% |
Others / Undecided 6% | |
| CBS/YouGov[6]
Margin of error: ± 6.7%
|
April 20-22, 2016 | Hillary Clinton 51% |
Bernie Sanders 43% |
Others / Undecided 6% | |
| NBC/WSJ/Marist[7]
Margin of error: ± 1.9%
|
April 18-20, 2016 | Hillary Clinton 55% |
Bernie Sanders 40% |
Others / Undecided 5% | |
| Monmouth[8]
Margin of error: ± 5.6%
|
April 17-19, 2016 | Hillary Clinton 52% |
Bernie Sanders 39% |
Others / Undecided 9% | |
| Franklin & Marshall College[9]
Margin of error: ± 5.3%
|
April 11-18, 2016 | Hillary Clinton 58% |
Bernie Sanders 31% |
Others / Undecided 11% | |
| FOX News[10]
Margin of error: ± 3.5%
|
April 4-7, 2016 | Hillary Clinton 49% |
Bernie Sanders 38% |
Others / Undecided 13% | |
| Quinnipiac[11]
Margin of error: ± 4.3%
|
March 30-April 4, 2016 | Hillary Clinton 50% |
Bernie Sanders 44% |
Others / Undecided 6% | |
| Harper[12]
Margin of error: ± 4.0%
|
April 2-3, 2016 | Hillary Clinton 55% |
Bernie Sanders 33% |
Others / Undecided 12% | |
| Franklin & Marshall[13]
Margin of error: ± 4.7%
|
March 14-20, 2016 | Hillary Clinton 53% |
Bernie Sanders 28% |
Others / Undecided 19% | |
| Harper[14]
Margin of error: ± 5.3%
|
March 1-2, 2016 | Hillary Clinton 57% |
Bernie Sanders 27% |
Others / Undecided 16% | |
| Franklin & Marshall College[15]
Margin of error: ± 3.1%
|
February 13–21, 2016 | Hillary Clinton 48% |
Bernie Sanders 27% |
Others / Undecided 25% | |
| Robert Morris University[16]
Margin of error: ± 4.5%
|
February 11–16, 2016 | Hillary Clinton 48% |
Bernie Sanders 41% |
Others / Undecided 11% | |
| Harper[17]
Margin of error: ± 3.8%
|
January 22–23, 2016 | Hillary Clinton 55% |
Bernie Sanders 28% |
Martin O'Malley 4% |
Undecided 13% |
| Franklin & Marshall[18]
Margin of error: ± 3.6%
|
January 18–23, 2016 | Hillary Clinton 46% |
Bernie Sanders 29% |
Martin O'Malley 2% |
Other 7%, Undecided 16% |
| Poll source | Date | 1st | 2nd | 3rd | Other |
|---|---|---|---|---|---|
| Franklin & Marshall[19]
Margin of error: ± 3.9%
|
October 19–25, 2015 | Hillary Clinton 52% |
Bernie Sanders 18% |
Martin O'Malley 0% |
Other 12%, Undecided 18% |
| Public Policy Polling
Margin of error: ± 4.8%
|
October 8–11, 2015 | Hillary Clinton 40% |
Bernie Sanders 22% |
Joe Biden 20% |
Lincoln Chafee 3%, Martin O'Malley 2%, Lawrence Lessig 1%, Jim Webb 1%, Not Sure 12% |
| Quinnipiac University[20]
Margin of error: ± 4.6%
|
August 7–18, 2015 | Hillary Clinton 45% |
Bernie Sanders 19% |
Joe Biden 17% |
Jim Webb 1%, Martin O'Malley 1%, Lincoln Chafee 0%, Other 2%, Wouldn't vote 3%, Undecided 12% |
| Quinnipiac University[21]
Margin of error: ± 4.9%
|
June 4–15, 2015 | Hillary Clinton 53% |
Joe Biden 15% |
Bernie Sanders 10% |
Jim Webb 2%, Martin O'Malley 1%, Lincoln Chafee 0%, Other 1%, Wouldn't vote 4%, Undecided 15% |
| Public Policy Polling
Margin of error: ± 5%
|
May 21–24, 2015 | Hillary Clinton 63% |
Bernie Sanders 14% |
Martin O'Malley 6% |
Lincoln Chafee 3%, Jim Webb 3%, Not sure 12% |
| Quinnipiac University
Margin of error: ± 4.8%
|
March 17–28, 2015 | Hillary Clinton 48% |
Elizabeth Warren 15% |
Joe Biden 13% |
Martin O'Malley 1%, Bernie Sanders 1%, Jim Webb 1%, Other 2%, Wouldn't vote 4%, Undecided 15% |
| Joe Biden 34% |
Elizabeth Warren 27% |
Martin O'Malley 4% |
Bernie Sanders 2%, Jim Webb 1%, Other 3%, Wouldn't vote 5%, Undecided 25% | ||
| Quinnipiac University
Margin of error: ± 5%
|
January 22 – February 1, 2015 | Hillary Clinton 54% |
Elizabeth Warren 12% |
Joe Biden 10% |
Martin O'Malley 2%, Bernie Sanders 2%, Jim Webb 1%, Other 1%, Wouldn't vote 4%, Undecided 15% |
| Joe Biden 34% |
Elizabeth Warren 21% |
Martin O'Malley 5% |
Jim Webb 4%, Bernie Sanders 3%, Other 2%, Wouldn't vote 5%, Undecided 26% | ||
| Public Policy Polling
Margin of error: ± 4.4%
|
January 15–18, 2015 | Hillary Clinton 58% |
Joe Biden 13% |
Elizabeth Warren 11% |
Bernie Sanders 5%, Martin O'Malley 1%, Jim Webb 1%, Someone else/Undecided 11% |
| Poll source | Date | 1st | 2nd | 3rd | Other |
|---|---|---|---|---|---|
| Public Policy Polling
Margin of error: ± 5%
|
May 30 – June 1, 2014 | Hillary Clinton 65% |
Joe Biden 9% |
Andrew Cuomo 5% |
Elizabeth Warren 5%, Cory Booker 4%, Kirsten Gillibrand 1%, Brian Schweitzer 1%, Mark Warner 1%, Martin O'Malley 0%, Someone else/Not sure 10% |
| Franklin & Marshall College
Margin of error: ± 4.3%
|
March 25–31, 2014 | Hillary Clinton 55% |
Joe Biden 5% |
Elizabeth Warren 4% |
Andrew Cuomo 2%, Howard Dean 0%, Other 5%, Undecided 29% |
| Franklin & Marshall College
Margin of error: ± 4.2%
|
February 18–23, 2014 | Hillary Clinton 58% |
Elizabeth Warren 7% |
Joe Biden 6% |
Andrew Cuomo 2%, Howard Dean 1%, Other 3%, Undecided 23% |
| Poll source | Date | 1st | 2nd | 3rd | Other |
|---|---|---|---|---|---|
| Public Policy Polling
Margin of error: ± 4.7%
|
November 22–25, 2013 | Hillary Clinton 61% |
Joe Biden 13% |
Elizabeth Warren 11% |
Andrew Cuomo 3%, Cory Booker 2%, Kirsten Gillibrand 1%, Martin O'Malley 0%, Brian Schweitzer 0%, Mark Warner 0%, Someone Else/Undecided 9% |
Results
| Pennsylvania Democratic primary, April 26, 2016 | |||||
|---|---|---|---|---|---|
| Candidate | Popular vote | Estimated delegates | |||
| Count | Percentage | Pledged | Unpledged | Total | |
| Hillary Clinton | 935,107 | 55.61% | 106 | 20 | 126 |
| Bernie Sanders | 731,881 | 43.53% | 83 | 0 | 83 |
| Rocky De La Fuente | 14,439 | 0.86% | 0 | 0 | 0 |
| Total | 1,681,427 | 100% | 189 | 20 | 209 |
| Source: The Green Papers, Pennsylvania State Elections Official Results | |||||
Results by county
| County[22] | Clinton | % | Sanders | % | Others | Totals | Turnout | Margin |
|---|---|---|---|---|---|---|---|---|
| Adams | 3,863 | 48.08% | 4,101 | 51.04% | 71 | 8,035 | 41.15% | -2.96% |
| Allegheny | 123,715 | 55.08% | 99,078 | 44.11% | 1,819 | 224,612 | 43.18% | 10.97% |
| Armstrong | 2,992 | 48.30% | 3,073 | 49.60% | 130 | 6,195 | 39.00% | -1.31% |
| Beavers | 13,531 | 56.92% | 9,873 | 41.53% | 369 | 23,773 | 40.41% | 15.39% |
| Bedford | 1,388 | 48.91% | 1,387 | 48.87% | 63 | 2,838 | 29.56% | 0.04% |
| Berks | 21,063 | 48.35% | 22,078 | 50.68% | 422 | 43,563 | 37.68% | -2.33% |
| Blair | 3,965 | 46.87% | 4,360 | 51.54% | 135 | 23,988 | 35.27% | -4.67% |
| Bradford | 1,809 | 48.88% | 1,839 | 49.69% | 53 | 3,701 | 35.49% | -0.81% |
| Bucks | 46,917 | 55.90% | 36,173 | 43.10% | 837 | 83,927 | 43.88% | 12.80% |
| Butler | 8,790 | 52.10% | 7,833 | 46.43% | 249 | 16,872 | 40.98% | 5.67% |
| Cambria | 8,507 | 47.16% | 9,024 | 50.02% | 509 | 18,040 | 39.64% | -2.87% |
| Cameron | 186 | 41.89% | 240 | 54.05% | 18 | 444 | 36.33% | -12.16% |
| Carbon | 3,384 | 48.73% | 3,460 | 49.82% | 101 | 6,945 | 38.13% | -1.09% |
| Centre | 8,458 | 44.72% | 10,331 | 54.63% | 123 | 18,912 | 41.15% | -9.90% |
| Chester | 33,082 | 55.62% | 26,193 | 44.04% | 204 | 59,479 | 46.05% | 11.58% |
| Clarion | 1,529 | 49.34% | 1,511 | 48.76% | 59 | 3,099 | 38.37% | 0.58% |
| Clearfield | 3,194 | 47.30% | 3,414 | 50.56% | 145 | 6,753 | 32.18% | -3.26% |
| Clinton | 1,704 | 48.63% | 1,739 | 49.63% | 61 | 3,504 | 39.02% | -1.00% |
| Columbia | 2,504 | 40.48% | 3,601 | 58.21% | 81 | 6,186 | 39.59% | -17.73% |
| Crawaford | 3,707 | 48.69% | 3,789 | 49.76% | 118 | 7,614 | 39.39% | -1.08% |
| Cumberland | 12,421 | 51.54% | 11,513 | 47.77% | 168 | 24,102 | 45.45% | 3.77% |
| Dauphin | 18,474 | 56.82% | 13,787 | 42.41% | 250 | 32,511 | 36.26% | 14.42% |
| Delaware | 46,252 | 59.73% | 30,824 | 39.80% | 363 | 77,439 | 43.45% | 19.92% |
| Elk | 1,601 | 45.50% | 1,846 | 52.46% | 72 | 3,519 | 36.47% | -6.96% |
| Erie | 20,395 | 52.17% | 18,362 | 46.97% | 338 | 39,095 | 40.76% | 5.20% |
| Fayette | 9,195 | 57.69% | 6,460 | 40.53% | 285 | 15,940 | 32.70% | 17.16% |
| Forest | 251 | 52.07% | 221 | 45.85% | 10 | 482 | 37.28% | 6.22% |
| Franklin | 4,707 | 51.69% | 4,282 | 47.02% | 118 | 9,107 | 37.27% | 4.67% |
| Fulton | 366 | 48.87% | 365 | 48.73% | 18 | 749 | 28.81% | 0.13% |
| Greene | 2,268 | 52.55% | 1,927 | 44.65% | 121 | 4,316 | 34.27% | 7.90% |
| Huntingdon | 1,304 | 43.28% | 1,666 | 55.29% | 43 | 3,013 | 33.11% | -12.01% |
| Indiana | 4,049 | 50.34% | 3,839 | 47.73% | 156 | 8,044 | 40.04% | 2.61% |
| Jefferson | 1,249 | 43.89% | 1,507 | 52.95% | 90 | 9,712 | 29.30% | -9.07% |
| Juniata | 664 | 45.60% | 754 | 51.79% | 38 | 3,996 | 36.44% | -6.18% |
| Lackawanna | 23,020 | 56.52% | 17,308 | 42.49% | 402 | 40,730 | 45.36% | 14.02% |
| Lancaster | 19,840 | 47.97% | 21,321 | 51.55% | 197 | 41,358 | 40.14% | -3.58% |
| Lawrence | 5,845 | 58.64% | 3,981 | 39.94% | 142 | 9,968 | 36.39% | 18.70% |
| Lebanon | 4,669 | 49.88% | 4,599 | 49.13% | 93 | 9,361 | 35.78% | 0.75% |
| Lehigh | 20,430 | 52.40% | 18,338 | 47.03% | 224 | 38,992 | 35.66% | 5.37% |
| Luzerne | 20,542 | 51.94% | 18,543 | 46.89% | 462 | 39,547 | 37.49% | 5.05% |
| Lycoming | 3,808 | 43.94% | 4,730 | 54.58% | 128 | 8,666 | 39.29% | -10.64% |
| McKean | 1,053 | 46.18% | 1,190 | 52.19% | 37 | 2,280 | 31.50% | -6.01% |
| Mercer | 6,530 | 56.99% | 4,739 | 41.36% | 190 | 11,459 | 33.91% | 15.63% |
| Miflin | 1,201 | 48.29% | 1,242 | 49.94% | 44 | 2,487 | 32.93% | -1.65% |
| Monroe | 8,169 | 53.27% | 7,042 | 45.92% | 123 | 15,334 | 31.37% | 7.35% |
| Montgomery | 75,628 | 59.00% | 52,132 | 40.67% | 421 | 128,181 | 49.31% | 18.33% |
| Montour | 846 | 47.85% | 890 | 50.34% | 32 | 1,768 | 37.84% | -2.49% |
| Northampton | 18,104 | 51.18% | 16,940 | 47.89% | 328 | 35,372 | 37.27% | 3.29% |
| Northumberland | 3,582 | 48.92% | 3,632 | 49.60% | 108 | 7,322 | 33.78% | -0.68% |
| Perry | 1,329 | 42.60% | 1,752 | 56.15% | 39 | 3,120 | 43.59% | -13.56% |
| Philadelphia | 218,959 | 62.59% | 129,353 | 36.98% | 1,493 | 349,805 | 43.50% | 25.62% |
| Pike | 2,009 | 51.22% | 1,894 | 48.29% | 19 | 3,922 | 29.70% | 2.93% |
| Potter | 402 | 40.94% | 560 | 57.03% | 20 | 982 | 33.83% | -16.09% |
| Schuylkill | 6,534 | 51.30% | 6,040 | 47.42% | 164 | 12,738 | 37.61% | 3.88% |
| Snyder | 1,125 | 50.40% | 1,081 | 48.43% | 26 | 2,232 | 41.42% | 1.97% |
| Somerset | 3,114 | 48.18% | 3,206 | 49.61% | 143 | 6,463 | 35.95% | -1.42% |
| Sullivan | 312 | 50.16% | 296 | 47.59% | 14 | 622 | 40.65% | 2.57% |
| Susquehanna | 1,680 | 50.42% | 1,610 | 48.32% | 42 | 3,332 | 41.41% | 2.10% |
| Tioga | 1,055 | 43.20% | 1,354 | 55.45% | 33 | 2,442 | 34.07% | -12.24% |
| Union | 1,626 | 50.50% | 1,579 | 49.04% | 15 | 3,220 | 46.09% | 1.46% |
| Venango | 2,020 | 48.08% | 2,087 | 49.68% | 94 | 4,201 | 37.90% | -1.59% |
| Warren | 1,836 | 51.66% | 1,665 | 46.85% | 53 | 3,554 | 33.49% | 4.81% |
| Washington | 15,872 | 57.43% | 11,262 | 40.75% | 505 | 27,639 | 41.38% | 16.68% |
| Wayne | 1,859 | 47.44% | 2,026 | 51.70% | 34 | 3,919 | 39.12% | -4.26% |
| Westmoreland | 25,009 | 54.31% | 20,286 | 44.05% | 754 | 46,049 | 39.24% | 10.26% |
| Wyoming | 1,123 | 48.21% | 1,168 | 50.42% | 33 | 2,398 | 45.72% | -2.21% |
| York | 18,459 | 50.72% | 17,544 | 48.21% | 390 | 36,393 | 36.74% | 2.51% |
| Total | 935,107 | 55.61% | 731,881 | 43.53% | 14,439 | 1,681,427 | 41.39% | 12.09% |
Analysis
Clinton won a large victory over runner-up Bernie Sanders in Pennsylvania, replicating her 2008 performance against Barack Obama in the Keystone state. According to exit polls, Clinton won the white vote 51-47 (68% of the electorate), won the African American vote 70-30 (19% of the electorate), and won among women 60-39 (she lost men 50-49 to Sanders). While Sanders won among younger voters 63-37, Clinton won voters over the age of 45 66-33. Clinton swept all income and educational attainment levels except for whites without college degrees, whom Sanders won 50-49.
Clinton swept all political ideologies in the primary. She won Democrats 62-38 but lost self-identified Independents to Sanders 72-26.
Clinton also won among unions 56-43, a very important demographic in a big manufacturing state like Pennsylvania.
Clinton won large victories in all of Pennsylvania's major cities: she won in Philadelphia 63-37, the affluent Philadelphia suburbs 58-42, and also carried the cities of Pittsburgh and Erie. She won in Northeastern Pennsylvania 51-48, and in Western Pennsylvania 54-45. Sanders, for his part, did better in the rural parts of the state, winning rural voters 50-48 and carrying Central Pennsylvania 50-49.[23] Sanders swept many of the more remote and conservative counties of the state, including parts of Amish country such as Lancaster County.
Of her victory in the Keystone State, New York Times analyst Alan Rappeport commented, "Lots of Philadelphia history and imagery coming from Clinton now. It's almost as if she has her convention speech ready."[24]
References
- ↑ "Pennsylvania Democratic Presidential Primary Poll 4/25/16" (PDF). Opinion Savvy. April 25, 2016. Retrieved April 25, 2016.
- ↑ "Pennsylvania Democratic Presidential Primary Poll" (PDF). CPEC LLC. April 26, 2016. Retrieved April 26, 2016.
- ↑ "Clinton, Sanders close in CT/PA/RI; Trump Headed for Big Wins" (PDF). Public Policy Polling. April 25, 2016. Retrieved April 25, 2016.
- ↑ "2016 Pennsylvania Democratic Presidential Primary - Clinton 58%, Sanders 38% (ARG 4/21-4/24)". American Research Group. April 26, 2016. Retrieved April 26, 2016.
- ↑ "Pennsylvania Democratic Primary Poll". Harper Polling. April 26, 2016. Retrieved April 26, 2016.
- ↑ "Poll: Donald Trump, Hillary Clinton lead in Pennsylvania, Indiana". Retrieved 2016-04-24.
- ↑ "Trump and Clinton Hold Strong Leads in Pennsylvania, New Poll Shows". Retrieved 2016-04-24.
- ↑ "PENNSYLVANIA: CLINTON LEADS SANDERS BY 13" (PDF). Retrieved 2016-04-20.
- ↑ "April 2016 Franklin & Marshall College Poll" (PDF). Retrieved 2016-04-21.
- ↑ "Fox News Poll: Trump holds huge lead in Pennsylvania, Clinton up over Sanders". Retrieved 2016-04-10.
- ↑ "Pennsylvania Quinnipiac University Poll March 30-April 4, 2016" (PDF). Retrieved 2016-04-06.
- ↑ "Pennsylvania Democratic Primary Poll April 2-3, 2016". Retrieved 2016-04-05.
- ↑ "March 2016 Franklin & Marshall College Poll" (PDF). Retrieved 2016-03-24.
- ↑ "PENNSYLVANIA STATEWIDE POLL REPUBLICAN AND DEMOCRATIC PRIMARIES".
- ↑ "Franklin & Marshall February 13–21, 2016" (PDF).
- ↑ "2016 Pennsylvania Democratic Presidential Primary – Clinton 48%, Sanders 41% (Robert Morris University 2/11-2/16)".
- ↑ Field, Nick. "Harper Poll: Clinton 55% Sanders 28%". Politics PA. Retrieved 5 February 2016.
- ↑ "January 2016 Franklin & Marshall College Poll" (PDF). Franklin & Martin. 28 January 2016. Retrieved 5 February 2016.
- ↑ "Franklin and Marshall College Poll: Survey of Pennsylvanians Summary of Findings" (PDF). Franklin & Marshall. 29 October 2015. Retrieved 22 January 2016.
- ↑ "Quinnipiac poll" (PDF). Quinnipiac.edu. Retrieved 2015-08-20.
- ↑ "Quinnipiac poll" (PDF). quinnipiac.edu. Retrieved 2015-07-09.
- ↑ http://www.electionreturns.state.pa.us/ENR_New/Home/CountyResults?countyName=Tioga&ElectionID=54&ElectionType=P&IsActive=0
- ↑ "2016 Election Center". CNN. Retrieved 2016-10-16.
- ↑ "Pennsylvania Primary Election Results 2016". Retrieved 2016-10-16.