Florida Democratic primary, 2016
|
| |||||||||||||||||||
| |||||||||||||||||||
| |||||||||||||||||||
 Election results by county.
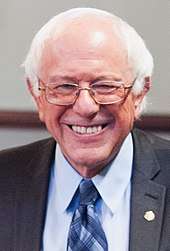
Hillary Clinton
Bernie Sanders | |||||||||||||||||||

The 2016 Florida Democratic primary took place on March 15 in the U.S. state of Florida as one of the Democratic Party's primaries ahead of the 2016 presidential election.
On the same day, the Democratic Party held primaries in Illinois, Missouri, North Carolina and Ohio, while the Republican Party held primaries in the same five states, including their own Florida primary, plus the Northern Mariana Islands.
Debates and forums
March 2016 debate in Miami
On March 9, 2016, the Democratic Party held an eighth presidential debate at Miami Dade College in Miami, Florida. It was broadcast through a partnership between Univision and The Washington Post.
Opinion polling
| Poll source | Date | 1st | 2nd | Other |
|---|---|---|---|---|
| Official Primary results | March 15, 2016 | Hillary Clinton 64.4% |
Bernie Sanders 33.3% |
Other 2.3% |
| ARG[2]
Margin of error: ± 5.0%
|
March 11–13, 2016 | Hillary Clinton 58% |
Bernie Sanders 37% |
Others / Undecided 5% |
| Quinnipiac[3]
Margin of error: ± 4.3%
|
March 8–13, 2016 | Hillary Clinton 60% |
Bernie Sanders 34% |
Others / Undecided 6% |
| Public Policy Polling[4]
Margin of error: ± 3.9%
|
March 11–12, 2016 | Hillary Clinton 57% |
Bernie Sanders 32% |
Others / Undecided 11% |
| CBS News/YouGov[5]
Margin of error: ± 4.5%
|
March 9–11, 2016 | Hillary Clinton 62% |
Bernie Sanders 34% |
Others / Undecided 4% |
| Florida Atlantic University[6]
Margin of error: ± 5%
|
March 8–11, 2016 | Hillary Clinton 59% |
Bernie Sanders 31% |
Others / Undecided 10% |
| NBC News/Wall Street Journal/Marist[7]
Margin of error: ± 4.4%
|
March 4–10, 2016 | Hillary Clinton 61% |
Bernie Sanders 34% |
Others / Undecided 5% |
| WTSP/Mason-Dixon[8]
Margin of error: ± 4.5%
|
March 7–9, 2016 | Hillary Clinton 68% |
Bernie Sanders 23% |
Others / Undecided 9% |
| Quinnipiac[9]
Margin of error: ± 4.3%
|
March 2–7, 2016 | Hillary Clinton 62% |
Bernie Sanders 32% |
Others / Undecided 6% |
| SurveyUSA/Bay News 9/News 13[10]
Margin of error: ± 3.4%
|
March 4–6, 2016 | Hillary Clinton 61% |
Bernie Sanders 30% |
Others / Undecided 9% |
| CNN/ORC[11]
Margin of error: ± 6.0%
|
March 2–6, 2016 | Hillary Clinton 61% |
Bernie Sanders 34% |
Others / Undecided 5% |
| Wash Post/Univision[12]
Margin of error: ± 6.0%
|
March 2-5, 2016 | Hillary Clinton 64% |
Bernie Sanders 26% |
Others / Undecided 10% |
| University of North Florida[13]
Margin of error: ± 3.7%
|
February 22–27, 2016 | Hillary Clinton 54% |
Bernie Sanders 24% |
Others / Undecided 22% |
| Public Policy Polling[14]
Margin of error: ± 5%
|
February 24–25, 2016 | Hillary Clinton 57% |
Bernie Sanders 32% |
Others / Undecided 11% |
| Gravis Marketing[15]
Margin of error: ± 4.3%
|
February 24, 2016 | Hillary Clinton 58% |
Bernie Sanders 42% |
|
| Quinnipiac[16]
Margin of error: ± 4.5%
|
February 21–24, 2016 | Hillary Clinton 59% |
Bernie Sanders 33% |
Others / Undecided 8% |
| Florida Southern College[17]
Margin of error: ± 4.0%
|
January 30 – February 6, 2016 | Hillary Clinton 43% |
Bernie Sanders 26% |
Others / Undecided 31% |
| Florida Atlantic University[18]
Margin of error: ± 5.0%
|
January 15–18, 2016 | Hillary Clinton 62% |
Bernie Sanders 26% |
Martin O'Malley 2% Not Reported |
| Poll source | Date | 1st | 2nd | Other |
|---|---|---|---|---|
| Florida Atlantic University[18]
Margin of error: ± 5.2%
|
November 15–16, 2015 | Hillary Clinton 66% |
Bernie Sanders 22% |
Martin O'Malley 4% Other 4.5% Undecided 3.7% |
| Bay News 9/ News13[19]
Margin of error: ± 3.9%
|
October 28 – November 1, 2015 | Hillary Clinton 66% |
Bernie Sanders 24% |
Martin O'Malley 3% Other 2% Undecided 6% |
| Saint Leo University Polling Institute[20]
Margin of error: ±6.0%
|
October 17–22, 2015 | Hillary Clinton 50.9% |
Joe Biden 15.2% | Bernie Sanders 13.3% Unsure/Don't Know 8.5% |
| Quinnipiac University[21]
Margin of error: ± 4.8%
|
September 25 – October 5, 2015 | Hillary Clinton 43% |
Joe Biden 19% |
Bernie Sanders 19% Someone else/Undecided 13% |
| Public Policy Polling[22]
Margin of error: ± 5.1%
|
September 11–13, 2015 | Hillary Clinton 55% |
Bernie Sanders 18% |
Joe Biden 17% Martin O'Malley 2% Jim Webb 1% Lincoln Chafee 1% Lawrence Lessig 0% Someone else/Undecided 6% |
| Gravis Marketing[23]
Margin of error: ± 4%
|
September 5–11, 2015 | Hillary Clinton 41.6% |
Joe Biden 21.4% |
Bernie Sanders 12.5% Martin O'Malley 1.5% Jim Webb 1.3% Lincoln Chafee 0.4% Unsure 21.3% |
| Quinnipiac University[24]
Margin of error: ± 5%
|
Posted September 4, 2015 | Hillary Clinton 52% |
Bernie Sanders 20% |
Joe Biden 15% Lincoln Chafee 4% Martin O'Malley 1% Jim Webb 1% Other 1% Undecided 6% |
| Quinnipiac University[25]
Margin of error: ± 5.3%
|
August 7–18, 2015 | Hillary Clinton 48% |
Bernie Sanders 15% |
Joe Biden 11% Martin O'Malley 1% Jim Webb 1% Lincoln Chafee 0% Other 2% Wouldn't vote 6% Undecided 17% |
| St Pete Polls[26]
Margin of error: ± 3.0%
|
July 18–28, 2015 | Hillary Clinton 55% |
Bernie Sanders 29% |
Jim Webb 2% Martin O'Malley 1% Lincoln Chafee <1% Unsure or someone else 13% |
| Mason-Dixon[27]
Margin of error: ± 4.5%
|
July 20–23, 2015 | Hillary Clinton 58% |
Bernie Sanders 17% |
Martin O'Malley 2% Lincoln Chafee 0% Jim Webb 0% Undecided 23% |
| Gravis Marketing[28]
Margin of error: ± 3%
|
June 16–20, 2015 | Hillary Clinton 64.8% |
Bernie Sanders 20.6% |
Martin O'Malley 2.1% Bill De Blasio 1.7% Jim Webb 0.9% Lincoln Chafee 0.4% Unsure 9.5% |
| Quinnipiac University[29]
Margin of error: ± 5%
|
June 4–15, 2015 | Hillary Clinton 64% |
Joe Biden 9% |
Bernie Sanders 8% Martin O'Malley 1% Lincoln Chafee 0% Jim Webb 0% Other 1% Wouldn't vote 5% Undecided 13% |
| Quinnipiac University[30]
Margin of error: ± 5.3%
|
March 17–28, 2015 | Hillary Clinton 65% |
Joe Biden 11% |
Elizabeth Warren 7% Bernie Sanders 3% Jim Webb 2% Martin O'Malley 0% Other 1% Wouldn't vote 2% Undecided 10% |
| Joe Biden 42% |
Elizabeth Warren 19% |
Bernie Sanders 6% Jim Webb 3% Martin O'Malley 1% Other 2% Wouldn't vote 4% Undecided 22% | ||
| Public Policy Polling[31]
Margin of error: ± 5.1%
|
March 19–22, 2015 | Hillary Clinton 58% |
Joe Biden 14% |
Elizabeth Warren 10% Bernie Sanders 3% Martin O'Malley 2% Jim Webb 1% Other/Undecided 11% |
| [32]
Margin of error: ± 5%
|
February 24–25, 2015 | Hillary Clinton 52% |
Elizabeth Warren 14% |
Joe Biden 9% Martin O'Malley 2% Mark Warner 2% Jim Webb 2% Undecided 18% |
| Quinnipiac University[33]
Margin of error: ± 5.5%
|
January 22 – February 1, 2015 | Hillary Clinton 61% |
Joe Biden 11% |
Elizabeth Warren 9% Bernie Sanders 2% Martin O'Malley 1% Jim Webb 1% Other 2% Wouldn't vote 4% Undecided 10% |
| Joe Biden 39% |
Elizabeth Warren 22% |
Bernie Sanders 3% Martin O'Malley 2% Jim Webb 2% Other 4% Wouldn't vote 5% Undecided 23% |
| Poll source | Date | 1st | 2nd | Other |
|---|---|---|---|---|
| Quinnipiac University[34]
Margin of error: ± 4.6%
|
July 17–21, 2014 | Hillary Clinton 67% |
Joe Biden 8% |
Elizabeth Warren 8% Andrew Cuomo 1% Martin O'Malley 0% Brian Schweitzer 0% Other 1% Wouldn't vote 3% Undecided 11% |
| Public Policy Polling[35]
Margin of error: ± 6.2%
|
June 6–9, 2014 | Hillary Clinton 66% |
Elizabeth Warren 8% |
Joe Biden 7% Cory Booker 5% Andrew Cuomo 4% Mark Warner 1% Kirsten Gillibrand 0% Martin O'Malley 0% Brian Schweitzer 0% Someone else/Undecided 9% |
| Quinnipiac University[36]
Margin of error: ± 4.4%
|
April 23–28, 2014 | Hillary Clinton 64% |
Joe Biden 11% |
Elizabeth Warren 6% Andrew Cuomo 1% Martin O'Malley 1% Brian Schweitzer 1% Other 1% Wouldn't vote 3% Undecided 13% |
| Quinnipiac University[37]
Margin of error: ± 4.3%
|
January 22–27, 2014 | Hillary Clinton 64% |
Joe Biden 9% |
Elizabeth Warren 5% Andrew Cuomo 1% Martin O'Malley 1% Mark Warner 1% Other 2% Wouldn't vote 2% Undecided 16% |
| Poll source | Date | 1st | 2nd | Other |
|---|---|---|---|---|
| Quinnipiac University[38]
Margin of error: ± 4.2%
|
November 12–17, 2013 | Hillary Clinton 70% |
Joe Biden 9% |
Elizabeth Warren 4% Andrew Cuomo 2% Martin O'Malley 1% Mark Warner 1% Other 2% Wouldn't vote 2% Undecided 10% |
| Public Policy Polling
Margin of error: ± 5.7%
|
March 15–18, 2013 | Hillary Clinton 62% |
Joe Biden 12% |
Andrew Cuomo 5% Elizabeth Warren 3% Martin O'Malley 1% Brian Schweitzer 1% Mark Warner 1% Kirsten Gillibrand 0% Deval Patrick 0% Someone Else/Undecided 14% |
| Public Policy Polling
Margin of error: ± 4.9%
|
January 11–13, 2013 | Hillary Clinton 65% |
Joe Biden 15% |
Andrew Cuomo 4% Elizabeth Warren 4% Deval Patrick 1% Mark Warner 1% Kirsten Gillibrand 0% Martin O'Malley 0% Brian Schweitzer 0% Someone Else/Undecided 11% |
| Andrew Cuomo 22% |
Elizabeth Warren 15% |
Deval Patrick 5% Martin O'Malley 4% Kirsten Gillibrand 3% Mark Warner 2% Brian Schweitzer 1% Someone Else/Undecided 48% |
Results
| Candidate | Popular vote | Estimated delegates | |||
|---|---|---|---|---|---|
| Count | Percentage | Pledged | Unpledged | Total | |
| Hillary Clinton | 1,101,414 | 64.44% | 141 | 24 | 165 |
| Bernie Sanders | 568,839 | 33.28% | 73 | 2 | 75 |
| Martin O'Malley (withdrawn) | 38,930 | 2.28% | |||
| Uncommitted | N/A | 0 | 6 | 6 | |
| Total | 1,709,183 | 100% | 214 | 32 | 246 |
| Source: The Green Papers, Florida Division of Elections - Official Primary Results | |||||
Results by district
| Florida Democratic primary, March 15, 2016 | |||||||
|---|---|---|---|---|---|---|---|
| District | Delegates | Votes Clinton | Votes Sanders | Votes Qualified | Clinton delegates | Sanders delegates | |
| 1 | 3 | 26987 | 18497 | 45484 | 2 | 1 | |
| 2 | 6 | 50190 | 34073 | 84263 | 4 | 2 | |
| 3 | 4 | 32070 | 27974 | 60044 | 2 | 2 | |
| 4 | 4 | 33920 | 22765 | 56685 | 2 | 2 | |
| 5 | 6 | 55855 | 18639 | 74494 | 4 | 2 | |
| 6 | 5 | 37995 | 24443 | 62438 | 3 | 2 | |
| 7 | 5 | 37410 | 26795 | 64205 | 3 | 2 | |
| 8 | 5 | 39384 | 24376 | 63760 | 3 | 2 | |
| 9 | 5 | 40609 | 19880 | 60489 | 3 | 2 | |
| 10 | 5 | 38011 | 22213 | 60224 | 3 | 2 | |
| 11 | 5 | 38061 | 21590 | 59651 | 3 | 2 | |
| 12 | 5 | 35498 | 23172 | 58670 | 3 | 2 | |
| 13 | 6 | 44121 | 29707 | 73828 | 4 | 2 | |
| 14 | 6 | 49146 | 23617 | 72763 | 4 | 2 | |
| 15 | 5 | 32793 | 20712 | 53505 | 3 | 2 | |
| 16 | 6 | 43921 | 25856 | 69777 | 4 | 2 | |
| 17 | 4 | 29899 | 17045 | 46944 | 3 | 1 | |
| 18 | 6 | 42804 | 20620 | 63424 | 4 | 2 | |
| 19 | 4 | 31958 | 17235 | 49193 | 3 | 1 | |
| 20 | 7 | 61998 | 15761 | 77759 | 6 | 1 | |
| 21 | 7 | 57723 | 22100 | 79823 | 5 | 2 | |
| 22 | 6 | 49602 | 22209 | 71811 | 4 | 2 | |
| 23 | 6 | 44510 | 19974 | 64484 | 4 | 2 | |
| 24 | 8 | 59274 | 13893 | 73167 | 6 | 2 | |
| 25 | 3 | 24897 | 9287 | 34184 | 2 | 1 | |
| 26 | 4 | 32069 | 14148 | 46217 | 3 | 1 | |
| 27 | 4 | 30709 | 12258 | 42967 | 3 | 1 | |
| Total | 140 | 1101414 | 568839 | 1670253 | 93 | 47 | |
| PLEO | 28 | 1101414 | 568839 | 1670253 | 18 | 10 | |
| At Large | 46 | 1101414 | 568839 | 1670253 | 30 | 16 | |
| Gr. Total | 214 | 1101414 | 568839 | 1670253 | 141 | 73 | |
| Total vote | 64.44% | 33.28% | 1,709,183 | ||||
| Source: Florida Department of State Division of Elections | |||||||
Results by county
| County[39] | Clinton | Votes | Sanders | Votes |
|---|---|---|---|---|
| Alachua | 49.2% | 17,733 | 48.8% | 17,590 |
| Baker | 38.5% | 654 | 47.4% | 805 |
| Bay | 52.6% | 5,209 | 41.7% | 4,131 |
| Bradford | 48.7% | 1,056 | 41.8% | 908 |
| Brevard | 59.7% | 31,835 | 37.7% | 20,083 |
| Broward | 72.5% | 132,527 | 26.4% | 48,330 |
| Calhoun | 36.2% | 437 | 45.2% | 545 |
| Charlotte | 62.1% | 8,125 | 35.4% | 4,634 |
| Citrus | 56.3% | 6,863 | 39.2% | 4,776 |
| Clay | 57.1% | 5,345 | 39.5% | 3,698 |
| Collier | 66.1% | 12,712 | 31.9% | 6,127 |
| Columbia | 52.9% | 2,299 | 38.6% | 1,676 |
| DeSoto | 52.6% | 987 | 38.7% | 726 |
| Dixie | 40.2% | 409 | 45.1% | 459 |
| Duval | 67.2% | 58,632 | 30.6% | 26,716 |
| Escambia | 62.2% | 16,765 | 34.6% | 9,318 |
| Flagler | 65.8% | 6,152 | 31.9% | 2,977 |
| Franklin | 47.0% | 665 | 45.7% | 647 |
| Gadsden | 76.4% | 7,446 | 20.0% | 1,944 |
| Gilchrist | 37.5% | 428 | 50.7% | 578 |
| Glades | 49.9% | 387 | 40.3% | 313 |
| Gulf | 47.4% | 568 | 43.4% | 520 |
| Hamilton | 54.7% | 758 | 34.6% | 479 |
| Hardee | 52.7% | 529 | 39.1% | 393 |
| Hendry | 60.6% | 1,156 | 33.9% | 647 |
| Hernando | 59.6% | 8,882 | 37.0% | 5,512 |
| Highlands | 61.4% | 3,711 | 34.0% | 2,054 |
| Hillsborough | 62.8% | 68,936 | 35.1% | 38,505 |
| Holmes | 28.3% | 339 | 51.7% | 619 |
| Indian River | 62.4% | 6,897 | 35.5% | 3,926 |
| Jackson | 53.9% | 2,798 | 35.5% | 1,840 |
| Jefferson | 64.6% | 1,671 | 29.5% | 762 |
| Lafayette | 30.0% | 295 | 50.9% | 501 |
| Lake | 63.5% | 15,914 | 33.8% | 8,465 |
| Lee | 62.7% | 27,940 | 35.0% | 15,624 |
| Leon | 56.5% | 27,333 | 41.1% | 19,866 |
| Levy | 50.0% | 1,570 | 43.1% | 1,354 |
| Liberty | 47.1% | 316 | 47.1% | 392 |
| Madison | 62.4% | 1,542 | 30.0% | 741 |
| Manatee | 62.5% | 18,116 | 35.1% | 10,165 |
| Marion | 62.7% | 18,220 | 34.1% | 9,892 |
| Martin | 59.8% | 6,523 | 37.6% | 4,101 |
| Miami-Dade | 74.7% | 129,467 | 24.3% | 42,009 |
| Monroe | 55.3% | 4,830 | 42.8% | 3,739 |
| Nassau | 56.2% | 2,910 | 39.8% | 2,060 |
| Okaloosa | 52.0% | 4,559 | 43.1% | 3,782 |
| Okeechobee | 55.2% | 1,150 | 37.6% | 784 |
| Orange | 63.8% | 66,654 | 35.1% | 36,639 |
| Osceola | 68.2% | 16,512 | 30.0% | 7,273 |
| Palm Beach | 71.5% | 103,369 | 27.2% | 39,314 |
| Pasco | 58.3% | 21,760 | 38.9% | 14,493 |
| Pinellas | 60.3% | 63,699 | 37.6% | 39,742 |
| Polk | 63.0% | 29,328 | 33.3% | 15,473 |
| Putnam | 49.4% | 3,182 | 42.7% | 2,747 |
| Santa Rosa | 49.2% | 3,938 | 45.0% | 3,602 |
| Sarasota | 61.1% | 25,881 | 37.3% | 15,776 |
| Seminole | 58.3% | 22,069 | 39.9% | 15,100 |
| St. Johns | 57.0% | 9,734 | 40.7% | 6,953 |
| St. Lucie | 66.9% | 17,554 | 30.8% | 8,091 |
| Sumter | 68.1% | 7,022 | 29.3% | 3,022 |
| Suwannee | 42.2% | 1,475 | 44.3% | 1,550 |
| Taylor | 45.9% | 983 | 42.4% | 907 |
| Union | 36.7% | 336 | 51.6% | 472 |
| Volusia | 60.2% | 26,276 | 37.1% | 16,170 |
| Wakulla | 48.9% | 1,659 | 42.0% | 1,424 |
| Walton | 50.0% | 1,515 | 44.9% | 1,361 |
| Washington | 47.1% | 858 | 42.9% | 781 |
| Total | 64.4% | 1,101,414 | 33.3% | 568,839 |
Analysis
Florida was generally viewed as a state Hillary Clinton would win, given her strong performance in previous contests with older voters (who comprised 65% of the Democratic electorate in Florida, the largest in any contest) and non-white voters (who made up 52% of the electorate). Clinton won the Florida Primary by 31 points, winning older voters by a margin of 71-26, and non-white voters by a margin of 74-25. Specifically, she won Hispanic/Latino voters by a margin of 68-32 (who made up 20% of the electorate), and African American voters 81-18 (who comprised 27% of the electorate). Clinton also won white voters by a narrower margin of 53-43. She won across all income and educational attainment levels.[40]
In terms of religious affiliation, Clinton won Protestants in Florida 69-29 (36% of the electorate), Catholics 69-29 (22% of the electorate), and other religious affiliations 68-31 (Jews were 4% of the electorate but were unaccounted for in exit polls). Sanders won voters who identified as agnostic/atheist 56-31. In terms of political ideology, Clinton won liberals 59-41 and moderates/conservatives 70-26. And while Clinton won Democrats 71-28, Sanders won self-identified Independents 55-41.[41]
Clinton won in Miami and along the Gold Coast 73-26, where there is a larger population of Hispanic/Latino voters who in Florida are predominantly of Cuban or Puerto Rican descent. Clinton also won the Gulf Coast and Mid-Florida 64-35, the Tampa Bay Area 63-37, the Orlando area 62-34, and the Northern Panhandle which is whiter, more conservative and more rural by a smaller margin of 58-37.[42]
References
- ↑ Florida Division of Elections - Official Primary Results Archived 2016-03-16 at the Wayback Machine.
- ↑ "ARG Florida Poll March 11-13, 2016".
- ↑ "March 14, 2016 - Trump Tops Rubio In Florida, Ties Kasich In Ohio, Quinnipiac University Poll Finds; Clinton Leads Sanders In Two Critical Primaries".
- ↑ "Midwestern States a Toss Up Tuesday" (PDF).
- ↑ "Poll: Trump and Kasich neck-and-neck in Ohio; Trump leads in Florida".
- ↑ "Poll: Marco Rubio, Ted Cruz split anti-Donald Trump vote in Florida".
- ↑ "Polls: Trump Ahead in Florida, Illinois; Kasich Leads in Ohio".
- ↑ "Poll: Rubio closing in on Trump in Florida".
- ↑ "WOMEN DRIVE CLINTON TO 2-1 LEAD AMONG FLORIDA DEMS, QUINNIPIAC UNIVERSITY POLL FINDS; SHE HAS 9-POINT LEAD IN OHIO" (PDF).
- ↑ "Exclusive Florida Decides Poll: Trump, Clinton lead Florida's presidential primaries".
- ↑ "CNN/ORC Poll: Trump, Clinton leading in Florida, Ohio".
- ↑ "Washington Post-Univision News Florida Democratic primary survey March 2016". The Washington Post. Retrieved March 10, 2016.
- ↑ "Minority voters help Clinton dominate Sanders in Florida poll". Politico Florida. Retrieved February 29, 2016.
- ↑ "Trump Leads Rubio in Florida- Even Head to Head" (PDF). Public Polling Policy. Retrieved February 26, 2016.
- ↑ "Florida Polling Results". One America News Network. Retrieved March 5, 2016.
- ↑ "WOMEN GIVE CLINTON BIG LEAD AMONG FLORIDA DEMOCRATS, QUINNIPIAC UNIVERSITY POLL FINDS; YOUNG VOTERS GO TO SANDERS" (PDF). Quinnipiac. Retrieved February 26, 2016.
- ↑ "The Florida Southern College Center for Polling and Policy Research" (PDF). Quinnipiac University. February 6, 2016.
- 1 2 "Polls". FAU College of Business. Retrieved 22 January 2016.
- ↑ "Florida Decides Poll: Trump dominates among Florida voters". baynews9.com.
- ↑ "Polling Institute at Saint Leo University – Ben Carson Nearly Ties with Frontrunner Trump Nationally Among Likely GOP Voters, while Jeb Bush Trails, Nationally and in Florida". Polling Institute at Saint Leo University.
- ↑ "2016 Presidential Swing State Polls Poll". Quinnipiac University. October 7, 2015.
- ↑ "Florida Down on Bush, Rubio Campaigns" (PDF). Public Policy Polling. 15 September 2015.
- ↑ "Florida Poll (September 12, 2015)3 (2)". Scribd.
- ↑ "Poll: Hillary Clinton, Donald Trump lead in Florida". Retrieved 2015-09-06.
- ↑ "Quinnipiac poll" (PDF). Quinnipiac.edu. Retrieved 2015-08-20.
- ↑ "Florida Statewide Democratic Primary Election survey" (PDF). Retrieved 2015-07-30.
- ↑ "BUSH TOP CHOICE OF STATE GOP VOTERS RUBIO DROPS, WALKER RUNS 3RD – AHEAD OF TRUMP, CLINTON HAS WIDE LEAD AMONG DEMOCRATS". Retrieved 2015-07-24.
- ↑ "Current Democratic and Republican Polling in Florida – Gravis". Retrieved 2015-07-09.
- ↑ http://www.quinnipiac.edu/images/polling/ps/ps06182015_Sk32gth.pdf
- ↑ Quinnipiac University. "2016 Presidential Swing State Polls Poll – April 2, 2015 – Bush Slips In Florida, Stalls – Quinnipiac University Connecticut". QU Poll.
- ↑ http://www.publicpolicypolling.com/pdf/2015/PPP_Release_FL_32415.pdf
- ↑ "Gravis Insights Florida Political Primary Poll Republican and Democrat". Gravis.
- ↑ Quinnipiac University. "2016 Presidential Swing State Polls Poll – – – Quinnipiac University Connecticut". QU Poll.
- ↑ Quinnipiac University. "Florida (FL) Poll – July 24, 2014 – Obama In Slump, But Clinton Sc – Quinnipiac University Connecticut". QU Poll.
- ↑ http://www.publicpolicypolling.com/pdf/2014/PPP_Release_FL_611.pdf
- ↑ Quinnipiac University. "Florida (FL) Poll – May 1, 2014 – Jeb Bush Is Top Dog In Florida – Quinnipiac University Connecticut". QU Poll.
- ↑ Quinnipiac University. "Florida (FL) Poll – January 31, 2014 – Bridgegate Drives Christie To – Quinnipiac University Connecticut". QU Poll.
- ↑ Quinnipiac University. "Florida (FL) Poll – November 22, 2013 – Jeb Bush, Clinton Tops In Flor – Quinnipiac University Connecticut". QU Poll.
- ↑ "2016 Election Center". CNN. Retrieved June 4, 2018.
- ↑ "2016 Election Center". CNN. Retrieved 2016-08-07.
- ↑ "2016 Election Center". CNN. Retrieved 2016-09-25.
- ↑ "2016 Election Center". CNN. Retrieved 2016-09-25.