North Carolina Democratic primary, 2016
|
| |||||||||||||||||||
| |||||||||||||||||||
| |||||||||||||||||||
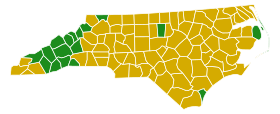 Election results by county.
Hillary Clinton
Bernie Sanders | |||||||||||||||||||


The 2016 North Carolina Democratic primary took place on March 15 in the U.S. state of North Carolina as one of the Democratic Party's primaries ahead of the 2016 presidential election.
On the same day, the Democratic Party held primaries in Florida, Illinois, Missouri, and Ohio, while the Republican Party held primaries in the same five states, including their own North Carolina primary, plus the Northern Mariana Islands.
Opinion polling
| Poll source | Date | 1st | 2nd | 3rd | Other |
|---|---|---|---|---|---|
| Primary results | March 15, 2016 | Hillary Clinton 54.5% |
Bernie Sanders 40.9% |
Others / Uncommitted 4.6% | |
| Public Policy Polling[1]
Margin of error: ± 3.6%
|
March 11–13, 2016 | Hillary Clinton 56% |
Bernie Sanders 37% |
Others / Undecided 7% | |
| High Point University/SurveyUSA[2]
Margin of error: ± 3.8%
|
March 9–10, 2016 | Hillary Clinton 58% |
Bernie Sanders 34% |
Others / Undecided 8% | |
| WRAL/SurveyUSA[3]
Margin of error: ± 3.8%
|
March 4–7, 2016 | Hillary Clinton 57% |
Bernie Sanders 34% |
Others / Undecided 9% | |
| Civitas[4]
Margin of error: ± 4.4%
|
March 3-7, 2016 | Hillary Clinton 57% |
Bernie Sanders 28% |
Others / Undecided 15% | |
| Elon University[5]
Margin of error: ± 3.6%
|
February 15–17, 2016 | Hillary Clinton 47% |
Bernie Sanders 37% |
Others / Undecided 16% | |
| SurveyUSA[6]
Margin of error: ± 4.7%
|
February 14–16, 2016 | Hillary Clinton 51% |
Bernie Sanders 36% |
No Preference 4%, Undecided 9% | |
| Public Policy Polling[7]
Margin of error: ± 4.1
|
February 14–16, 2016 | Hillary Clinton 52% |
Bernie Sanders 35% |
Others / Undecided 13% | |
| High Point[8]
Margin of error: ± 4.5%
|
January 30 – February 4, 2016 | Hillary Clinton 55% |
Bernie Sanders 29% |
Martin O'Malley 1% |
Not Sure 15% |
| Public Policy Polling[9]
Margin of error: ± 4.6%
|
January 18–19, 2016 | Hillary Clinton 59% |
Bernie Sanders 26% |
Martin O'Malley 5% |
Not Sure 10% |
| Civitas[10]
Margin of error: ± 4.4%
|
January 13–16, 2016 | Hillary Clinton 53% |
Bernie Sanders 28% |
Martin O'Malley 2% |
Undecided 17% |
| Poll source | Date | 1st | 2nd | 3rd | Other |
|---|---|---|---|---|---|
| Public Policy Polling[11]
Margin of error: ± 2.8%
|
December 5–7, 2015 | Hillary Clinton 60% |
Bernie Sanders 21% |
Martin O'Malley 10% |
Not Sure 9% |
| Elon University[12]
Margin of error: ± 4.32%
|
October 29 – November 2, 2015 | Hillary Clinton 57% |
Bernie Sanders 24% |
Martin O'Malley 3% |
Other 2% Undecided/DK 13% Refused 0.5% |
| Public Policy Polling[13]
Margin of error: ± 4.8%
|
October 23–25, 2015 | Hillary Clinton 61% |
Bernie Sanders 24% |
Martin O'Malley 5% |
Lawrence Lessig 2% |
| Public Policy Polling[14]
Margin of error: ± 4.0%
|
September 24–27, 2015 | Hillary Clinton 37% |
Joe Biden 30% |
Bernie Sanders 17% |
Jim Webb 3%, Lincoln Chafee 2%, Martin O'Malley 1%, Lawrence Lessig 0%, Not sure 10% |
| Elon University[15]
Margin of error: ± 5%
|
September 17–21, 2015 | Hillary Clinton 53.40% |
Bernie Sanders 23.00% |
Jim Webb 1.60% |
Lincoln Chafee 0.70%, Lawrence Lessig 0.70%, Martin O'Malley 0.20%, Other 2.10%, Undecided/Don't know 17.10%, Refuse 1.20% |
| Public Policy Polling[16]
Margin of error: ± 4.5%
|
August 12–16, 2015 | Hillary Clinton 55% |
Bernie Sanders 19% |
Jim Webb 5% |
Lincoln Chafee 2%, Martin O'Malley 2%, Lawrence Lessig 1% |
| Public Policy Polling[17]
Margin of error: ± 5.8%
|
July 2–6, 2015 | Hillary Clinton 55% |
Bernie Sanders 20% |
Jim Webb 7% |
Lincoln Chafee 4%, Martin O'Malley 4%, Someone else/Undecided 11% |
| Public Policy Polling
Margin of error: ± 5.9%
|
May 28–31, 2015 | Hillary Clinton 62% |
Bernie Sanders 14% |
Jim Webb 5% |
Lincoln Chafee 4%, Martin O'Malley 4%, Someone else/Undecided 12% |
| Survey USA
Margin of error: ± 4.7%
|
April 22–27, 2015 | Hillary Clinton 56% |
Elizabeth Warren 11% |
Joe Biden 8% |
Martin O'Malley 3%, Bernie Sanders 3%, Jim Webb 3%, Other/Undecided 16% |
| Public Policy Polling
Margin of error: ± 5.1%
|
April 2–5, 2015 | Hillary Clinton 53% |
Joe Biden 13% |
Elizabeth Warren 11% |
Martin O'Malley 5%, Jim Webb 3%, Bernie Sanders 2%, Someone else/Undecided 12% |
| Civitas Institute
Margin of error: ± 5%
|
March 20–23, 2015 | Hillary Clinton 53% |
Elizabeth Warren 19% |
Joe Biden 9% |
Bernie Sanders 5%, Martin O'Malley 2%, Other/Undecided 13% |
| Public Policy Polling
Margin of error: ± 4.9%
|
February 24–26, 2015 | Hillary Clinton 56% |
Elizabeth Warren 13% |
Joe Biden 11% |
Martin O'Malley 3%, Jim Webb 3%, Bernie Sanders 1%, Someone else/Undecided 12% |
| Public Policy Polling
Margin of error: ± 5%
|
January 29–31, 2015 | Hillary Clinton 54% |
Joe Biden 18% |
Elizabeth Warren 12% |
Bernie Sanders 3%, Martin O'Malley 2%, Jim Webb 2%, Someone else/Not sure 10% |
| Poll source | Date | 1st | 2nd | 3rd | Other |
|---|---|---|---|---|---|
| Public Policy Polling
Margin of error: ± 5%
|
December 4–7, 2014 | Hillary Clinton 52% |
Joe Biden 18% |
Elizabeth Warren 7% |
Bernie Sanders 5%, Andrew Cuomo 4%, Jim Webb 2%, Martin O'Malley 1%, Brian Schweitzer 0%, Someone else/Not sure 10% |
| Suffolk
Margin of error: ± ?%
|
August 16–19, 2014 | Hillary Clinton 57.09% |
Joe Biden 14.96% |
Elizabeth Warren 9.06% |
Martin O'Malley 2.76%, Andrew Cuomo 1.97%, Undecided 11.42%, Refused 2.76% |
| Civitas Institute
Margin of error: ± ?%
|
July 28–29, 2014 | Hillary Clinton 40% |
Elizabeth Warren 12% |
Joe Biden 9% |
Andrew Cuomo 3%, Bernie Sanders 2%, Howard Dean 1%, Jim Webb 1%, Amy Klobuchar 0%, Martin O'Malley 0%, Won't vote in Democratic primary 15%, Undecided 14%, Refused 3%, Other 0% |
Results
| North Carolina Democratic primary, March 15, 2016 | |||||
|---|---|---|---|---|---|
| Candidate | Popular vote | Estimated delegates | |||
| Count | Percentage | Pledged | Unpledged | Total | |
| Hillary Clinton | 622,915 | 54.50% | 60 | 8 | 68 |
| Bernie Sanders | 467,018 | 40.86% | 47 | 2 | 49 |
| Martin O'Malley (withdrawn) | 12,122 | 1.06% | |||
| Rocky De La Fuente | 3,376 | 0.30% | |||
| No Preference | 37,485 | 3.28% | |||
| Uncommitted | N/A | 3 | 3 | ||
| Total | 1,142,916 | 100% | 107 | 13 | 120 |
| Sources: The Green Papers, North Carolina State board of Elections, North Carolina Democratic Party - Official Delegation for Pledged Delegates | |||||
Results by county
| County[18] | Clinton | Votes | Sanders | Votes |
|---|---|---|---|---|
| Alamance | 53.7% | 7,374 | 41.3% | 5,755 |
| Alexander | 45.8% | 1,148 | 44.8% | 1,123 |
| Alleghany | 44.2% | 563 | 44.8% | 571 |
| Anson | 66.1% | 2,307 | 26.2% | 914 |
| Anson | 46.4% | 1,219 | 45.9% | 1,205 |
| Avery | 41.4% | 326 | 53.9% | 425 |
| Beaufort | 55.6% | 2,934 | 34.9% | 1,840 |
| Bertie | 69.5% | 2,065 | 25.4% | 756 |
| Bladen | 59.6% | 3,442 | 26.4% | 1,524 |
| Brunswick | 60.1% | 7,192 | 35.5% | 4,252 |
| Buncombe | 35.4% | 17,604 | 62.1% | 30,913 |
| Burke | 46.1% | 3,511 | 45.4% | 3,460 |
| Cabarrus | 51.7% | 8,096 | 44.3% | 6,931 |
| Caldwell | 47.0% | 2,156 | 45.9% | 2,108 |
| Camden | 54.2% | 468 | 34.5% | 298 |
| Carteret | 48.5% | 2,946 | 44.4% | 2,694 |
| Caswell | 59.8% | 1,701 | 31.1% | 885 |
| Catawba | 51.2% | 5,310 | 44.0% | 4,561 |
| Chatham | 55.0% | 7,406 | 40.9% | 5,510 |
| Cherokee | 43.9% | 1,024 | 43.7% | 1,021 |
| Chowan | 61.8% | 974 | 29.8% | 470 |
| Clay | 52.8% | 487 | 38.5% | 355 |
| Cleveland | 55.9% | 4,880 | 35.6% | 3,104 |
| Columbus | 56.3% | 3,628 | 31.1% | 2,002 |
| Craven | 58.1% | 5,187 | 35.7% | 3,184 |
| Cumberland | 63.9% | 22,744 | 31.0% | 11,052 |
| Currituck | 47.8% | 780 | 43.5% | 710 |
| Dare | 42.5% | 2,003 | 48.9% | 2,307 |
| Davidson | 50.3% | 4,489 | 43.5% | 3,878 |
| Davie | 54.0% | 1,377 | 40.4% | 1,031 |
| Duplin | 61.2% | 3,036 | 29.2% | 1,450 |
| Durham | 57.5% | 35,845 | 41.0% | 25,584 |
| Edgecombe | 70.8% | 6,411 | 22.7% | 2,058 |
| Forsyth | 58.0% | 24,446 | 39.8% | 16,779 |
| Franklin | 59.4% | 4,951 | 34.3% | 2,858 |
| Gaston | 54.1% | 7,697 | 40.3% | 5,738 |
| Gates | 61.7% | 749 | 29.3% | 356 |
| Graham | 44.3% | 321 | 40.7% | 295 |
| Granville | 58.8% | 4,693 | 34.0% | 2,715 |
| Greene | 58.7% | 1,643 | 29.4% | 822 |
| Guilford | 56.0% | 37,880 | 41.7% | 28,204 |
| Halifax | 66.7% | 6,224 | 24.8% | 2,313 |
| Harnett | 55.1% | 4,655 | 36.8% | 3,111 |
| Haywood | 44.5% | 3,748 | 46.0% | 3,873 |
| Henderson | 47.0% | 4,811 | 50.1% | 5,129 |
| Hertford | 67.5% | 2,926 | 22.2% | 961 |
| Hoke | 59.7% | 3,528 | 31.1% | 1,837 |
| Hyde | 48.0% | 459 | 40.5% | 388 |
| Iredell | 50.9% | 5,888 | 43.2% | 4,998 |
| Jackson | 38.1% | 2,022 | 57.0% | 3,021 |
| Johnston | 52.1% | 7,992 | 40.5% | 6,223 |
| Jones | 58.0% | 910 | 32.0% | 501 |
| Lee | 54.6% | 3,224 | 38.1% | 2,248 |
| Lenoir | 64.1% | 4,731 | 26.4% | 1,947 |
| Lincoln | 51.3% | 2,812 | 41.8% | 2,291 |
| Macon | 47.9% | 1,548 | 44.2% | 1,428 |
| Madison | 34.5% | 1,201 | 58.7% | 2,044 |
| Martin | 61.8% | 2,469 | 27.4% | 1,097 |
| McDowell | 40.9% | 1,353 | 49.0% | 1,622 |
| Mecklenburg | 60.3% | 71,265 | 38.3% | 45,224 |
| Mitchell | 40.4% | 314 | 57.9% | 450 |
| Montgomery | 54.9% | 1,366 | 35.5% | 885 |
| Moore | 58.8% | 4,679 | 37.0% | 2,948 |
| Nash | 65.8% | 8,554 | 28.2% | 3,664 |
| New Hanover | 48.4% | 12,240 | 48.6% | 12,276 |
| Northampton | 68.4% | 3,195 | 22.9% | 1,067 |
| Onslow | 54.2% | 4,560 | 38.2% | 3,213 |
| Orange | 48.4% | 17,546 | 49.9% | 18,096 |
| Pamlico | 53.0% | 922 | 38.9% | 676 |
| Pasquotank | 65.2% | 2,471 | 29.8% | 1,128 |
| Pender | 56.4% | 2,880 | 36.8% | 1,880 |
| Perquimans | 51.4% | 711 | 34.8% | 481 |
| Person | 51.0% | 2,954 | 37.1% | 2,150 |
| Pitt | 57.0% | 11,856 | 36.3% | 7,548 |
| Polk | 47.7% | 1,099 | 48.7% | 1,123 |
| Randolph | 46.6% | 2,969 | 45.8% | 2,914 |
| Richmond | 57.1% | 2,941 | 31.0% | 1,595 |
| Robeson | 51.0% | 8,457 | 31.4% | 5,206 |
| Rockingham | 54.4% | 4,464 | 36.5% | 3,000 |
| Rowan | 52.7% | 5,031 | 41.6% | 3,969 |
| Rutherford | 46.0% | 2,382 | 44.5% | 2,306 |
| Sampson | 65.7% | 3,790 | 26.9% | 1,554 |
| Scotland | 63.0% | 2,671 | 26.9% | 1,142 |
| Stanly | 49.1% | 2,153 | 41.4% | 1,813 |
| Stokes | 47.8% | 1,433 | 44.0% | 1,319 |
| Surry | 47.5% | 2,380 | 44.0% | 2,204 |
| Swain | 41.0% | 666 | 51.2% | 831 |
| Transylvania | 45.8% | 1,794 | 49.9% | 1,954 |
| Tyrrell | 49.3% | 266 | 36.5% | 197 |
| Union | 55.8% | 7,630 | 40.6% | 5,547 |
| Vance | 64.0% | 4,561 | 28.0% | 1,999 |
| Wake | 53.4% | 77,927 | 44.8% | 65,380 |
| Warren | 70.0% | 2,827 | 24.5% | 988 |
| Washington | 62.1% | 1,374 | 27.0% | 597 |
| Watauga | 29.6% | 2,514 | 68.5% | 5,811 |
| Wayne | 62.5% | 7,546 | 29.5% | 3,564 |
| Wilkes | 50.4% | 2,107 | 42.6% | 1,783 |
| Wilson | 64.2% | 6,408 | 29.4% | 2,935 |
| Yadkin | 48.0% | 832 | 45.2% | 783 |
| Yancey | 40.5% | 1,134 | 49.5% | 1,386 |
| Total | 54.6% | 616,383 | 40.8% | 460,316 |
Analysis
After North Carolina had sealed the deal on Clinton's dying 2008 presidential effort eight years prior by handing a double-digit win to Barack Obama, Hillary Clinton managed a commanding 13-percentage-point-victory in North Carolina over Bernie Sanders in 2016. Clinton won both men 48-47, and women 59-37; she won both married and unmarried women voters in the state. While Sanders won 59–40 with younger voters, and 52-43 with white voters, Clinton won 64–30 with older voters and 80-19 with African American voters. Clinton swept all educational attainment levels and all income levels except those who made between $50k and $100k per year. Clinton won Democrats 65-34, but lost Independents 58-34 to Sanders. Clinton won among liberals, moderates, and conservatives in the Old North State.
Clinton won in urban, Suburban, and rural areas of the state. She won Raleigh-Durham 55-42, the Charlotte area 60-39, Piedmont and central North Carolina 60-31, and Eastern North Carolina 58-34. Sanders performed strongly in Western North Carolina, which is whiter, conservative, more rural and considered to be part of Appalachia, winning 52–44. Outside of the western part of the state, Sanders won only three counties: New Hanover, home to Wilmington; the state's eighth most populated city, Dare, and Orange, the latter of which is home to the University of North Carolina at Chapel Hill.
References
- ↑ "Midwestern States a Toss Up Tuesday" (PDF).
- ↑
- ↑
- ↑
- ↑
- ↑ SurveyUSA
- ↑ "Trump, Clinton Continue To Lead By Double Digits in NC" (PDF).
- ↑ High Point University. "HPU Poll: Clinton Leads Democratic Primary; Trump, Cruz and Rubio Have Most GOP Support". High Point University.
- ↑ "Trump Keeps Gaining in NC; Clinton Maintains Huge Lead" (PDF). Public Policy Polling. 20 January 2016. Retrieved 22 January 2016.
- ↑ Dowdy, Demi (27 January 2016). "Civitas Poll: Clinton Maintains Strong Lead among NC Democrats". Civitas Institute. Retrieved 5 February 2016.
- ↑ "PPP NC poll" (PDF).
- ↑ "Presidential Primary Poll October 29 – November 2, 2015" (PDF). Elon University. Retrieved 22 January 2016.
- ↑ "Clinton rising in North Carolina; Trump still leads" (PDF). Public Policy Polling. 27 October 2015. Retrieved 22 January 2016.
- ↑ "Trump Steady in North Carolina; Biden Polls Well" (PDF). www.publicpolicypolling.com. Retrieved 2015-09-30.
- ↑ "Elon University Presidential Primary Poll September 17–21, 2015" (PDF). www.elon.edu. Retrieved 2015-09-24.
- ↑ "Trump Continues to Grow in North Carolina; Dem Race Steady" (PDF). www.publicpolicypolling.com. Retrieved 2015-08-20.
- ↑ "PPP NC" (PDF). publicpolicypolling.com. Retrieved 2015-07-09.
- ↑ "2016 Election Center". CNN. Retrieved June 4, 2018.