Results of the United Kingdom Alternative Vote referendum, 2011
| United Kingdom Alternative Vote referendum | ||||||||||||||||||||||
|---|---|---|---|---|---|---|---|---|---|---|---|---|---|---|---|---|---|---|---|---|---|---|
| At present, the UK uses the "first past the post" system to elect MPs to the House of Commons. Should the "alternative vote" system be used instead? | ||||||||||||||||||||||
| Location | United Kingdom | |||||||||||||||||||||
| Date | 5 May 2011 | |||||||||||||||||||||
| ||||||||||||||||||||||
| ||||||||||||||||||||||
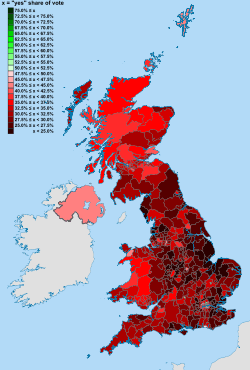
In the United Kingdom, the Alternative Vote referendum also known as the UK-wide referendum on the Parliamentary voting system was a referendum that took place on 5 May 2011, on whether to change the system for electing the House of Commons, the lower house of the national Parliament at Westminster. In the result of a Yes vote, future United Kingdom general elections would have used the "Alternative Vote" (AV); in the event of a No vote, the voting system would remain the same, with the UK continuing to use the "First Past the Post" (FPTP) voting system. The votes cast in the referendum were first counted in each of 440 districts or electoral divisions across the country (the "local counting areas"),[1] which were then combined and declared at a regional level (the regions being the constituent countries of Wales, Scotland and Northern Ireland, and the regions of England).
Under the provisions of the Parliamentary Voting System and Constituencies Act 2011 there was a total of 440 voting areas across twelve regions using the same boundaries as used in European Parliamentary elections since 1999 under the provisions of the European Parliamentary Elections Act 2002 with the exception of Gibraltar which did not participate in the referendum. In England the 326 local government districts were used as the voting areas; these consist of all unitary authorities, all metropolitan boroughs, all shire districts, the London boroughs, the City of London and the Isles of Scilly. As the date of the plebiscite coincided with elections to the Scottish Parliament, Welsh Assembly and the Northern Ireland Assembly different arrangements were required for the devolved nations so in Scotland the 73 Scottish Parliamentary constituencies were used as the Scottish counting areas and in Wales the 40 Welsh assembly constituencies were used as the Welsh counting areas and Northern Ireland was a single counting area.
Ballots were due to be verified by 1pm on 6 May 2011 and the votes were counted from 4pm onwards.[2] Both the local and regional results were updated live online via aboutmyvote.co.uk, a publicly accessible website run by the Electoral Commission.[3]
This article lists, by voting area, all the results of the referendum, each ordered into national and regional sections.
United Kingdom
The national result for the whole United Kingdom was announced at the Platinum Suite at the Exhibition Centre London (ExCel)[4] by the Chief counting officer (CCO) and Chair of the Electoral Commission, Jenny Watson, at 01:00 BST on Saturday 7 May 2011 after all 440 voting areas and UK regions had declared their results.[5] With a national turnout of 42% the target to secure the majority win for the winning side was 9,639,512 votes. The decision by the electorate was a decisive "No" vote to adopting the alternative vote system in all future United Kingdom general elections by a majority of 6,860,516 votes over those who had voted "Yes" in favor of the proposal.
| Choice | Votes | % |
|---|---|---|
| 13,013,123 | 67.90 | |
| Yes | 6,152,607 | 32.10 |
| Valid votes | 19,165,730 | 99.41 |
| Invalid or blank votes | 113,292 | 0.59 |
| Total votes | 19,279,022 | 100.00 |
| Registered voters and turnout | 45,684,501 | 42.20 |
| Source: Electoral Commission | ||
| Yes: 6,152,607 (32.1%) |
No: 13,013,123 (67.9%) | ||
| ▲ | |||
Results by United Kingdom regions
| Region | Electorate | Voter turnout, of eligible |
Votes | Proportion of votes | |||
|---|---|---|---|---|---|---|---|
| Yes | No | Yes | No | ||||
| East Midlands | 3,348,469 | 42.8% | 408,877 | 1,013,864 | 28.74% | 71.26% | |
| East of England | 4,263,006 | 43.1% | 530,140 | 1,298,004 | 29.00% | 71.00% | |
| Greater London | 5,258,802 | 35.4% | 734,427 | 1,123,480 | 39.53% | 60.47% | |
| North East England | 1,968,137 | 38.8% | 212,951 | 546,138 | 28.05% | 71.95% | |
| North West England | 5,239,323 | 39.1% | 613,249 | 1,416,201 | 30.22% | 69.78% | |
| Northern Ireland | 1,198,966 | 55.8% | 289,088 | 372,706 | 43.68% | 56.32% | |
| Scotland | 3,893,268 | 50.7% | 713,813 | 1,249,375 | 36.36% | 63.64% | |
| South East England | 6,288,366 | 43.1% | 823,793 | 1,951,793 | 29.68% | 70.32% | |
| South West England | 4,028,829 | 44.6% | 564,541 | 1,225,305 | 31.54% | 68.46% | |
| Wales | 2,268,739 | 41.7% | 325,349 | 616,307 | 34.55% | 65.45% | |
| West Midlands | 4,093,521 | 39.8% | 461,847 | 1,157,772 | 28.52% | 71.48% | |
| Yorkshire and the Humber | 3,835,075 | 39.9% | 474,532 | 1,042,178 | 28.52% | 68.71% | |
Results by United Kingdom constituent countries
| Country | Electorate | Voter turnout, of eligible |
Votes | Proportion of votes | |||
|---|---|---|---|---|---|---|---|
| Yes | No | Yes | No | ||||
| England | 38,323,528 | 40.7% | 4,786,532 | 10,724,067 | 30.86% | 69.14% | |
| Northern Ireland | 1,198,966 | 55.8% | 289,088 | 372,306 | 43.68% | 56.32% | |
| Scotland | 3,893,269 | 50.7% | 713,813 | 1,249,375 | 36.36% | 63.64% | |
| Wales | 2,268,739 | 41.7% | 325,349 | 616,307 | 34.55% | 65.45% | |
Local results
Of the 440 voting areas, ten returned a majority in favour of the change (Cambridge, Oxford, Glasgow Kelvin, Edinburgh Central, and the London Boroughs of Hackney, Islington, Haringey, Lambeth, Southwark and Camden). The counting area with the highest proportion of AV supporters was the London Borough of Hackney with 60.68% in favour of the change (34.23% turnout) and the lowest proportion was the borough of Castle Point, Essex with 20.29% in favour (41.38% turnout).
England
The English local districts were used as the voting areas for the referendum in England; these consist of all unitary authorities, all metropolitan boroughs, all shire districts, the London boroughs, the City of London and the Isles of Scilly.
The English Regions were also then used to count the votes at the regional level meaning there was no single national count of the votes. All nine regions in England returned huge "No" votes.
United Kingdom Alternative Vote referendum, 2011 England | |||
| Choice | Votes | % | |
|---|---|---|---|
| No | 10,724,067 | 69.14% | |
| Yes | 4,786,352 | 30.86% | |
| Valid votes | 15,510,419 | 99.39% | |
| Invalid or blank votes | 95,322 | 0.61% | |
| Total votes | 15,605,741 | 100.00 % | |
| Registered voters and turnout | 38,323,528 | 40.72% | |
| Yes: 4,786,352 (30.9%) |
No: 10,724,067 (69.1%) | ||
| ▲ | |||
East Midlands

Colours:
United Kingdom Alternative Vote referendum, 2011 East Midlands | |||
| Choice | Votes | % | |
|---|---|---|---|
| No | 1,013,864 | 71.26% | |
| Yes | 408,877 | 28.74% | |
| Valid votes | 1,422,741 | 99.34% | |
| Invalid or blank votes | 9,496 | 0.66% | |
| Total votes | 1,432,237 | 100.00 % | |
| Registered voters and turnout | 3,348,469 | 42.77% | |
| Yes: 408,877 (28.3%) |
No: 1,013,864 (71.3%) | ||
| ▲ | |||
The East Midlands region was broken down into 40 voting areas.
| Counting Area | Turnout % | No votes | Yes votes | No % | Yes % |
|---|---|---|---|---|---|
| Amber Valley | 43.86 | 29,745 | 12,432 | 70.52 | 29.48 |
| Ashfield | 38.87 | 25,693 | 9,149 | 73.74 | 26.26 |
| Bassetlaw | 41.72 | 26,441 | 8,757 | 75.12 | 24.88 |
| Blaby | 41.97 | 22,388 | 7,862 | 74.01 | 25.99 |
| Bolsover | 39.76 | 16,815 | 5,890 | 74.06 | 25.94 |
| Boston | 39.58 | 13,337 | 3,958 | 77.11 | 22.89 |
| Broxtowe | 48.36 | 27,840 | 12,703 | 68.67 | 31.33 |
| Charnwood | 42.52 | 28,902 | 16,114 | 70.71 | 29.29 |
| Chesterfield | 42.87 | 24,190 | 10,335 | 70.07 | 29.93 |
| Corby | 43.01 | 12,933 | 5,078 | 71.81 | 28.19 |
| Daventry | 45.95 | 20,305 | 6,699 | 75.19 | 24.81 |
| Derby | 39.50 | 47,622 | 20,502 | 69.90 | 30.10 |
| Derbyshire Dales | 52.22 | 20,893 | 8,795 | 70.38 | 29.62 |
| East Lindsey | 42.60 | 34,045 | 10,571 | 76.31 | 23.69 |
| East Northamptonshire | 43.85 | 21,596 | 6,935 | 75.69 | 24.31 |
| Erewash | 43.04 | 26,863 | 9,255 | 74.38 | 25.62 |
| Gedling | 44.90 | 27,745 | 11,089 | 71.45 | 28.55 |
| High Peak | 44.40 | 21,569 | 10,443 | 67.38 | 32.62 |
| Harborough | 48.23 | 23,577 | 8,156 | 74.30 | 25.70 |
| Hinckley and Bosworth | 44.10 | 26,771 | 9,642 | 73.52 | 26.48 |
| Kettering | 42.90 | 22,174 | 7,500 | 74.73 | 25.27 |
| Leicester | 41.79 | 50,678 | 38,005 | 57.15 | 42.85 |
| Lincoln | 36.68 | 16,099 | 6,951 | 69.84 | 30.16 |
| Mansfield | 38.09 | 21,610 | 8,474 | 71.83 | 28.17 |
| Melton | 44.69 | 12,563 | 4,590 | 73.24 | 26.76 |
| Newark and Sherwood | 45.05 | 27,621 | 10,211 | 73.01 | 26.99 |
| North East Derbyshire | 42.82 | 24,576 | 8,624 | 74.02 | 25.98 |
| Northampton | 39.68 | 41,065 | 17,651 | 69.94 | 30.06 |
| North Kesteven | 42.95 | 27,397 | 7,926 | 77.56 | 22.44 |
| North West Leicestershire | 45.46 | 24,780 | 7,575 | 76.59 | 23.41 |
| Nottingham | 35.76 | 42,853 | 25,564 | 62.64 | 37.36 |
| Oadby and Wigston | 43.25 | 13,523 | 5,600 | 70.72 | 29.28 |
| Rushcliffe | 51.80 | 29,739 | 14,083 | 67.86 | 32.14 |
| Rutland | 49.27 | 10,048 | 3,809 | 72.51 | 27.49 |
| South Derbyshire | 43.57 | 23,323 | 7,463 | 75.76 | 24.24 |
| South Holland | 39.83 | 20,542 | 5,603 | 78.57 | 21.43 |
| South Kesteven | 42.63 | 32,217 | 11,247 | 74.12 | 25.88 |
| South Northamptonshire | 48.01 | 22,860 | 9,064 | 71.61 | 28.39 |
| Wellingborough | 45.70 | 18,044 | 6,349 | 73.97 | 26.03 |
| West Lindsey | 43.70 | 22,882 | 8,223 | 73.56 | 26.44 |
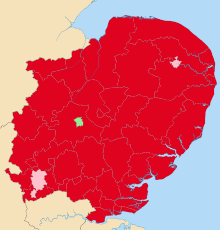
East of England
Colours:
United Kingdom Alternative Vote referendum, 2011 East of England | |||
| Choice | Votes | % | |
|---|---|---|---|
| No | 1,829,362 | 71.00% | |
| Yes | 530,140 | 29.00% | |
| Valid votes | 1,828,144 | 99.39% | |
| Invalid or blank votes | 11,218 | 0.61% | |
| Total votes | 1,4839,362 | 100.00 % | |
| Registered voters and turnout | 4,263,006 | 43.15% | |
| Yes: 530,140 (29.0%%) |
No: 1,298,004 (71.0%) | ||
| ▲ | |||
The East of England region was broken down into 47 voting areas.
| Counting Area | Turnout % | No votes | Yes votes | No % | Yes % |
|---|---|---|---|---|---|
| Babergh | 43.46 | 20,332 | 9,696 | 67.71 | 32.29 |
| Basildon | 35.11 | 34,097 | 10,461 | 76.52 | 23.48 |
| Bedford | 47.04 | 36,421 | 16,184 | 69.23 | 30.77 |
| Braintree | 42.96 | 34,788 | 11,501 | 75.15 | 24.85 |
| Breckland | 42.33 | 29,920 | 9,793 | 75.34 | 24.66 |
| Brentwood | 46.29 | 19,381 | 6,177 | 75.83 | 24.17 |
| Broadland | 46.88 | 32,607 | 12,073 | 72.98 | 27.02 |
| Broxbourne | 36.33 | 19,386 | 4,988 | 79.54 | 20.46 |
| Cambridge | 48.43 | 17,871 | 21,253 | 45.68 | 54.32 |
| Castle Point | 41.38 | 21,012 | 5,348 | 79.71 | 20.29 |
| Central Bedfordshire | 42.02 | 58,496 | 21,774 | 72.87 | 27.13 |
| Chelmsford | 44.42 | 39,829 | 15,934 | 71.43 | 28.57 |
| Colchester | 42.11 | 34,293 | 17,809 | 65.82 | 34.18 |
| Dacorum | 44.96 | 33,295 | 14,438 | 69.75 | 30.25 |
| East Cambridgeshire | 43.93 | 18,365 | 8,262 | 68.97 | 31.03 |
| East Hertfordshire | 45.24 | 33,478 | 12,716 | 72.47 | 27.53 |
| Epping Forest | 38.39 | 28,240 | 8,533 | 76.80 | 23.20 |
| Fenland | 38.83 | 21,087 | 6,336 | 76.90 | 23.10 |
| Forest Heath | 37.71 | 10,757 | 3,327 | 76.38 | 23.62 |
| Great Yarmouth | 36.58 | 19,207 | 6,325 | 75.23 | 24.77 |
| Harlow | 37.36 | 16,226 | 5,823 | 73.59 | 26.41 |
| Hertsmere | 39.95 | 22,005 | 6,772 | 76.47 | 23.53 |
| Huntingdonshire | 44.45 | 38,725 | 15,145 | 71.89 | 28.11 |
| Ipswich | 39.24 | 25,195 | 10,859 | 69.88 | 30.12 |
| King's Lynn and West Norfolk | 42.58 | 35,996 | 11,652 | 75.55 | 24.45 |
| Luton | 39.45 | 34,980 | 16,002 | 68.61 | 31.39 |
| Maldon | 43.20 | 15,735 | 4,987 | 75.93 | 24.07 |
| Mid Suffolk | 47.95 | 25,828 | 10,177 | 71.73 | 28.27 |
| North Hertfordshire | 45.94 | 30,410 | 13,592 | 69.11 | 30.89 |
| North Norfolk | 50.09 | 28,555 | 11,799 | 70.76 | 29.24 |
| Norwich | 40.88 | 21,582 | 18,231 | 54.52 | 45.48 |
| Peterborough | 41.18 | 32,878 | 15,534 | 67.91 | 32.09 |
| Rochford | 40.89 | 20,931 | 5,542 | 79.07 | 20.93 |
| South Cambridgeshire | 49.29 | 34,594 | 18,351 | 65.34 | 34.66 |
| Southend-on-Sea | 38.33 | 34,365 | 13,488 | 71.81 | 28.19 |
| South Norfolk | 47.23 | 32,400 | 13,332 | 70.85 | 29.15 |
| St Albans | 51.90 | 33,443 | 18,934 | 63.85 | 36.15 |
| St Edmundsbury | 42.68 | 24,607 | 9,789 | 71.54 | 28.46 |
| Stevenage | 41.64 | 17,927 | 7,311 | 71.03 | 28.97 |
| Suffolk Coastal | 49.77 | 33,524 | 13,452 | 71.36 | 28.64 |
| Tendring | 43.89 | 33,363 | 13,627 | 71.00 | 29.00 |
| Three Rivers | 44.14 | 20,779 | 7,985 | 72.24 | 27.76 |
| Thurrock | 34.59 | 28,284 | 9,307 | 75.24 | 24.76 |
| Uttlesford | 49.19 | 21,595 | 7,624 | 73.91 | 26.09 |
| Watford | 41.69 | 16,814 | 9,259 | 64.49 | 35.51 |
| Waveney | 43.11 | 28,162 | 10,035 | 73.73 | 26.27 |
| Welwyn Hatfield | 42.74 | 23,482 | 8,876 | 72.57 | 27.43 |
Greater London

Colours:
United Kingdom Alternative Vote referendum, 2011 Greater London | |||
| Choice | Votes | % | |
|---|---|---|---|
| No | 1,123,480 | 60.47% | |
| Yes | 734,427 | 39.53% | |
| Valid votes | 1,857,907 | 99.75% | |
| Invalid or blank votes | 4,561 | 0.25% | |
| Total votes | 1,862,468 | 100.00 % | |
| Registered voters and turnout | 5,258,802 | 35.37% | |
| Yes: 734,427 (39.5%%) |
No: 1,123,470 (60.5%) | ||
| ▲ | |||
The London region was broken down into 33 voting areas.
| Counting Area | Turnout % | No votes | Yes votes | No % | Yes % |
|---|---|---|---|---|---|
| Barking and Dagenham[6] | 27.77 | 22,338 | 9,436 | 70.30 | 29.70 |
| Barnet | 38.91 | 55,451 | 30,153 | 64.78 | 35.22 |
| Bexley[7] | 37.48 | 48,630 | 14,929 | 76.51 | 23.49 |
| Brent | 29.68 | 30,941 | 25,551 | 54.77 | 45.23 |
| Bromley | 41.28 | 67,671 | 27,286 | 71.26 | 28.74 |
| Camden | 37.41 | 24,845 | 26,275 | 48.60 | 51.40 |
| City of London | 42.65 | 1,384 | 1,196 | 53.64 | 46.36 |
| City of Westminster | 31.53 | 24,805 | 15,279 | 61.88 | 38.12 |
| Croydon | 35.90 | 58,475 | 28,789 | 67.01 | 32.99 |
| Ealing | 36.21 | 42,565 | 32,445 | 56.75 | 43.25 |
| Enfield | 35.43 | 45,721 | 23,521 | 66.03 | 33.97 |
| Greenwich | 33.26 | 32,039 | 20,618 | 60.84 | 39.16 |
| Hackney | 34.23 | 20,064 | 30,969 | 39.32 | 60.68 |
| Haringey | 35.70 | 23,223 | 30,310 | 43.38 | 56.62 |
| Harrow | 37.94 | 40,993 | 20,990 | 66.14 | 33.86 |
| Hammersmith and Fulham | 37.85 | 24,380 | 16,889 | 59.08 | 40.92 |
| Havering | 35.92 | 49,691 | 14,592 | 77.30 | 22.70 |
| Hillingdon | 34.10 | 45,535 | 18,888 | 70.68 | 29.32 |
| Hounslow | 32.83 | 32,550 | 20,953 | 60.84 | 39.16 |
| Islington | 35.80 | 20,851 | 27,553 | 43.08 | 56.92 |
| Kensington and Chelsea | 34.40 | 20,332 | 9,696 | 67.71 | 32.29 |
| Kingston upon Thames | 42.81 | 27,945 | 18,230 | 60.52 | 39.48 |
| Lambeth | 33.16 | 28,758 | 34,712 | 45.31 | 54.69 |
| Lewisham | 33.20 | 28,929 | 28,184 | 50.65 | 49.35 |
| Merton | 39.83 | 33,573 | 18,375 | 64.63 | 35.37 |
| Newham | 27.16 | 27,169 | 21,085 | 56.30 | 43.70 |
| Redbridge | 32.92 | 42,717 | 20,524 | 67.55 | 32.45 |
| Richmond upon Thames | 47.15 | 35,768 | 24,796 | 59.06 | 40.94 |
| Southwark | 34.43 | 29,304 | 32,695 | 47.27 | 52.73 |
| Sutton | 38.90 | 35,003 | 16,930 | 67.40 | 32.60 |
| Tower Hamlets | 28.86 | 23,975 | 20,286 | 54.17 | 45.83 |
| Waltham Forest | 33.83 | 31,118 | 22,140 | 58.43 | 41.57 |
| Wandsworth | 37.07 | 46,737 | 30,152 | 60.79 | 39.21 |
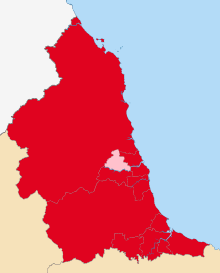
North East England
Colours:
United Kingdom Alternative Vote referendum, 2011 North East England | |||
| Choice | Votes | % | |
|---|---|---|---|
| No | 546,138 | 71.95% | |
| Yes | 212,951 | 28.05% | |
| Valid votes | 759,089 | 99.58% | |
| Invalid or blank votes | 3,214 | 0.42% | |
| Total votes | 762,303 | 100.00 % | |
| Registered voters and turnout | 1,968,137 | 38.73% | |
| Yes: 212,951 (28.0%%) |
No: 546,138 (72.0%) | ||
| ▲ | |||
The North East England region was broken down into 12 voting areas.
| Counting Area | Turnout % | No votes | Yes votes | No % | Yes % |
|---|---|---|---|---|---|
| Darlington | 41.47 | 23,096 | 9,134 | 71.66 | 28.34 |
| Durham | 34.95 | 100,203 | 40,435 | 71.25 | 28.75 |
| Gateshead | 41.28 | 44,366 | 16,214 | 73.24 | 26.76 |
| Hartlepool | 31.45 | 16,685 | 4,998 | 76.95 | 23.05 |
| Middlesbrough | 35.69 | 25,721 | 10,416 | 71.18 | 28.82 |
| Newcastle upon Tyne | 40.93 | 51,484 | 28,766 | 64.15 | 35.85 |
| North Tyneside | 41.82 | 48,078 | 16,296 | 74.69 | 25.31 |
| Northumberland | 40.78 | 72,500 | 27,252 | 72.68 | 27.32 |
| Redcar and Cleveland | 41.41 | 31,859 | 11,554 | 73.39 | 26.61 |
| South Tyneside | 39.13 | 31,991 | 12,533 | 71.85 | 28.15 |
| Stockton-on-Tees | 38.71 | 40,763 | 13,877 | 74.60 | 25.40 |
| Sunderland | 37.64 | 59,392 | 21,476 | 73.44 | 26.56 |
North West England

Colours:
United Kingdom Alternative Vote referendum, 2011 North West England | |||
| Choice | Votes | % | |
|---|---|---|---|
| No | 1,416,201 | 69.78% | |
| Yes | 613,249 | 30.22% | |
| Valid votes | 2,029,450 | 99.06% | |
| Invalid or blank votes | 19,273 | 0.94% | |
| Total votes | 2,048,723 | 100.00% | |
| Registered voters and turnout | 5,239,323 | 39.10% | |
| Yes: 613,249 (30.2%%) |
No: 1,416,201 (69.8%) | ||
| ▲ | |||
The North West England region was broken down into 39 voting areas.
| Counting Area | Turnout % | No votes | Yes votes | No % | Yes % |
|---|---|---|---|---|---|
| Allerdale | 45.25 | 24,533 | 8,354 | 74.60 | 25.40 |
| Barrow-in-Furness | 36.00 | 14,383 | 4,561 | 75.92 | 24.08 |
| Blackburn with Darwen | 43.26 | 29,787 | 11,393 | 72.33 | 27.67 |
| Blackpool | 36.88 | 30,343 | 10,544 | 74.21 | 25.79 |
| Bolton | 38.09 | 53,037 | 20,825 | 71.81 | 28.19 |
| Burnley | 38.84 | 18,822 | 7,037 | 72.79 | 27.21 |
| Bury | 40.28 | 41,878 | 15,625 | 72.83 | 27.17 |
| Carlisle | 39.72 | 22,611 | 10,202 | 68.91 | 31.09 |
| Cheshire East | 43.04 | 88,669 | 33,241 | 72.73 | 27.27 |
| Cheshire West and Chester | 43.11 | 78,450 | 30,322 | 72.12 | 27.88 |
| Chorley | 42.39 | 25,119 | 8,598 | 74.50 | 25.50 |
| Copeland | 41.07 | 16,907 | 5,628 | 75.03 | 24.97 |
| Eden | 45.07 | 13,302 | 5,342 | 71.35 | 28.65 |
| Fylde | 44.62 | 20,727 | 6,413 | 76.37 | 23.63 |
| Halton | 34.18 | 22,432 | 8,763 | 71.91 | 28.09 |
| Hyndburn | 40.35 | 17,891 | 6,167 | 74.37 | 25.63 |
| Knowsley | 33.05 | 24,859 | 11,343 | 68.67 | 31.33 |
| Lancaster | 39.09 | 28,555 | 13,504 | 67.89 | 32.11 |
| Liverpool | 35.92 | 71,739 | 41,035 | 63.61 | 36.39 |
| Manchester | 32.04 | 60,495 | 48,442 | 55.53 | 44.47 |
| Oldham | 38.60 | 42,623 | 17,076 | 71.40 | 28.60 |
| Pendle | 43.69 | 21,565 | 7,077 | 75.29 | 24.71 |
| Preston | 38.44 | 25,218 | 11,413 | 68.84 | 31.16 |
| Ribble Valley | 44.93 | 15,138 | 4,982 | 75.24 | 24.76 |
| Rochdale | 36.30 | 40,146 | 16,390 | 71.01 | 28.99 |
| Rossendale | 38.17 | 14,480 | 5,361 | 72.98 | 27.02 |
| Salford | 33.15 | 37,373 | 16,601 | 69.24 | 30.76 |
| Sefton | 39.22 | 57,289 | 23,925 | 70.54 | 29.46 |
| South Lakeland | 50.28 | 27,781 | 13,412 | 67.44 | 32.56 |
| South Ribble | 40.16 | 25,582 | 8,845 | 74.31 | 25.69 |
| St Helens | 37.96 | 36,753 | 14,682 | 71.46 | 28.54 |
| Stockport | 41.64 | 59,937 | 29,930 | 66.70 | 33.30 |
| Tameside | 36.00 | 43,187 | 16,516 | 72.34 | 27.66 |
| Trafford | 42.73 | 48,602 | 22,687 | 68.18 | 31.82 |
| Warrington | 39.39 | 40,442 | 19,134 | 67.88 | 32.12 |
| West Lancashire | 39.83 | 24,804 | 9,288 | 72.76 | 27.24 |
| Wigan | 33.55 | 48,793 | 31,201 | 61.00 | 39.00 |
| Wirral | 43.16 | 73,120 | 28,627 | 71.86 | 28.14 |
| Wyre | 44.26 | 28,829 | 8,763 | 76.69 | 23.31 |
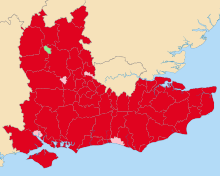
South East England
Colours:
United Kingdom Alternative Vote referendum, 2011 South East England | |||
| Choice | Votes | % | |
|---|---|---|---|
| No | 1,951,793 | 70.32% | |
| Yes | 823,793 | 29.68% | |
| Valid votes | 2,775,586 | 99.55% | |
| Invalid or blank votes | 12,594 | 0.45% | |
| Total votes | 2,788,180 | 100.00 % | |
| Registered voters and turnout | 6,288,366 | 43.15% | |
| Yes: 823,793 (29.7%%) |
No: 1,951,793 (70.3%) | ||
| ▲ | |||
The South East England region was broken down into 67 voting areas.
| Counting Area | Turnout % | No votes | Yes votes | No % | Yes % |
|---|---|---|---|---|---|
| Adur | 39.84 | 13,412 | 5,357 | 71.46 | 28.54 |
| Arun | 44.70 | 37,536 | 11,729 | 76.19 | 23.81 |
| Ashford | 45.02 | 28,132 | 10,349 | 73.11 | 26.89 |
| Aylesbury Vale | 45.74 | 41,096 | 17,777 | 69.80 | 30.20 |
| Basingstoke and Deane | 43.60 | 38,681 | 14,837 | 72.28 | 27.72 |
| Bracknell Forest | 41.20 | 24,001 | 9,677 | 71.27 | 28.73 |
| Brighton and Hove | 45.18 | 44.198 | 43,948 | 50.14 | 49.86 |
| Canterbury | 44.43 | 30,759 | 15,398 | 66.64 | 33.36 |
| Cherwell | 43.53 | 30,925 | 12,944 | 70.49 | 29.51 |
| Chichester | 46.44 | 30,549 | 10,856 | 73.78 | 26.22 |
| Chiltern | 51.67 | 27,331 | 8,933 | 75.37 | 24.63 |
| Crawley | 39.41 | 20,275 | 7,993 | 71.72 | 28.28 |
| Dartford | 41.43 | 21,397 | 7,256 | 74.68 | 25.32 |
| Dover | 45.23 | 27,386 | 9,897 | 73.45 | 26.55 |
| Eastbourne | 44.63 | 21,920 | 9,565 | 69.62 | 30.38 |
| East Hampshire | 48.30 | 31,550 | 11,259 | 73.70 | 26.30 |
| Eastleigh | 44.05 | 28,644 | 12,796 | 69.12 | 30.88 |
| Elmbridge | 43.92 | 30,930 | 11,200 | 73.42 | 26.58 |
| Epsom and Ewell | 46.11 | 17,741 | 7,240 | 71.02 | 28.98 |
| Fareham | 45.36 | 29,874 | 9,825 | 75.25 | 24.75 |
| Gosport | 37.71 | 17,546 | 5,321 | 76.73 | 23.27 |
| Gravesham | 43.59 | 22,023 | 8,266 | 72.71 | 27.29 |
| Guildford | 48.37 | 33,351 | 14,982 | 69.00 | 31.00 |
| Hart | 46.56 | 21,873 | 9,817 | 69.02 | 30.98 |
| Hastings | 36.78 | 15,277 | 7,349 | 67.52 | 32.48 |
| Havant | 38.91 | 27,614 | 8,241 | 77.02 | 22.98 |
| Horsham | 47.94 | 33,878 | 15,039 | 69.26 | 30.74 |
| Isle of Wight | 40.07 | 32,841 | 11,311 | 74.38 | 25.62 |
| Lewes | 49.18 | 23,738 | 12,531 | 65.45 | 34.55 |
| Maidstone | 42.39 | 35,133 | 12,214 | 74.19 | 25.81 |
| Medway | 39.76 | 54,540 | 18,817 | 74.35 | 25.65 |
| Mid Sussex | 47.88 | 33,704 | 15,659 | 68.28 | 31.72 |
| Milton Keynes | 41.23 | 46,646 | 21,773 | 68.18 | 31.82 |
| Mole Valley | 53.02 | 24,748 | 9,541 | 72.17 | 27.83 |
| New Forest | 44.78 | 47,732 | 16,135 | 74.74 | 25.26 |
| Oxford | 37.90 | 18,395 | 21,693 | 45.89 | 54.11 |
| Portsmouth | 35.96 | 34,490 | 16,577 | 67.54 | 34.46 |
| Reading | 41.20 | 27,571 | 17,605 | 61.03 | 38.97 |
| Reigate and Banstead | 43.25 | 30,827 | 11,891 | 72.16 | 27.84 |
| Rother | 48.24 | 25,167 | 8,718 | 74.27 | 25.73 |
| Runnymede | 39.88 | 16,901 | 6,297 | 72.86 | 27.14 |
| Rushmoor | 38.98 | 17,596 | 7,417 | 70.35 | 29.65 |
| Sevenoaks | 46.32 | 29,850 | 9,849 | 75.19 | 24.81 |
| Shepway | 42.03 | 24,342 | 8,920 | 73.18 | 26.82 |
| Slough | 37.61 | 19,397 | 11,956 | 61.87 | 38.13 |
| South Bucks | 42.86 | 16,503 | 5,001 | 76.74 | 23.26 |
| South Oxfordshire | 48.61 | 33,565 | 14,776 | 69.43 | 30.57 |
| Southampton | 38.06 | 39,257 | 23,062 | 62.99 | 37.01 |
| Spelthorne | 42.07 | 21,873 | 7,687 | 74.00 | 26.00 |
| Surrey Heath | 45.91 | 21,725 | 7,116 | 75.33 | 24.67 |
| Swale | 40.72 | 28,948 | 9,634 | 75.03 | 24.97 |
| Tandridge | 47.63 | 20,572 | 8,286 | 71.29 | 28.71 |
| Test Valley | 48.10 | 29,296 | 13,862 | 67.88 | 32.12 |
| Thanet | 42.17 | 28,613 | 10,168 | 73.78 | 26.22 |
| Tonbridge and Malling | 45.07 | 29,700 | 9,880 | 75.04 | 24.96 |
| Tunbridge Wells | 46.01 | 25,469 | 10,892 | 70.04 | 29.96 |
| Vale of White Horse | 49.16 | 30,507 | 14,737 | 67.43 | 32.57 |
| Waverley | 51.76 | 33,723 | 12,718 | 72.61 | 27.39 |
| Wealden | 47.97 | 40,667 | 14,275 | 74.02 | 25.98 |
| West Berkshire | 48.69 | 39,235 | 15,637 | 71.50 | 28.50 |
| West Oxfordshire | 48.25 | 26,739 | 10,766 | 71.29 | 28.71 |
| Winchester | 54.04 | 32,857 | 15,005 | 68.65 | 31.35 |
| Windsor and Maidenhead | 48.52 | 35,835 | 12,767 | 73.73 | 26.27 |
| Woking | 49.10 | 23,391 | 10,424 | 69.17 | 30.83 |
| Wokingham | 47.32 | 39,232 | 15,968 | 71.07 | 28.93 |
| Worthing | 39.82 | 21,653 | 9,476 | 69.56 | 30.44 |
| Wycombe | 46.23 | 38,872 | 16,965 | 69.62 | 30.38 |
South West England

Colours:
United Kingdom Alternative Vote referendum, 2011 South West England | |||
| Choice | Votes | % | |
|---|---|---|---|
| No | 1,225,305 | 68.48% | |
| Yes | 564,541 | 31.54% | |
| Valid votes | 1,789,846 | 99.59% | |
| Invalid or blank votes | 7,399 | 0.41% | |
| Total votes | 1,797,245 | 100.00 % | |
| Registered voters and turnout | 4,028,829 | 44.61% | |
| Yes: 564,541 (31.5%%) |
No: 1,225,305 (68.5%) | ||
| ▲ | |||
The South West England region was broken down into 37 voting areas.
| Counting Area | Turnout % | No votes | Yes votes | No % | Yes % |
|---|---|---|---|---|---|
| Bath and North East Somerset | 48.94 | 40,471 | 25,042 | 61.78 | 38.22 |
| Bournemouth | 36.19 | 33,468 | 14,030 | 70.46 | 29.54 |
| Bristol | 41.68 | 69,878 | 56,433 | 55.32 | 44.68 |
| Cheltenham | 41.38 | 22,695 | 12,972 | 63.63 | 36.37 |
| Christchurch | 49.66 | 14,729 | 4,492 | 76.63 | 23.37 |
| Cornwall | 40.20 | 117,770 | 51,184 | 69.71 | 30.29 |
| Cotswold | 41.38 | 22,695 | 12,972 | 63.63 | 36.37 |
| East Devon | 50.07 | 36,605 | 14,778 | 71.24 | 28.76 |
| East Dorset | 49.33 | 26,688 | 8,020 | 76.89 | 23.11 |
| Exeter | 43.64 | 22,605 | 14,432 | 61.03 | 38.97 |
| Forest of Dean | 45.72 | 20,758 | 8,727 | 70.40 | 29.60 |
| Gloucester | 39.69 | 24,730 | 9,964 | 71.28 | 28.72 |
| Isles of Scilly | 47.96 | 542 | 288 | 65.30 | 34.70 |
| Mendip | 49.87 | 27,162 | 14,419 | 65.32 | 34.68 |
| Mid Devon | 47.59 | 19,349 | 8,737 | 68.89 | 31.11 |
| North Dorset | 49.29 | 18,371 | 7,342 | 71.45 | 28.55 |
| North Devon | 49.29 | 18,371 | 7,342 | 71.45 | 28.55 |
| North Somerset | 46.07 | 49,101 | 22,473 | 68.60 | 31.40 |
| Plymouth | 38.88 | 49,743 | 20,251 | 71.07 | 28.93 |
| Poole | 42.77 | 34,655 | 13,367 | 72.16 | 27.84 |
| Purbeck | 48.96 | 12,741 | 4,979 | 71.90 | 28.10 |
| Sedgemoor | 41.89 | 25,549 | 11,221 | 69.48 | 30.52 |
| South Gloucestershire | 46.17 | 64,993 | 27,179 | 71.51 | 29.49 |
| South Hams | 51.23 | 23,241 | 11,343 | 67.20 | 32.80 |
| South Somerset | 48.69 | 42,239 | 18,489 | 69.55 | 30.45 |
| Stroud | 48.99 | 28,376 | 15,154 | 65.19 | 34.81 |
| Swindon | 39.20 | 41,286 | 17,803 | 69.87 | 30.13 |
| Taunton Deane | 46.92 | 26,339 | 12,380 | 68.03 | 31.97 |
| Teignbridge | 47.83 | 33,016 | 14,994 | 68.77 | 31.23 |
| Tewkesbury | 45.75 | 21,291 | 8,052 | 72.56 | 27.44 |
| Torbay | 41.52 | 30,428 | 12,156 | 71.45 | 28.55 |
| Torridge | 45.81 | 16,363 | 7,030 | 69.95 | 30.05 |
| West Dorset | 53.28 | 28,391 | 13,688 | 67.47 | 32.53 |
| West Devon | 51.03 | 14,805 | 6,713 | 68.80 | 31.20 |
| West Somerset | 50.71 | 10,503 | 3,671 | 74.10 | 25.90 |
| Wiltshire | 43.30 | 14,961 | 7,048 | 67.98 | 32.02 |
| Weymouth and Portland | 43.30 | 14,961 | 7,048 | 67.98 | 32.02 |
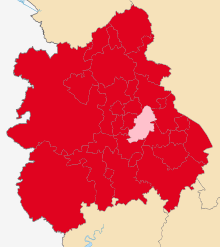
West Midlands
Colours:
United Kingdom Alternative Vote referendum, 2011 West Midlands | |||
| Choice | Votes | % | |
|---|---|---|---|
| No | 1,157,772 | 71.48% | |
| Yes | 461,772 | 28.52% | |
| Valid votes | 1,619,619 | 99.15% | |
| Invalid or blank votes | 13,845 | 0.85% | |
| Total votes | 1,633,464 | 100.00 % | |
| Registered voters and turnout | 4,093,521 | 39.82% | |
| Yes: 461,847 (28.5%%) |
No: 1,157,772 (71.5%) | ||
| ▲ | |||
The West Midlands region was broken down into 30 voting areas.
| Counting Area | Turnout % | No votes | Yes votes | No % | Yes % |
|---|---|---|---|---|---|
| Birmingham | 36.58 | 170,749 | 94,835 | 64.29 | 35.71 |
| Bromsgrove | 44.73 | 24,118 | 8,432 | 74.10 | 25.90 |
| Cannock Chase | 33.06 | 19,151 | 5,621 | 77.31 | 22.69 |
| Coventry | 37.77 | 56,037 | 27,629 | 66.98 | 33.02 |
| Dudley | 38.38 | 70,064 | 21,681 | 76.37 | 23.63 |
| East Staffordshire | 43.83 | 27,155 | 9,129 | 74.84 | 25.16 |
| Herefordshire | 46.24 | 44,448 | 18,665 | 70.43 | 29.57 |
| Lichfield | 42.70 | 25,572 | 7,938 | 76.31 | 23.69 |
| Malvern Hills | 47.76 | 19,617 | 8,368 | 70.10 | 29.90 |
| Newcastle-under-Lyme | 36.18 | 25,644 | 9,473 | 73.02 | 26.98 |
| North Warwickshire | 43.82 | 16,509 | 4,918 | 77.05 | 22.95 |
| Nuneaton and Bedworth | 36.14 | 24,021 | 9,809 | 71.01 | 28.99 |
| Redditch | 37.80 | 17,547 | 6,385 | 73.32 | 26.68 |
| Rugby | 45.02 | 23,574 | 8,733 | 72.97 | 27.03 |
| Sandwell | 35.13 | 54,355 | 21,738 | 71.43 | 28.57 |
| Shropshire | 42.15 | 68,732 | 27,221 | 71.63 | 28.37 |
| Solihull | 41.25 | 50,298 | 1,577 | 76.12 | 23.88 |
| South Staffordshire | 41.27 | 27,769 | 7,349 | 79.07 | 20.93 |
| Stafford | 46.23 | 32,937 | 11,711 | 73.77 | 26.23 |
| Staffordshire Moorlands | 41.81 | 24,504 | 7,749 | 75.97 | 24.03 |
| Stoke-on-Trent | 31.18 | 41,277 | 15,814 | 72.30 | 27.70 |
| Stratford-on-Avon | 50.06 | 34,766 | 11,982 | 74.37 | 25.63 |
| Tamworth | 36.97 | 16,449 | 4,829 | 77.31 | 22.69 |
| Telford and Wrekin | 43.05 | 36,213 | 14,097 | 71.98 | 28.02 |
| Walsall | 37.87 | 52,641 | 18,437 | 74.06 | 25.94 |
| Warwick | 50.31 | 32,210 | 16,371 | 66.30 | 33.70 |
| Wolverhampton | 38.29 | 46,507 | 18,352 | 71.70 | 28.30 |
| Worcester | 40.73 | 20,083 | 9,525 | 67.83 | 32.17 |
| Wychavon | 48.15 | 31,916 | 11,168 | 74.08 | 25.92 |
| Wyre Forest | 36.88 | 22,909 | 8,110 | 73.85 | 26.15 |
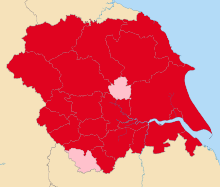
Yorkshire and the Humber
Colours:
United Kingdom Alternative Vote referendum, 2011 Yorkshire and the Humber | |||
| Choice | Votes | % | |
|---|---|---|---|
| No | 1,042,178 | 68.71% | |
| Yes | 474,532 | 31.29% | |
| Valid votes | 1,516,710 | 99.10% | |
| Invalid or blank votes | 13,722 | 0.90% | |
| Total votes | 1,530,432 | 100.00 % | |
| Registered voters and turnout | 3,835,075 | 39.92% | |
| Yes: 474,532 (31.3%%) |
No: 1,042,178 (68.7%) | ||
| ▲ | |||
The Yorkshire and the Humber region was broken down into 21 voting areas.
| Counting Area | Turnout % | No votes | Yes votes | No % | Yes % |
|---|---|---|---|---|---|
| Barnsley | 35.81 | 46,335 | 15,868 | 74.49 | 25.51 |
| Bradford | 40.50 | 87,838 | 42,858 | 67.21 | 32.79 |
| Calderdale | 41.12 | 41,175 | 18,494 | 69.01 | 30.99 |
| Craven | 46.84 | 14,527 | 6,091 | 70.46 | 29.54 |
| Doncaster | 36.80 | 58,726 | 21,179 | 73.49 | 26.51 |
| East Riding of Yorkshire | 42.18 | 82,929 | 29,358 | 73.85 | 26.15 |
| Hambleton | 46.10 | 20,991 | 11,281 | 65.04 | 34.96 |
| Harrogate | 46.55 | 37,998 | 16,179 | 70.14 | 29.86 |
| Kingston upon Hull | 31.91 | 39,554 | 17,475 | 69.36 | 30.64 |
| Kirklees | 42.46 | 85,395 | 42,270 | 66.89 | 33.11 |
| Leeds | 39.06 | 136,632 | 71,506 | 65.64 | 34.36 |
| North East Lincolnshire | 34.23 | 29,484 | 9,549 | 75.54 | 24.46 |
| North Lincolnshire | 39.57 | 36,031 | 12,542 | 74.18 | 25.82 |
| Richmondshire | 46.94 | 12,002 | 4,088 | 74.59 | 25.41 |
| Rotherham | 38.88 | 51,996 | 21,613 | 70.64 | 29.36 |
| Ryedale | 45.58 | 13,987 | 5,042 | 73.50 | 26.50 |
| Scarborough | 39.86 | 23,440 | 10,148 | 69.79 | 30.21 |
| Selby | 44.15 | 20,907 | 7,094 | 74.67 | 25.33 |
| Sheffield | 41.64 | 98,563 | 61,141 | 61.72 | 38.28 |
| Wakefield | 35.50 | 62,531 | 25,766 | 70.81 | 29.19 |
| York | 44.28 | 41,137 | 24,980 | 62.22 | 37.78 |
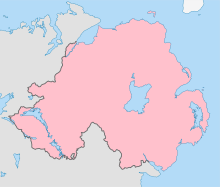
Northern Ireland
Colours:
Northern Ireland was a single voting area, as well as being a regional count for the UK-wide referendum. It was the last region of the United Kingdom to declare its result after major delays due to slow pace of counting and declaring results for the 2011 Northern Ireland Assembly Elections meant that the start of the local count for the referendum could not begin until the evening on Friday 6 May 2011, several hours after counting had started in the rest of the country and the result was not finally known until 1am on Saturday 7 May 2011.[1]
| United Kingdom Alternative Vote referendum, 2011 Northern Ireland | |||
| Choice | Votes | % | |
|---|---|---|---|
| No | 372,306 | 56.32% | |
| Yes | 289,088 | 43.68% | |
| Valid votes | 661,794 | 98.94% | |
| Invalid or blank votes | 7,062 | 1.06% | |
| Total votes | 668,356 | 100.00 % | |
| Registered voters and turnout | 1,198,966 | 55.79% | |
| Yes: 289,088 (43.7%) |
No: 372,306 (56.3%) | ||
| ▲ | |||
Scotland

Colours:
The constituencies of the Scottish Parliament were used as the local voting areas for the UK-wide referendum throughout Scotland.[1]
United Kingdom Alternative Vote referendum, 2011 Scotland | |||
| Choice | Votes | % | |
|---|---|---|---|
| No | 1,249,375 | 63.64% | |
| Yes | 713,813 | 36.36% | |
| Valid votes | 1,963,188 | 99.37% | |
| Invalid or blank votes | 12,370 | 0.63% | |
| Total votes | 1,975,558 | 100.00 % | |
| Registered voters and turnout | 3,893,268 | 50.74% | |
| Yes: 713,813 (36.4%) |
No: 1,249,375 (63.6%) | ||
| ▲ | |||
Scotland was broken down into 73 voting areas.
| Counting Area | Turnout % | No votes | Yes votes | No % | Yes % |
|---|---|---|---|---|---|
| Aberdeen Central | 45.35 | 13,838 | 10,385 | 57.13 | 42.87 |
| Aberdeen Donside | 47.71 | 17,265 | 9,048 | 65.61 | 34.39 |
| Aberdeen South and North Kincardine | 52.37 | 17,945 | 9,818 | 64.64 | 35.36 |
| Aberdeenshire East | 52.68 | 19,538 | 10,359 | 65.35 | 34.65 |
| Aberdeenshire West | 53.37 | 18,119 | 10,131 | 64.14 | 35.86 |
| Airdrie and Shotts | 46.35 | 15,767 | 7,845 | 66.78 | 33.22 |
| Almond Valley | 51.44 | 18,871 | 11,458 | 62.22 | 37.78 |
| Angus North and Mearns | 47.79 | 16,739 | 7,877 | 68.00 | 32.00 |
| Angus South | 50.01 | 18,834 | 8,404 | 69.15 | 30.85 |
| Argyll and Bute | 53.73 | 16,580 | 9,526 | 63.51 | 36.49 |
| Ayr | 54.32 | 22,821 | 10,202 | 69.11 | 30.89 |
| Banffshire and Buchan Coast | 46.55 | 17,451 | 7,153 | 70.93 | 29.07 |
| Caithness, Sutherland and Ross | 52.15 | 17,848 | 10,364 | 63.26 | 36.74 |
| Carrick, Cumnock and Doon Valley | 48.13 | 20,100 | 8,384 | 70.57 | 29.43 |
| Clackmannanshire and Dunblane | 55.57 | 17,077 | 9,993 | 63.08 | 36.92 |
| Clydebank and Milngavie | 53.72 | 17,409 | 10,730 | 61.87 | 38.13 |
| Clydesdale | 52.50 | 19,605 | 10,109 | 65.98 | 34.02 |
| Coatbridge and Chryston | 45.31 | 14,905 | 8,122 | 64.73 | 35.27 |
| Cowdenbeath | 47.03 | 16,831 | 8,360 | 66.81 | 33.19 |
| Cumbernauld and Kilsyth | 52.14 | 16,024 | 8,857 | 64.40 | 35.60 |
| Cunninghame North | 52.31 | 19,299 | 9,935 | 66.02 | 33.98 |
| Cunninghame South | 43.03 | 14,679 | 7,173 | 67.17 | 32.83 |
| Dumbarton | 53.49 | 18,624 | 9,685 | 65.79 | 34.21 |
| Dumfriesshire | 53.46 | 22,472 | 9,236 | 70.87 | 29.13 |
| Dunfermline | 52.59 | 18,869 | 10,069 | 65.20 | 34.80 |
| Dundee City East | 48.34 | 16,557 | 9,048 | 64.66 | 35.34 |
| Dundee City West | 46.19 | 15,097 | 8,930 | 62.83 | 37.17 |
| East Kilbride | 51.16 | 19,103 | 10,568 | 64.38 | 35.62 |
| East Lothian | 56.98 | 20,619 | 11,237 | 64.73 | 35.27 |
| Eastwood | 63.02 | 20,768 | 10,914 | 65.55 | 34.45 |
| Edinburgh Central | 55.76 | 13,717 | 14,486 | 48.64 | 51.36 |
| Edinburgh Eastern | 55.54 | 17,953 | 12,110 | 59.72 | 40.28 |
| Edinburgh North and Leith | 54.06 | 15,034 | 14,995 | 50.06 | 49.94 |
| Edinburgh Pentlands | 58.11 | 19,090 | 10,614 | 64.27 | 35.73 |
| Edinburgh Southern | 62.57 | 16,569 | 16,549 | 50.03 | 49.97 |
| Edinburgh Western | 59.90 | 20,689 | 12,421 | 62.49 | 37.51 |
| Ettrick, Roxburgh and Berwickshire | 53.61 | 19,796 | 8,755 | 69.34 | 30.66 |
| Falkirk East | 49.88 | 19,037 | 8,871 | 68.21 | 31.79 |
| Falkirk West | 50.71 | 18,615 | 9,397 | 66.45 | 33.55 |
| Galloway and West Dumfries | 52.96 | 20,724 | 9,051 | 69.60 | 30.40 |
| Glasgow Anniesland | 43.43 | 13,891 | 9,819 | 58.59 | 41.41 |
| Glasgow Cathcart | 44.95 | 14,803 | 11,184 | 56.96 | 43.04 |
| Glasgow Kelvin | 40.49 | 9,875 | 14,083 | 41.22 | 58.78 |
| Glasgow Maryhill and Springburn | 36.47 | 10,624 | 9,636 | 52.44 | 47.56 |
| Glasgow Pollok | 39.43 | 14,437 | 8,257 | 63.62 | 36.38 |
| Glasgow Provan | 34.95 | 11,365 | 7,616 | 59.88 | 40.12 |
| Glasgow Shettleston | 38.20 | 13,412 | 7,518 | 64.08 | 35.92 |
| Glasgow Southside | 43.29 | 11,114 | 10,972 | 50.32 | 49.68 |
| Greenock and Inverclyde | 49.57 | 18,403 | 9,521 | 65.90 | 34.10 |
| Hamilton, Larkhall and Stonehouse | 45.15 | 14,963 | 10,181 | 59.51 | 40.49 |
| Inverness and Nairn | 53.21 | 20,415 | 11,653 | 63.66 | 36.34 |
| Kilmarnock and Irvine Valley | 50.19 | 21,785 | 9,825 | 68.92 | 31.08 |
| Kirkcaldy | 46.26 | 18,620 | 8,754 | 68.02 | 31.98 |
| Linlithgow | 52.97 | 22,324 | 11,450 | 66.10 | 33.90 |
| Mid Fife and Glenrothes | 48.82 | 17,830 | 8,014 | 68.99 | 31.01 |
| Midlothian North and Musselburgh | 51.42 | 19,203 | 10,220 | 65.27 | 34.73 |
| Midlothian South, Tweedale and Lauderdale | 55.68 | 19,070 | 12,440 | 60.52 | 39.48 |
| Moray | 51.14 | 18,212 | 9,991 | 64.57 | 35.43 |
| Motherwell and Wishaw | 45.51 | 16,028 | 8,154 | 66.28 | 33.72 |
| Na h-Eileanan an Iar | 59.76 | 8,735 | 4,117 | 67.97 | 32.03 |
| North East Fife | 51.08 | 17,441 | 11,670 | 59.91 | 40.09 |
| Orkney | 49.27 | 4,829 | 3,187 | 60.24 | 39.76 |
| Paisley | 49.83 | 16,505 | 8,788 | 65.26 | 34.74 |
| Perthshire North | 56.58 | 20,173 | 9,383 | 68.25 | 31.75 |
| Perthshire South and Kinross-shire | 54.12 | 20,071 | 10,835 | 64.94 | 35.06 |
| Renfrewshire North and West | 55.91 | 18,200 | 9,070 | 66.74 | 33.26 |
| Renfrewshire South | 53.48 | 17,808 | 8,880 | 66.73 | 33.27 |
| Rutherglen | 46.76 | 17,407 | 9,495 | 64.71 | 35.29 |
| Shetland | 53.70 | 5,079 | 4,121 | 55.21 | 44.79 |
| Skye, Lochaber and Badenoch | 56.57 | 18,937 | 12,490 | 60.26 | 39.74 |
| Stirling | 58.55 | 18,683 | 11,270 | 62.37 | 37.63 |
| Strathkelvin and Bearsden | 57.06 | 21,775 | 11,761 | 64.93 | 35.07 |
| Uddingston and Bellshill | 44.85 | 16,480 | 8,289 | 66.53 | 33.47 |
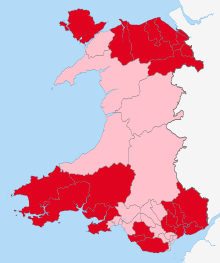
Wales
Colours:
The constituencies of the National Assembly for Wales were used as the local voting areas for the UK-wide referendum throughout Wales.[1]
United Kingdom Alternative Vote referendum, 2011 Wales | |||
| Choice | Votes | % | |
|---|---|---|---|
| No Nac Ydw |
616,307 | 65.45% | |
| Yes Ydw |
325,349 | 34.55% | |
| Valid votes | 941,656 | 99.45% | |
| Invalid or blank votes | 5,267 | 0.56% | |
| Total votes | 946,923 | 100.00% | |
| Registered voters and turnout | 2,268,739 | 41.74% | |
| Yes: 243,048 (34.5%) |
No: 616,307 (65.5%) | ||
| ▲ | |||
Wales was broken down into 40 voting areas.
| Counting Area | Turnout % | No votes | Yes votes | No % | Yes % |
|---|---|---|---|---|---|
| Aberavon | 36.96 | 11,951 | 6,626 | 64.33 | 35.67 |
| Aberconwy[8] | 45.43 | 13,888 | 6,248 | 68.97 | 31.03 |
| Alyn and Deeside | 37.20 | 15,811 | 6,893 | 69.64 | 30.36 |
| Arfon | 43.20 | 9,889 | 7,674 | 56.31 | 43.69 |
| Blaenau Gwent[9] | 37.77 | 13,364 | 6,521 | 67.21 | 32.79 |
| Brecon and Radnorshire | 52.83 | 17,806 | 10,348 | 63.25 | 36.75 |
| Bridgend | 40.91 | 16,066 | 7,732 | 67.51 | 32.49 |
| Caerphilly[10] | 41.10 | 16,519 | 8,768 | 65.33 | 34.67 |
| Cardiff Central | 37.67 | 12,656 | 10,641 | 54.32 | 45.68 |
| Cardiff North | 51.55 | 22,128 | 11,952 | 64.93 | 35.07 |
| Cardiff South and Penarth | 37.23 | 16,597 | 10,562 | 61.11 | 38.89 |
| Cardiff West | 43.49 | 16,074 | 11,278 | 58.77 | 41.23 |
| Carmarthen East and Dinefwr | 51.57 | 18,243 | 9,447 | 65.88 | 34.12 |
| Carmarthen West and South Pembrokeshire | 48.03 | 19,197 | 8,632 | 68.98 | 31.02 |
| Ceredigion | 51.71 | 17,253 | 11,500 | 60.00 | 40.00 |
| Clwyd South | 37.26 | 13,329 | 6,606 | 66.86 | 33.14 |
| Clwyd West[11] | 43.40 | 17,371 | 7,524 | 69.78 | 30.22 |
| Cynon Valley | 35.76 | 11,661 | 6,820 | 63.10 | 36.90 |
| Delyn | 43.50 | 16,043 | 7,138 | 69.21 | 30.79 |
| Dwyfor Meirionnydd | 46.81 | 13,268 | 7,425 | 64.12 | 35.88 |
| Gower | 43.38 | 17,394 | 9,251 | 65.28 | 34.72 |
| Islwyn | 37.80 | 14,068 | 6,618 | 68.01 | 31.99 |
| Llanelli | 44.26 | 17,033 | 8,643 | 66.34 | 33.66 |
| Merthyr Tydfil and Rhymney | 35.11 | 12,208 | 6,876 | 63.97 | 36.03 |
| Monmouth | 46.60 | 20,855 | 9,225 | 69.33 | 30.67 |
| Montgomeryshire | 47.40 | 14,750 | 8,154 | 64.40 | 35.60 |
| Neath | 41.57 | 15,401 | 8,303 | 64.97 | 35.03 |
| Newport East | 35.67 | 13,112 | 6,277 | 67.63 | 32.37 |
| Newport West | 36.86 | 15,643 | 7,293 | 68.20 | 31.80 |
| Ogmore | 36.58 | 13,192 | 6,923 | 65.58 | 34.42 |
| Pontypridd | 38.87 | 14,691 | 8,417 | 63.58 | 36.42 |
| Preseli Pembrokeshire | 47.14 | 18,392 | 8,651 | 68.01 | 31.99 |
| Rhondda | 37.63 | 12,356 | 7,194 | 63.54 | 36.46 |
| Swansea East | 31.37 | 12,146 | 6,578 | 64.87 | 35.13 |
| Swansea West | 35.34 | 13,308 | 8,355 | 61.43 | 38.57 |
| Torfaen | 36.44 | 14,724 | 7,398 | 66.56 | 33.44 |
| Vale of Clwyd | 40.87 | 15,767 | 7,080 | 69.01 | 30.99 |
| Vale of Glamorgan | 46.91 | 22,862 | 10,287 | 68.97 | 31.03 |
| Wrexham | 36.09 | 12,603 | 5,957 | 67.90 | 32.10 |
| Ynys Môn | 48.72 | 16,448 | 7,534 | 68.58 | 31.42 |
References
- 1 2 3 4 Parliamentary Voting System and Constituencies Act 2011 Part 1; Section 7(2) — note: the legislation refers to them as the "voting areas".
- ↑ "Count timing decision UK Parliamentary Voting System Referendum" (PDF). The Electoral Commission. Retrieved 4 May 2011.
- ↑ "Referendum results". The Electoral Commission. Retrieved 27 June 2016.
- ↑ Referendum on the voting system for the UK Parliament, Electoral Commission, 3 April 2011
- ↑ electoarlcommission.org.uk, 7 May 2011
- ↑ "Voting area total: Barking & Dagenham (London)". The Electoral Commission. 6 May 2011. Archived from the original on 11 May 2011. Retrieved 6 May 2011.
- ↑ "Voting area total: Bexley (London)". The Electoral Commission. 6 May 2011. Archived from the original on 11 May 2011. Retrieved 6 May 2011.
- ↑ "Voting area total: Aberconwy (Wales)". The Electoral Commission. 6 May 2011. Archived from the original on 11 May 2011. Retrieved 6 May 2011.
- ↑ "Voting area total: Blaenau Gwent (Wales)". The Electoral Commission. 6 May 2011. Archived from the original on 11 May 2011. Retrieved 6 May 2011.
- ↑ "Voting area total: Caerphilly (Wales)". The Electoral Commission. 6 May 2011. Archived from the original on 22 July 2011. Retrieved 6 May 2011.
- ↑ "Voting area total: Clwyd West (Wales)". The Electoral Commission. 6 May 2011. Archived from the original on 22 July 2011. Retrieved 6 May 2011.
External links
- The Electoral Commission Referendum results
| General elections |
|
|---|---|
| Local elections |
|
| European elections | |
| Referendums | |