Wirral Metropolitan Borough Council election, 2011
|
| |||||||||||||||||||||||||||||||||||||||||||||||||
| |||||||||||||||||||||||||||||||||||||||||||||||||
23 of 66 seats (One Third and one by-election) to Wirral Metropolitan Borough Council 34 seats needed for a majority | |||||||||||||||||||||||||||||||||||||||||||||||||
|---|---|---|---|---|---|---|---|---|---|---|---|---|---|---|---|---|---|---|---|---|---|---|---|---|---|---|---|---|---|---|---|---|---|---|---|---|---|---|---|---|---|---|---|---|---|---|---|---|---|
| Turnout |
43.2% ( | ||||||||||||||||||||||||||||||||||||||||||||||||
| |||||||||||||||||||||||||||||||||||||||||||||||||
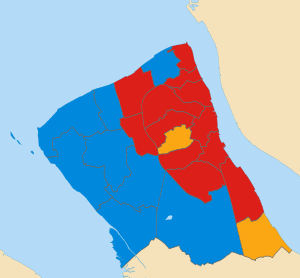 Map of results of 2011 election | |||||||||||||||||||||||||||||||||||||||||||||||||
| |||||||||||||||||||||||||||||||||||||||||||||||||

The 2011 Wirral Metropolitan Borough Council election took place on 5 May 2011 to elect members of Wirral Metropolitan Borough Council in England. This election was held on the same day as other local elections.
After the election, the composition of the council was:
| Party | Seats | ± | |
|---|---|---|---|
| Labour | 29 | ||
| Conservative | 27 | ||
| Liberal Democrat | 10 | ||
Election results
Overall election result
Overall result compared with 2010.
| Wirral Metropolitan Borough Council election result, 2011 | |||||||||||||||
|---|---|---|---|---|---|---|---|---|---|---|---|---|---|---|---|
| Party | Candidates | Votes | |||||||||||||
| Stood | Elected | Gained | Unseated | Net | % of total | % | № | Net % | |||||||
| Labour | 23 | 12 | 5 | 0 | 54.5 | 43.8 | 45,006 | ||||||||
| Conservative | 23 | 9 | 3 | 3 | 36.4 | 33.8 | 34,738 | ||||||||
| Liberal Democrat | 22 | 2 | 0 | 5 | 9.1 | 12.5 | 12,815 | ||||||||
| UKIP | 23 | 0 | 0 | 0 | 0.0 | 5.0 | 5,165 | ||||||||
| Green | 20 | 0 | 0 | 0 | 0.0 | 4.8 | 4,904 | ||||||||
| Independent | 1 | 0 | 0 | 0 | 0.0 | 0.1 | 154 | N/A | |||||||
Changes in council composition
Prior to the election the composition of the council was:
| 24 | 27 | 14 | 1 |
| Lab | Con | LD | V |
After the election the composition of the council was:
| 29 | 27 | 10 |
| Lab | Con | LD |
Ward results
Results compared directly with the last local election in 2010.
Bebington
| Party | Candidate | Votes | % | ± | |
|---|---|---|---|---|---|
| Labour | Jerry Williams | 3,200 | 56.7 | ||
| Conservative | Kevin Sharkey | 1,762 | 31.2 | ||
| UKIP | Hilary Jones | 466 | 8.3 | ||
| Green | Michael Harper | 212 | 3.8 | ||
| Majority | 1,438 | 25.5 | |||
| Registered electors | 11,756 | ||||
| Turnout | 48.2 | ||||
| Labour hold | Swing | ||||
Bidston and St James
| Party | Candidate | Votes | % | ± | |
|---|---|---|---|---|---|
| Labour | Harry Smith | 2,259 | 79.4 | ||
| Conservative | Jerrold Vickers | 284 | 10.0 | ||
| Liberal Democrat | John Brace | 160 | 5.6 | ||
| UKIP | Helen Romnes | 142 | 5.0 | ||
| Majority | 1,975 | 69.4 | |||
| Registered electors | 9,781 | ||||
| Turnout | 29.3 | ||||
| Labour hold | Swing | ||||
Birkenhead and Tranmere
| Party | Candidate | Votes | % | ± | |
|---|---|---|---|---|---|
| Labour | Phillip Davies | 1,750 | 53.9 | ||
| Green | Pat Cleary | 1,133 | 34.9 | ||
| Conservative | June Cowin | 148 | 4.6 | ||
| UKIP | David Martin | 120 | 3.7 | ||
| Liberal Democrat | Allan Brame | 95 | 3.0 | ||
| Majority | 617 | 19.0 | |||
| Registered electors | 9,807 | ||||
| Turnout | 33.2 | ||||
| Labour hold | Swing | ||||
Bromborough
| Party | Candidate | Votes | % | ± | |
|---|---|---|---|---|---|
| Labour | Joe Walsh | 2,609 | 57.9 | ||
| Liberal Democrat | Robert Moon | 768 | 17.1 | ||
| Conservative | Kathryn Hodson | 742 | 16.5 | ||
| UKIP | Timothy Pass | 227 | 5.0 | New | |
| Green | Percy Hogg | 157 | 3.5 | ||
| Majority | 1,841 | 40.8 | |||
| Registered electors | 10,762 | ||||
| Turnout | 42.0 | ||||
| Labour gain from Liberal Democrat | Swing | ||||
Clatterbridge
| Party | Candidate | Votes | % | ± | |
|---|---|---|---|---|---|
| Conservative | Adam Sykes | 2,688 | 46.7 | ||
| Labour | Audrey Moore | 1,798 | 31.2 | ||
| Liberal Democrat | Simon Thomson | 816 | 14.2 | ||
| UKIP | Philip Griffiths | 275 | 4.8 | ||
| Green | Jim McGinley | 182 | 3.2 | ||
| Majority | 890 | 15.5 | |||
| Registered electors | 11,611 | ||||
| Turnout | 49.9 | ||||
| Conservative gain from Liberal Democrat | Swing | ||||
Claughton
| Party | Candidate | Votes | % | ± | |
|---|---|---|---|---|---|
| Labour | Stephen Foulkes | 2,613 | 60.3 | ||
| Conservative | Barbara Sinclair | 952 | 22.0 | ||
| Liberal Democrat | Roy Wood | 308 | 7.1 | ||
| UKIP | Bethan Williams | 265 | 6.1 | ||
| Green | Cathy Page | 197 | 4.5 | ||
| Majority | 1,661 | 38.3 | |||
| Registered electors | 11,272 | ||||
| Turnout | 38.7 | ||||
| Labour hold | Swing | ||||
Eastham
| Party | Candidate | Votes | % | ± | |
|---|---|---|---|---|---|
| Liberal Democrat | Dave Mitchell | 2,091 | 43.6 | ||
| Labour | Robert Gregson | 1,648 | 34.4 | ||
| Conservative | Colin Hughes | 809 | 16.9 | ||
| UKIP | Laurence Jones | 244 | 5.1 | ||
| Majority | 443 | 9.2 | |||
| Registered electors | 10,977 | ||||
| Turnout | 43.9 | ||||
| Liberal Democrat hold | Swing | ||||
Greasby, Frankby and Irby
| Party | Candidate | Votes | % | ± | |
|---|---|---|---|---|---|
| Conservative | Mike Hornby [n 2] | 2,409 | 38.8 | ||
| Conservative | Tony Cox [n 3] | 2,292 | – | – | |
| Liberal Democrat | Peter Reisdorf | 1,652 | 26.6 | ||
| Labour | Andrew Hollingworth | 1,483 | 23.9 | ||
| Liberal Democrat | Frank Doyle | 1,220 | – | – | |
| Labour | Lee Rushworth | 1,208 | – | – | |
| UKIP | Patricia Lamb | 331 | 5.3 | ||
| Green | Kathryn Peers | 327 | 5.3 | ||
| UKIP | Timothy Crooke | 246 | – | – | |
| Majority | 757 | 12.2 | |||
| Registered electors | 11,497 | ||||
| Turnout | 52.6 | ||||
| Conservative gain from Liberal Democrat | Swing | ||||
| Conservative gain from Liberal Democrat | Swing | – | |||
Heswall
| Party | Candidate | Votes | % | ± | |
|---|---|---|---|---|---|
| Conservative | Andrew Hodson | 3,745 | 64.9 | ||
| Labour | Alan Hannaford | 1,065 | 18.4 | ||
| Liberal Democrat | David Tyrrell | 392 | 6.8 | ||
| UKIP | David Scott | 290 | 5.0 | ||
| Green | Barbara Burton | 281 | 4.9 | ||
| Majority | 2,680 | 46.5 | |||
| Registered electors | 10,965 | ||||
| Turnout | 52.9 | ||||
| Conservative hold | Swing | ||||
Hoylake and Meols
| Party | Candidate | Votes | % | ± | |
|---|---|---|---|---|---|
| Conservative | Gerry Ellis | 2,866 | 56.9 | ||
| Labour | Sylvia Hodrien | 1,283 | 25.5 | ||
| Liberal Democrat | Jane Otterson | 402 | 8.0 | ||
| Green | Yvonne McGinley | 349 | 6.9 | ||
| UKIP | Frank Whitham | 141 | 2.8 | ||
| Majority | 1,583 | 31.4 | |||
| Registered electors | 10,397 | ||||
| Turnout | 48.8 | ||||
| Conservative hold | Swing | ||||
Leasowe and Moreton East
| Party | Candidate | Votes | % | ± | |
|---|---|---|---|---|---|
| Labour | Ron Abbey | 2,442 | 55.4 | ||
| Conservative | Steven Smith | 1,564 | 35.5 | ||
| UKIP | Russell Jones | 149 | 3.4 | ||
| Green | Jackie Smith | 143 | 3.2 | ||
| Liberal Democrat | Gerald Hainsworth | 111 | 2.5 | ||
| Majority | 878 | 19.9 | |||
| Registered electors | 10,629 | ||||
| Turnout | 41.8 | ||||
| Labour hold | Swing | ||||
Liscard
| Party | Candidate | Votes | % | ± | |
|---|---|---|---|---|---|
| Labour | Bernie Mooney | 2,523 | 54.1 | ||
| Conservative | Karen Hayes | 1,673 | 35.8 | ||
| UKIP | Lynda Williams | 204 | 4.4 | ||
| Green | Kenny Peers | 146 | 3.1 | ||
| Liberal Democrat | Daniel Clein | 121 | 2.6 | ||
| Majority | 850 | 18.3 | |||
| Registered electors | 11,082 | ||||
| Turnout | 42.3 | ||||
| Labour gain from Conservative | Swing | ||||
Moreton West and Saughall Massie
| Party | Candidate | Votes | % | ± | |
|---|---|---|---|---|---|
| Conservative | Steve Williams | 2,246 | 50.5 | ||
| Labour | Karl Greaney | 1,768 | 39.7 | ||
| UKIP | Susan Whitham | 198 | 4.4 | ||
| Liberal Democrat | Eric Copestake | 144 | 3.2 | ||
| Green | Perle Sheldricks | 94 | 2.1 | ||
| Majority | 478 | 10.8 | |||
| Registered electors | 10,724 | ||||
| Turnout | 41.7 | ||||
| Conservative hold | Swing | ||||
New Brighton
| Party | Candidate | Votes | % | ± | |
|---|---|---|---|---|---|
| Labour | Pat Hackett | 2,283 | 49.6 | ||
| Conservative | Tony Pritchard | 1,621 | 35.2 | ||
| Green | Cynthia Stonall | 264 | 5.7 | ||
| UKIP | Bill Duffey | 254 | 5.5 | ||
| Liberal Democrat | Julia Codling | 177 | 3.8 | ||
| Majority | 662 | 14.4 | |||
| Registered electors | 10,825 | ||||
| Turnout | 42.8 | ||||
| Labour gain from Conservative | Swing | ||||
Oxton
| Party | Candidate | Votes | % | ± | |
|---|---|---|---|---|---|
| Liberal Democrat | Stuart Kelly | 1,918 | 39.8 | ||
| Labour | Matthew Patrick | 1,792 | 37.2 | ||
| Conservative | Tina McDonnell | 655 | 13.6 | ||
| UKIP | Catherine Williams | 234 | 4.9 | ||
| Green | Garnette Bowler | 222 | 4.6 | ||
| Majority | 126 | 2.6 | |||
| Registered electors | 11,108 | ||||
| Turnout | 43.6 | ||||
| Liberal Democrat hold | Swing | ||||
Pensby and Thingwall
| Party | Candidate | Votes | % | ± | |
|---|---|---|---|---|---|
| Conservative | Don McCubbin | 1,881 | 36.9 | ||
| Labour | Michael Sullivan | 1,636 | 32.1 | ||
| Liberal Democrat | Damien Cummins | 1,209 | 23.7 | ||
| UKIP | Oliver Sayle-Adam | 196 | 3.8 | ||
| Green | Allen Burton | 180 | 3.5 | ||
| Majority | 245 | 4.8 | N/A | ||
| Registered electors | 10,493 | ||||
| Turnout | 48.8 | ||||
| Conservative hold | Swing | ||||
Prenton
| Party | Candidate | Votes | % | ± | |
|---|---|---|---|---|---|
| Labour | Paul Doughty | 2,376 | 51.2 | ||
| Liberal Democrat | Simon Holbrook | 1,219 | 26.3 | ||
| Conservative | Cyrus Ferguson | 662 | 14.3 | ||
| UKIP | James Bradshaw | 238 | 5.1 | ||
| Green | Mark Mitchell | 146 | 3.1 | ||
| Majority | 1,157 | 24.9 | |||
| Registered electors | 10,820 | ||||
| Turnout | 43.1 | ||||
| Labour gain from Liberal Democrat | Swing | ||||
Rock Ferry
| Party | Candidate | Votes | % | ± | |
|---|---|---|---|---|---|
| Labour | Chris Meaden | 2,129 | 71.3 | ||
| Conservative | Barbara Poole | 369 | 12.4 | ||
| UKIP | Ann Flynn | 225 | 7.5 | New | |
| Liberal Democrat | Peter Heppinstall | 164 | 5.5 | ||
| Green | Joy Hogg | 100 | 3.3 | ||
| Majority | 1,760 | 58.9 | |||
| Registered electors | 9,630 | ||||
| Turnout | 31.2 | ||||
| Labour hold | Swing | ||||
Seacombe
| Party | Candidate | Votes | % | ± | |
|---|---|---|---|---|---|
| Labour | Chris Jones | 2,111 | 64.4 | ||
| Conservative | Denis Knowles | 677 | 20.6 | ||
| UKIP | Christopher Wellstead | 286 | 8.7 | ||
| Green | Timothy Denton | 104 | 3.2 | ||
| Liberal Democrat | Steve Pitt | 101 | 3.1 | ||
| Majority | 1,434 | 43.8 | |||
| Registered electors | 10,482 | ||||
| Turnout | 31.5 | ||||
| Labour gain from Conservative | Swing | ||||
Upton
| Party | Candidate | Votes | % | ± | |
|---|---|---|---|---|---|
| Labour | Tony Smith | 2,850 | 57.6 | ||
| Conservative | Geoff Gubb | 1,495 | 30.2 | ||
| Liberal Democrat | Alan Davies | 226 | 4.6 | ||
| UKIP | Emma Sayle-Adam | 221 | 4.5 | New | |
| Green | Lesley Hussenbux | 158 | 3.2 | ||
| Majority | 1,355 | 27.4 | |||
| Registered electors | 12,087 | ||||
| Turnout | 41.1 | ||||
| Labour hold | Swing | ||||
Wallasey
| Party | Candidate | Votes | % | ± | |
|---|---|---|---|---|---|
| Conservative | Paul Hayes | 2,670 | 49.2 | ||
| Labour | Phil Mount | 2,030 | 37.4 | ||
| Liberal Democrat | John Codling | 258 | 4.8 | ||
| UKIP | Ian Watson | 236 | 4.4 | ||
| Green | James Brady | 230 | 4.2 | ||
| Majority | 640 | 11.8 | |||
| Registered electors | 11,873 | ||||
| Turnout | 45.9 | ||||
| Conservative hold | Swing | ||||
West Kirby and Thurstaston
| Party | Candidate | Votes | % | ± | |
|---|---|---|---|---|---|
| Conservative | David Elderton | 2,820 | 53.0 | ||
| Labour | Tony Norbury | 1,358 | 25.5 | ||
| Liberal Democrat | John Cresswell | 483 | 9.1 | ||
| Green | Shirley Johnson | 279 | 5.2 | ||
| UKIP | George Robinson | 223 | 4.2 | ||
| Independent | Charles Barnes | 154 | 2.9 | New | |
| Majority | 1,462 | 27.5 | |||
| Registered electors | 10,343 | ||||
| Turnout | 51.7 | ||||
| Conservative hold | Swing | ||||
Notes
References
- ↑ "Election Result for 5 May 2011". Wirral Metropolitan Borough Council.
- ↑ "Election Result for Bebington ward on 5 May 2011". Wirral Metropolitan Borough Council.
- ↑ "Councillor Jerry Williams". Wirral Metropolitan Borough Council.
- ↑ "Election Result for Bidston and St. James ward on 5 May 2011". Wirral Metropolitan Borough Council.
- ↑ "Councillor Harry Smith". Wirral Metropolitan Borough Council.
- ↑ "Election Result for Birkenhead and Tranmere ward on 5 May 2011". Wirral Metropolitan Borough Council.
- ↑ "Councillor Phil Davies". Wirral Metropolitan Borough Council.
- ↑ "Councillor Pat Cleary". Wirral Metropolitan Borough Council.
- ↑ "Election Result for Bromborough ward on 5 May 2011". Wirral Metropolitan Borough Council.
- ↑ "Councillor Joe Walsh". Wirral Metropolitan Borough Council.
- ↑ "Councillor Bob Moon". Wirral Metropolitan Borough Council.
- ↑ "Councillor Kathy Hodson". Wirral Metropolitan Borough Council.
- ↑ "Election Result for Clatterbridge ward on 5 May 2011". Wirral Metropolitan Borough Council.
- ↑ "Councillor Adam Sykes". Wirral Metropolitan Borough Council.
- ↑ "Election Result for Claughton ward on 5 May 2011". Wirral Metropolitan Borough Council.
- ↑ "Councillor Steve Foulkes". Wirral Metropolitan Borough Council.
- ↑ "Election Result for Eastham ward on 5 May 2011". Wirral Metropolitan Borough Council.
- ↑ "Councillor Dave Mitchell". Wirral Metropolitan Borough Council.
- ↑ "Election Result for Greasby, Frankby and Irby ward on 5 May 2011". Wirral Metropolitan Borough Council.
- ↑ "Councillor Mike Hornby". Wirral Metropolitan Borough Council.
- ↑ "Councillor Tony Cox". Wirral Metropolitan Borough Council.
- ↑ "Councillor Peter Reisdorf". Wirral Metropolitan Borough Council.
- ↑ "Election Result for Heswall ward on 5 May 2011". Wirral Metropolitan Borough Council.
- ↑ "Councillor Andrew Hodson". Wirral Metropolitan Borough Council.
- ↑ "Election Result for Hoylake and Meols ward on 5 May 2011". Wirral Metropolitan Borough Council.
- ↑ "Councillor Gerry Ellis". Wirral Metropolitan Borough Council.
- ↑ "Councillor Sylvia Hodrien". Wirral Metropolitan Borough Council.
- ↑ "Election Result for Leasowe and Moreton East ward on 5 May 2011". Wirral Metropolitan Borough Council.
- ↑ "Councillor Ron Abbey". Wirral Metropolitan Borough Council.
- ↑ "Election Result for Liscard ward on 5 May 2011". Wirral Metropolitan Borough Council.
- ↑ "Councillor Bernie Mooney". Wirral Metropolitan Borough Council.
- ↑ "Councillor Karen Hayes". Wirral Metropolitan Borough Council.
- ↑ "Election Result for Moreton West and Saughall Massie ward on 5 May 2011". Wirral Metropolitan Borough Council.
- ↑ "Councillor Steve Williams". Wirral Metropolitan Borough Council.
- ↑ "Election Result for New Brighton ward on 5 May 2011". Wirral Metropolitan Borough Council.
- ↑ "Councillor Pat Hackett". Wirral Metropolitan Borough Council.
- ↑ "Councillor Tony Pritchard". Wirral Metropolitan Borough Council.
- ↑ "Election Result for Oxton ward on 5 May 2011". Wirral Metropolitan Borough Council.
- ↑ "Councillor Stuart Kelly". Wirral Metropolitan Borough Council.
- ↑ "Councillor Matthew Patrick". Wirral Metropolitan Borough Council.
- ↑ "Election Result for Pensby and Thingwall ward on 5 May 2011". Wirral Metropolitan Borough Council.
- ↑ "Councillor Don McCubbin". Wirral Metropolitan Borough Council.
- ↑ "Councillor Michael Sullivan". Wirral Metropolitan Borough Council.
- ↑ "Election Result for Prenton ward on 5 May 2011". Wirral Metropolitan Borough Council.
- ↑ "Councillor Paul Doughty". Wirral Metropolitan Borough Council.
- ↑ "Councillor Simon Holbrook". Wirral Metropolitan Borough Council.
- ↑ "Election Result for Rock Ferry ward on 5 May 2011". Wirral Metropolitan Borough Council.
- ↑ "Councillor Chris Meaden". Wirral Metropolitan Borough Council.
- ↑ "Election Result for Seacombe ward on 5 May 2011". Wirral Metropolitan Borough Council.
- ↑ "Councillor Chris Jones". Wirral Metropolitan Borough Council.
- ↑ "Councillor Denis Knowles". Wirral Metropolitan Borough Council.
- ↑ "Election Result for Upton ward on 5 May 2011". Wirral Metropolitan Borough Council.
- ↑ "Councillor Tony Smith". Wirral Metropolitan Borough Council.
- ↑ "Election Result for Wallasey ward on 5 May 2011". Wirral Metropolitan Borough Council.
- ↑ "Councillor Paul Hayes". Wirral Metropolitan Borough Council.
- ↑ "Election Result for West Kirby and Thurstaston ward on 5 May 2011". Wirral Metropolitan Borough Council.
- ↑ "Councillor David M Elderton". Wirral Metropolitan Borough Council.
- ↑ "Councillor Tony Norbury". Wirral Metropolitan Borough Council.
This article is issued from
Wikipedia.
The text is licensed under Creative Commons - Attribution - Sharealike.
Additional terms may apply for the media files.