Plymouth City Council election, 2011
| |||||||||||||||||||||||||||||||||
19 of the 57 seats to Plymouth City Council 29 seats needed for a majority | |||||||||||||||||||||||||||||||||
|---|---|---|---|---|---|---|---|---|---|---|---|---|---|---|---|---|---|---|---|---|---|---|---|---|---|---|---|---|---|---|---|---|---|
| |||||||||||||||||||||||||||||||||
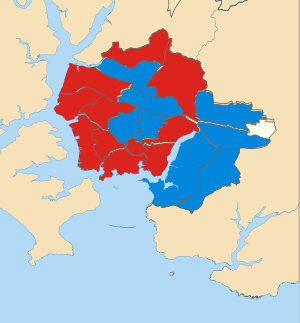 Map showing the results of contested wards in the 2011 Plymouth City Council elections. | |||||||||||||||||||||||||||||||||
| |||||||||||||||||||||||||||||||||
Elections to Plymouth City Council took place on Thursday 5 May 2011.
One third of the council was up for election, 20 seats in total. The previous election produced a majority for the Conservative Party. The election resulted in Labour gaining 5 seats with Conservatives retaining control.[1]
Ward results
Budshead
| Party | Candidate | Votes | % | ± | |
|---|---|---|---|---|---|
| Conservative | Jonathan Charles Thomas Drean | 1,756 | 45.8 | ||
| Labour Co-op | Mike Fox | 1,641 | 42.8 | ||
| UKIP | Hugh Martyn Williams | 437 | 11.4 | ||
| Majority | 115 | 3.0 | |||
| Turnout | 3834 | 40.0 | |||
| Conservative hold | Swing | ||||
Compton
| Party | Candidate | Votes | % | ± | |
|---|---|---|---|---|---|
| Conservative | David John Stark | 1,938 | 48.3 | ||
| Labour | Stephen Paul Randall | 1,086 | 27.0 | ||
| UKIP | Michael Robert Cooke | 364 | 9.1 | ||
| Liberal Democrat | Paul Huntley | 359 | 8.9 | ||
| Green | Colin James Trier | 268 | 6.7 | ||
| Majority | 852 | 21.2 | |||
| Turnout | 4,015 | 42.8 | |||
| Conservative hold | Swing | ||||
Devonport
| Party | Candidate | Votes | % | ± | |
|---|---|---|---|---|---|
| Labour | Mark Antony Coker | 1,519 | 52.1 | ||
| Conservative | Betty Gray | 830 | 28.5 | ||
| UKIP | Syd Brooks | 403 | 13.8 | ||
| Green | Andrew Robert Pratt | 162 | 5.6 | ||
| Majority | 689 | 23.6 | |||
| Turnout | 2914 | 30.0 | |||
| Labour hold | Swing | ||||
Drake
| Party | Candidate | Votes | % | ± | |
|---|---|---|---|---|---|
| Labour | Chaz Singh | 589 | 37.1 | ||
| Conservative | Andy Fox | 506 | 31.9 | ||
| Liberal Democrat | Rebecca Jane Trimnell | 178 | 11.2 | ||
| Green | Wendy Margaret Miller | 116 | 7.3 | ||
| UKIP | Chris Palmer | 99 | 6.2 | ||
| Independent | David Santillo | 97 | 6.1 | ||
| Majority | 83 | 5.2 | |||
| Turnout | 1,585 | 33.8 | |||
| Labour gain from Conservative | Swing | ||||
Efford and Lipson
| Party | Candidate | Votes | % | ± | |
|---|---|---|---|---|---|
| Labour Co-op | Pauline Murphy | 1,785 | 53.6 | ||
| Conservative | Nick Kelly | 832 | 25.0 | ||
| UKIP | Ramon Philip Fereday | 362 | 10.9 | ||
| Liberal Democrat | Duncan Telford Beasley | 189 | 5.7 | ||
| Green | Roger Michael Creagh-Osborne | 161 | 4.8 | ||
| Majority | 953 | 28.6 | |||
| Turnout | 3,329 | 36.0 | |||
| Labour hold | Swing | ||||
Eggbuckland
| Party | Candidate | Votes | % | ± | |
|---|---|---|---|---|---|
| Conservative | Lynda Margaret Bowyer | 2,185 | 48.4 | ||
| Labour | Mark Andrew Thompson | 1,670 | 37.0 | ||
| UKIP | Roger Kenneth Thomas | 664 | 14.7 | ||
| Majority | 953 | 21.1 | |||
| Turnout | 4,519 | 44.0 | |||
| Conservative hold | Swing | ||||
Ham
| Party | Candidate | Votes | % | ± | |
|---|---|---|---|---|---|
| Labour Co-op | Tudor Evans | 1,843 | 54.7 | ||
| Conservative | Tim Delbridge | 969 | 28.8 | ||
| UKIP | Alan John Skuse | 558 | 16.6 | ||
| Majority | 874 | 25.9 | |||
| Turnout | 3,370 | 35.0 | |||
| Labour hold | Swing | ||||
Honicknowle
| Party | Candidate | Votes | % | ± | |
|---|---|---|---|---|---|
| Labour | Mark John Lowry | 1,790 | 54.0 | ||
| UKIP | Ron Northcott | 675 | 20.3 | ||
| Conservative | Paul Rielly | 671 | 20.2 | ||
| Green | David Wildman | 181 | 5.5 | ||
| Majority | 1,115 | 33.6 | |||
| Turnout | 3,317 | 32.0 | |||
| Labour hold | Swing | ||||
Moor View
| Party | Candidate | Votes | % | ± | |
|---|---|---|---|---|---|
| Labour | Alison Marie Casey | 2,049 | 55.3 | ||
| Conservative | Mark Christie | 1,655 | 44.7 | ||
| Majority | 394 | 10.6 | |||
| Turnout | 3,704 | 40.0 | |||
| Labour hold | Swing | ||||
Peverell
| Party | Candidate | Votes | % | ± | |
|---|---|---|---|---|---|
| Conservative | John Mahoney | 2,059 | 45.5 | ||
| Labour | Jonathan Taylor | 1,461 | 32.3 | ||
| Liberal Democrat | Richard Lawrie | 604 | 13.3 | ||
| UKIP | John Read | 405 | 8.9 | ||
| Majority | 598 | 13.2 | |||
| Turnout | 4,529 | 45.0 | |||
| Conservative hold | Swing | ||||
Plympton Erle
| Party | Candidate | Votes | % | ± | |
|---|---|---|---|---|---|
| Conservative | Terri Beer | 1,597 | 55.2 | ||
| Labour | Roger Williams | 834 | 28.8 | ||
| UKIP | John Roberts | 461 | 15.9 | ||
| Majority | 763 | 26.4 | |||
| Turnout | 2,892 | 42.5 | |||
| Conservative hold | Swing | ||||
Plympton St Mary
| Party | Candidate | Votes | % | ± | |
|---|---|---|---|---|---|
| Conservative | Patrick John Nicholson | 2,687 | 59.8 | ||
| Labour | Prathees Kristino Kishore | 943 | 21.0 | ||
| UKIP | Jonathan Brian Frost | 581 | 12.9 | ||
| Independent | James Alexander Sanderson | 281 | 6.3 | ||
| Majority | 1,744 | 38.8 | |||
| Turnout | 4,492 | 45.1 | |||
| Conservative hold | Swing | ||||
Plymstock Dunstone
| Party | Candidate | Votes | % | ± | |
|---|---|---|---|---|---|
| Conservative | Nigel Andrew Churchill | 2,201 | 49.4 | ||
| Labour | Bethan Rose Davey | 955 | 21.5 | ||
| Liberal Democrat | Sima Davarian | 515 | 11.6 | ||
| UKIP | David Salmon | 781 | 17.5 | ||
| Majority | 1,246 | 28.0 | |||
| Turnout | 4,452 | 46.0 | |||
| Conservative hold | Swing | ||||
Plymstock Radford
| Party | Candidate | Votes | % | ± | |
|---|---|---|---|---|---|
| Conservative | Ken Foster | 2,132 | 50.4 | ||
| Labour | Shirley Margaret Smith | 1,071 | 25.3 | ||
| UKIP | Andrea Bullock | 599 | 14.2 | ||
| Liberal Democrat | Michael James Symons | 430 | 10.2 | ||
| Majority | 1,061 | 25.1 | |||
| Turnout | 4,232 | ||||
| Conservative hold | Swing | ||||
St Budeax
| Party | Candidate | Votes | % | ± | |
|---|---|---|---|---|---|
| Labour | George William Wheeler | 1,901 | 57.2 | ||
| Conservative | Stuart Bernard Charles | 844 | 25.4 | ||
| UKIP | Paul Bedson | 579 | 17.4 | ||
| Majority | 1,057 | 31.8 | |||
| Turnout | 3,324 | 34.0 | |||
| Labour gain from Conservative | Swing | ||||
St Peter and the Waterfront
| Party | Candidate | Votes | % | ± | |
|---|---|---|---|---|---|
| Labour | Chris Penberthy | 1,607 | 24.5 | ||
| Labour | Ian Glenn Tuffin | 1,383 | 21.1 | ||
| Conservative | Tam MacPherson | 1,204 | 18.3 | ||
| Conservative | Chris Robinson | 1,165 | 17.7 | ||
| Liberal Democrat | Hugh Janes | 415 | 6.3 | ||
| UKIP | Roy Alfred Kettle | 400 | 6.1 | ||
| Green | Matt Ray | 396 | 6.0 | ||
| Majority | 224 | 3.4 | |||
| Turnout | 6,570 | 34.8 | |||
| Labour hold | Swing | ||||
Southway
| Party | Candidate | Votes | % | ± | |
|---|---|---|---|---|---|
| Labour | John David Smith | 2,096 | 53.3 | ||
| Conservative | Brian William George Roberts | 1,839 | 46.7 | ||
| Majority | 257 | 6.5 | |||
| Turnout | 3,935 | 41.0 | |||
| Labour gain from Conservative | Swing | ||||
Stoke
| Party | Candidate | Votes | % | ± | |
|---|---|---|---|---|---|
| Labour Co-op | Philippa Davey | 1,875 | 48.2 | ||
| Conservative | Joan Mary Watkins | 1,492 | 38.4 | ||
| UKIP | Fiona Hurst-Baird | 520 | 13.4 | ||
| Majority | 383 | 9.9 | |||
| Turnout | 3,887 | 41.0 | |||
| Labour gain from Conservative | Swing | ||||
Sutton and Mount Gould
| Party | Candidate | Votes | % | ± | |
|---|---|---|---|---|---|
| Labour | Jean Florence Neider | 1,625 | 48.3 | ||
| Conservative | Katy Hitchman | 822 | 22.4 | ||
| UKIP | Jonquil Patricia Webber | 288 | 8.6 | ||
| Green | Tean Jane Mitchell | 226 | 6.7 | ||
| TUSC | Louise Anne Parker | 75 | 2.2 | ||
| Liberal Democrat | Peter York | 327 | 9.7 | ||
| Majority | 806 | 24.0 | |||
| Turnout | 3,363 | 34.7 | |||
| Labour hold | Swing | ||||
References
| Devon County Council | |
|---|---|
| East Devon District Council |
|
| Exeter City Council | |
| Mid Devon District Council |
|
| North Devon District Council | |
| Plymouth City Council | |
| South Hams District Council | |
| Teignbridge District Council |
|
| Torbay Council | |
| Torridge District Council | |
| West Devon Borough Council | |
| |
This article is issued from
Wikipedia.
The text is licensed under Creative Commons - Attribution - Sharealike.
Additional terms may apply for the media files.