1996 United States presidential election in New Hampshire
The 1996 United States presidential election in New Hampshire took place on November 5, 1996, as part of the 1996 United States presidential election. Voters chose 4 representatives, or electors to the Electoral College, who voted for president and vice president.
| |||||||||||||||||||||||||||||||||
| |||||||||||||||||||||||||||||||||
 County Results
| |||||||||||||||||||||||||||||||||
| |||||||||||||||||||||||||||||||||

| Elections in New Hampshire | ||||||||||
|---|---|---|---|---|---|---|---|---|---|---|
 | ||||||||||
|
||||||||||
|
||||||||||
|
|
||||||||||
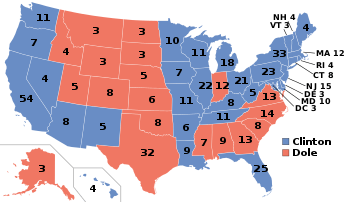
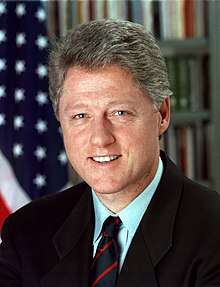
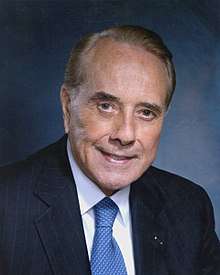
Although traditionally a Republican state, 1996 would mark the second presidential election in a row that New Hampshire was won by Democrat Bill Clinton, by then the incumbent president. Clinton took 49.32% of the popular vote over Republican challenger Bob Dole, who took 39.37%, a victory margin of 9.95%. Reform Party candidate Ross Perot finished in third, with 9.69% of the popular vote.[1]
Clinton's nearly 10-point victory in New Hampshire was much more convincing than his previous win in the state in 1992; that year he had only eked out a narrow plurality of 39% over George H.W. Bush's 38%, with Ross Perot taking nearly 23% of the vote. For a state that had voted over 60% Republican as recently as 1988, Clinton's victories represented a dramatic shift toward the Democratic Party in New Hampshire. Since then the state has voted Democratic in every presidential election, except in 2000, when George W. Bush eked out a narrow plurality win over Al Gore.
Results
| 1996 United States presidential election in New Hampshire | |||||
|---|---|---|---|---|---|
| Party | Candidate | Votes | Percentage | Electoral votes | |
| Democratic | Bill Clinton (incumbent) | 246,214 | 49.32% | 4 | |
| Republican | Bob Dole | 196,532 | 39.37% | 0 | |
| Reform | Ross Perot | 48,390 | 9.69% | 0 | |
| Libertarian | Harry Browne | 4,237 | 0.85% | 0 | |
| N/A | Write-ins | 2,456 | 0.49% | 0 | |
| NH Taxpayer | Howard Phillips (write-in) | 1,346 | 0.27% | 0 | |
| Totals | 499,175 | 100.0% | 4 | ||
By county
| County | Clinton | Votes | Dole | Votes | Others | Votes |
|---|---|---|---|---|---|---|
| Belknap | 43.8% | 10,345 | 45.2% | 10,685 | 11.0% | 2,586 |
| Carroll | 42.8% | 8,881 | 44.2% | 9,168 | 13.1% | 2,714 |
| Cheshire | 54.4% | 16,159 | 34.5% | 10,252 | 11.1% | 3,290 |
| Coos | 50.9% | 7,191 | 33.3% | 4,703 | 15.9% | 2,243 |
| Grafton | 50.3% | 17,476 | 39.0% | 13,543 | 10.8% | 3,753 |
| Hillsborough | 48.6% | 71,282 | 40.5% | 59,441 | 10.9% | 15,912 |
| Merrimack | 52.3% | 29,381 | 37.8% | 21,231 | 10.0% | 5,588 |
| Rockingham | 47.4% | 53,644 | 40.8% | 46,201 | 11.8% | 13,403 |
| Strafford | 54.8% | 23,475 | 33.8% | 14,484 | 11.4% | 4,884 |
| Sullivan | 48.6% | 8,380 | 39.5% | 6,824 | 11.9% | 2,056 |
References
- "1996 Presidential General Election Results". U.S. Election Atlas. Retrieved 29 January 2013.