United States presidential election in Pennsylvania, 1984
|
| ||||||||||||||||||||||||||
| ||||||||||||||||||||||||||
| ||||||||||||||||||||||||||
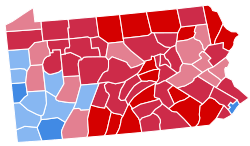 County results
| ||||||||||||||||||||||||||
| ||||||||||||||||||||||||||

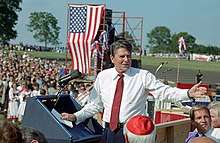
The 1984 United States presidential election in Pennsylvania took place on November 6, 1984, and was part of the 1984 United States presidential election. Voters chose 25 representatives, or electors to the Electoral College, who voted for president and vice president.
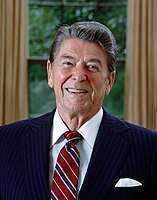
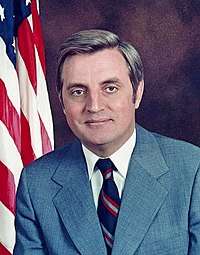
Pennsylvania voted for the Republican nominee, President Ronald Reagan, over the Democratic nominee, former Vice President Walter Mondale. Reagan won Pennsylvania by a margin of 7.35 percentage points.
Reagan won the state by sweeping the small towns and rural areas of central Pennsylvania and performing well in the traditionally Republican suburbs of Philadelphia, but the race was kept within single digits by Mondale’s strong showing in traditionally Democratic Western Pennsylvania, along with decisive double-digit wins in the cities of Pittsburgh and Philadelphia. As of the 2016 presidential election, this is the last election in which Lackawanna County voted Republican.[1] It is along with the two Dwight D. Eisenhower/Adlai Stevenson II elections of 1952 and 1956, one of only three elections since the Civil War in which Pennsylvania voted more Democratic than neighboring New York.
Results
| United States presidential election in Pennsylvania, 1984[2] | |||||
|---|---|---|---|---|---|
| Party | Candidate | Votes | Percentage | Electoral votes | |
| Republican | Ronald Reagan | 2,584,323 | 53.34% | 25 | |
| Democratic | Walter Mondale | 2,228,131 | 45.99% | 0 | |
| Consumer | Sonia Johnson | 21,628 | 0.45% | 0 | |
| Libertarian | David Bergland | 6,982 | 0.14% | 0 | |
| Workers' League | Edward Winn | 2,059 | 0.04% | 0 | |
| Communist | Gus Hall | 1,780 | 0.04% | 0 | |
| Totals | 4,844,903 | 100.00% | 25 | ||
Results by county
| Ronald Wilson Reagan Republican |
Walter Frederick Mondale Democratic |
Various candidates Other parties |
Margin | Total votes cast | |||||
|---|---|---|---|---|---|---|---|---|---|
| County | # | % | # | % | # | % | # | % | # |
| Adams | 16,786 | 69.44% | 7,289 | 30.15% | 99 | 0.41% | 9,497 | 39.29% | 24,174 |
| Allegheny | 284,692 | 42.76% | 372,576 | 55.96% | 8,480 | 1.27% | -87,884 | -13.20% | 665,748 |
| Armstrong | 13,709 | 48.37% | 14,525 | 51.25% | 110 | 0.39% | -816 | -2.88% | 28,344 |
| Beaver | 32,052 | 36.79% | 54,765 | 62.86% | 300 | 0.34% | -22,713 | -26.07% | 87,117 |
| Bedford | 13,085 | 70.57% | 5,424 | 29.25% | 34 | 0.18% | 7,661 | 41.31% | 18,543 |
| Berks | 74,605 | 65.94% | 37,849 | 33.45% | 691 | 0.61% | 36,756 | 32.49% | 113,145 |
| Blair | 30,104 | 65.52% | 15,651 | 34.06% | 190 | 0.41% | 14,453 | 31.46% | 45,945 |
| Bradford | 14,808 | 72.71% | 5,474 | 26.88% | 85 | 0.42% | 9,334 | 45.83% | 20,367 |
| Bucks | 130,119 | 63.25% | 74,568 | 36.25% | 1,032 | 0.50% | 55,551 | 27.00% | 205,719 |
| Butler | 31,676 | 55.94% | 24,735 | 43.68% | 215 | 0.38% | 6,941 | 12.26% | 56,626 |
| Cambria | 32,173 | 44.50% | 39,865 | 55.14% | 258 | 0.36% | -7,692 | -10.64% | 72,296 |
| Cameron | 2,031 | 67.05% | 990 | 32.68% | 8 | 0.26% | 1,041 | 34.37% | 3,029 |
| Carbon | 10,701 | 54.41% | 8,836 | 44.93% | 131 | 0.67% | 1,865 | 9.48% | 19,668 |
| Centre | 27,802 | 62.85% | 16,194 | 36.61% | 240 | 0.54% | 11,608 | 26.24% | 44,236 |
| Chester | 92,221 | 70.11% | 38,870 | 29.55% | 440 | 0.33% | 53,351 | 40.56% | 131,531 |
| Clarion | 9,836 | 64.27% | 5,407 | 35.33% | 61 | 0.40% | 4,429 | 28.94% | 15,304 |
| Clearfield | 18,653 | 60.62% | 11,963 | 38.88% | 153 | 0.50% | 6,690 | 21.74% | 30,769 |
| Clinton | 6,678 | 59.24% | 4,525 | 40.14% | 70 | 0.62% | 2,153 | 19.10% | 11,273 |
| Columbia | 14,402 | 63.39% | 8,254 | 36.33% | 62 | 0.27% | 6,148 | 27.06% | 22,718 |
| Crawford | 20,181 | 60.80% | 12,792 | 38.54% | 222 | 0.67% | 7,389 | 22.26% | 33,195 |
| Cumberland | 49,282 | 69.29% | 21,374 | 30.05% | 467 | 0.66% | 27,908 | 39.24% | 71,123 |
| Dauphin | 54,330 | 61.28% | 33,576 | 37.87% | 752 | 0.85% | 20,754 | 23.41% | 88,658 |
| Delaware | 161,754 | 61.79% | 98,207 | 37.51% | 1,821 | 0.70% | 63,547 | 24.27% | 261,782 |
| Elk | 8,470 | 60.47% | 5,486 | 39.17% | 51 | 0.36% | 2,984 | 21.30% | 14,007 |
| Erie | 55,860 | 51.12% | 52,471 | 48.02% | 935 | 0.86% | 3,389 | 3.10% | 109,266 |
| Fayette | 21,314 | 37.69% | 35,098 | 62.07% | 135 | 0.24% | -13,784 | -24.38% | 56,547 |
| Forest | 1,468 | 63.36% | 839 | 36.21% | 10 | 0.43% | 629 | 27.15% | 2,317 |
| Franklin | 27,243 | 70.13% | 11,480 | 29.55% | 122 | 0.31% | 15,763 | 40.58% | 38,845 |
| Fulton | 3,254 | 71.14% | 1,309 | 28.62% | 11 | 0.24% | 1,945 | 42.52% | 4,574 |
| Greene | 6,376 | 40.40% | 9,365 | 59.33% | 43 | 0.27% | -2,989 | -18.94% | 15,784 |
| Huntingdon | 10,220 | 69.57% | 4,430 | 30.15% | 41 | 0.28% | 5,790 | 39.41% | 14,691 |
| Indiana | 18,845 | 54.22% | 15,791 | 45.43% | 123 | 0.35% | 3,054 | 8.79% | 34,759 |
| Jefferson | 11,334 | 65.31% | 5,950 | 34.28% | 71 | 0.41% | 5,384 | 31.02% | 17,355 |
| Juniata | 5,059 | 65.66% | 2,624 | 34.06% | 22 | 0.29% | 2,435 | 31.60% | 7,705 |
| Lackawanna | 48,132 | 50.57% | 45,851 | 48.17% | 1,202 | 1.26% | 2,281 | 2.40% | 95,185 |
| Lancaster | 99,090 | 75.63% | 31,308 | 23.90% | 618 | 0.47% | 67,782 | 51.74% | 131,016 |
| Lawrence | 19,277 | 44.43% | 23,981 | 55.27% | 128 | 0.30% | -4,704 | -10.84% | 43,386 |
| Lebanon | 27,008 | 71.61% | 10,520 | 27.89% | 188 | 0.50% | 16,488 | 43.72% | 37,716 |
| Lehigh | 61,799 | 59.69% | 41,089 | 39.69% | 649 | 0.63% | 20,710 | 20.00% | 103,537 |
| Luzerne | 69,169 | 53.50% | 58,482 | 45.23% | 1,640 | 1.27% | 10,687 | 8.27% | 129,291 |
| Lycoming | 28,498 | 68.02% | 13,147 | 31.38% | 250 | 0.60% | 15,351 | 36.64% | 41,895 |
| McKean | 10,963 | 69.22% | 4,818 | 30.42% | 58 | 0.37% | 6,145 | 38.80% | 15,839 |
| Mercer | 24,211 | 49.11% | 24,658 | 50.01% | 434 | 0.88% | -447 | -0.91% | 49,303 |
| Mifflin | 9,106 | 63.35% | 5,178 | 36.03% | 89 | 0.62% | 3,928 | 27.33% | 14,373 |
| Monroe | 16,109 | 65.82% | 8,193 | 33.48% | 172 | 0.70% | 7,916 | 32.34% | 24,474 |
| Montgomery | 181,426 | 64.18% | 99,741 | 35.29% | 1,499 | 0.53% | 81,685 | 28.90% | 282,666 |
| Montour | 4,174 | 66.81% | 2,055 | 32.89% | 19 | 0.30% | 2,119 | 33.91% | 6,248 |
| Northampton | 44,648 | 53.49% | 37,979 | 45.50% | 840 | 1.01% | 6,669 | 7.99% | 83,467 |
| Northumberland | 22,109 | 61.13% | 13,748 | 38.01% | 308 | 0.85% | 8,361 | 23.12% | 36,165 |
| Perry | 9,365 | 71.42% | 3,692 | 28.16% | 56 | 0.43% | 5,673 | 43.26% | 13,113 |
| Philadelphia | 267,178 | 34.60% | 501,369 | 64.94% | 3,555 | 0.46% | -234,191 | -30.33% | 772,102 |
| Pike | 6,343 | 71.17% | 2,503 | 28.08% | 67 | 0.75% | 3,840 | 43.08% | 8,913 |
| Potter | 5,164 | 73.94% | 1,789 | 25.62% | 31 | 0.44% | 3,375 | 48.32% | 6,984 |
| Schuylkill | 37,330 | 58.96% | 25,758 | 40.68% | 224 | 0.35% | 11,572 | 18.28% | 63,312 |
| Snyder | 8,968 | 78.73% | 2,383 | 20.92% | 40 | 0.35% | 6,585 | 57.81% | 11,391 |
| Somerset | 19,502 | 58.23% | 13,900 | 41.50% | 89 | 0.27% | 5,602 | 16.73% | 33,491 |
| Sullivan | 1,926 | 66.67% | 952 | 32.95% | 11 | 0.38% | 974 | 33.71% | 2,889 |
| Susquehanna | 10,566 | 69.95% | 4,471 | 29.60% | 67 | 0.44% | 6,095 | 40.35% | 15,104 |
| Tioga | 10,532 | 71.92% | 4,060 | 27.72% | 52 | 0.36% | 6,472 | 44.20% | 14,644 |
| Union | 7,792 | 73.66% | 2,747 | 25.97% | 40 | 0.38% | 5,045 | 47.69% | 10,579 |
| Venango | 13,507 | 59.44% | 9,114 | 40.11% | 104 | 0.46% | 4,393 | 19.33% | 22,725 |
| Warren | 10,838 | 62.93% | 6,244 | 36.26% | 139 | 0.81% | 4,594 | 26.68% | 17,221 |
| Washington | 34,782 | 40.47% | 50,911 | 59.24% | 244 | 0.28% | -16,129 | -18.77% | 85,937 |
| Wayne | 10,061 | 75.66% | 3,155 | 23.73% | 81 | 0.61% | 6,906 | 51.94% | 13,297 |
| Westmoreland | 71,377 | 46.82% | 79,906 | 52.41% | 1,181 | 0.77% | -8,529 | -5.59% | 152,464 |
| Wyoming | 7,230 | 74.01% | 2,518 | 25.78% | 21 | 0.21% | 4,712 | 48.23% | 9,769 |
| York | 75,020 | 68.67% | 33,359 | 30.54% | 868 | 0.79% | 41,661 | 38.13% | 109,247 |
| Totals | 2,584,323 | 53.34% | 2,228,131 | 45.99% | 32,449 | 0.67% | 356,192 | 7.35% | 4,844,903 |
References
- ↑ Sullivan, Robert David; ‘How the Red and Blue Map Evolved Over the Past Century’; America Magazine in The National Catholic Review; June 29, 2016
- ↑ David Leip. "1984 Presidential General Election Results – Pennsylvania". Dave Leip’s U.S. Election Atlas. Retrieved 2018-03-23.
State results of the 1984 U.S. presidential election | ||
|---|---|---|
| Candidates |
|  |
| General articles |
| |
| Other 1980 elections | ||