United States presidential election in Pennsylvania, 1924
|
| |||||||||||||||||||||||||||||||||
| |||||||||||||||||||||||||||||||||
| |||||||||||||||||||||||||||||||||
 County results | |||||||||||||||||||||||||||||||||
| |||||||||||||||||||||||||||||||||


The 1924 United States presidential election in Pennsylvania took place on November 4, 1924. Voters chose 38 representatives, or electors to the Electoral College, who voted for president and vice president.
Pennsylvania overwhelmingly voted for the Republican nominee, President Calvin Coolidge, over the Democratic nominee, former United States Ambassador to the United Kingdom John W. Davis. Coolidge won Pennsylvania by a landslide margin of 46.26 percent.
Coolidge was credited for the booming economy while the Democratic electorate was divided between the conservative Davis and the liberal third-party candidate Robert La Follette who ran as a Progressive. This was the first presidential election in which all American Indians were citizens and thus allowed to vote.
With 65.34% of the popular vote, Pennsylvania would prove to be Coolidge's fourth strongest state in the 1924 election in terms of popular vote percentage after Vermont, Michigan and Maine[1].
Results
| United States presidential election in Pennsylvania, 1924[2] | |||||
|---|---|---|---|---|---|
| Party | Candidate | Votes | Percentage | Electoral votes | |
| Republican | Calvin Coolidge | 1,401,481 | 65.34% | 38 | |
| Democratic | John W. Davis | 409,192 | 19.08% | 0 | |
| Socialist/Labor[lower-alpha 1] | Robert M. La Follette, Sr. | 307,567 | 14.34% | 0 | |
| American | Gilbert Nations | 13,035 | 0.61% | 0 | |
| Prohibition | Herman Faris | 9,779 | 0.46% | 0 | |
| Communist | William Z. Foster | 2,735 | 0.13% | 0 | |
| Socialist Labor | Frank Johns | 634 | 0.03% | 0 | |
| Commonwealth Land | William Wallace | 296 | 0.01% | 0 | |
| Write-ins | Write-ins | 131 | 0.01% | 0 | |
| Totals | 2,144,850 | 100.00% | 38 | ||
Results by county
| John Calvin Coolidge Republican |
John William Davis Democratic |
Robert M. La Follette, Sr. Socialist/Labor[lower-alpha 1] |
Gilbert Owen Nations American |
Herman Preston Faris Prohibition |
Various candidates Other parties |
Margin | Total votes cast[3] | ||||||||
|---|---|---|---|---|---|---|---|---|---|---|---|---|---|---|---|
| County | # | % | # | % | # | % | # | % | # | % | # | % | # | % | # |
| Adams | 5,778 | 52.92% | 4,840 | 44.33% | 273 | 2.50% | 11 | 0.10% | 14 | 0.13% | 2 | 0.02% | 938 | 8.59% | 10,918 |
| Allegheny | 149,296 | 59.01% | 21,984 | 8.69% | 79,095 | 31.26% | 1,059 | 0.42% | 724 | 0.29% | 855 | 0.34% | 70,201[lower-alpha 2] | 27.75% | 253,013 |
| Armstrong | 11,192 | 64.18% | 2,931 | 16.81% | 2,228 | 12.78% | 921 | 5.28% | 131 | 0.75% | 36 | 0.21% | 8,261 | 47.37% | 17,439 |
| Beaver | 16,768 | 64.14% | 3,220 | 12.32% | 5,599 | 21.42% | 312 | 1.19% | 165 | 0.63% | 77 | 0.29% | 11,169[lower-alpha 2] | 42.73% | 26,141 |
| Bedford | 6,154 | 61.72% | 2,315 | 23.22% | 931 | 9.34% | 518 | 5.20% | 39 | 0.39% | 14 | 0.14% | 3,839 | 38.50% | 9,971 |
| Berks | 28,186 | 51.35% | 17,220 | 31.37% | 9,273 | 16.89% | 57 | 0.10% | 68 | 0.12% | 89 | 0.16% | 10,966 | 19.98% | 54,893 |
| Blair | 20,313 | 65.93% | 4,244 | 13.78% | 6,027 | 19.56% | 67 | 0.22% | 115 | 0.37% | 42 | 0.14% | 14,286[lower-alpha 2] | 46.37% | 30,808 |
| Bradford | 11,620 | 73.62% | 2,307 | 14.62% | 1,718 | 10.88% | 25 | 0.16% | 111 | 0.70% | 3 | 0.02% | 9,313 | 59.00% | 15,784 |
| Bucks | 17,460 | 66.88% | 6,582 | 25.21% | 1,941 | 7.43% | 21 | 0.08% | 74 | 0.28% | 30 | 0.11% | 10,878 | 41.67% | 26,108 |
| Butler | 13,113 | 69.45% | 3,462 | 18.34% | 1,932 | 10.23% | 202 | 1.07% | 161 | 0.85% | 10 | 0.05% | 9,651 | 51.12% | 18,880 |
| Cambria | 24,728 | 51.77% | 13,563 | 28.40% | 9,167 | 19.19% | 104 | 0.22% | 94 | 0.20% | 108 | 0.23% | 11,165 | 23.38% | 47,764 |
| Cameron | 1,366 | 77.18% | 260 | 14.69% | 133 | 7.51% | 2 | 0.11% | 8 | 0.45% | 1 | 0.06% | 1,106 | 62.49% | 1,770 |
| Carbon | 10,236 | 55.55% | 5,150 | 27.95% | 2,975 | 16.14% | 14 | 0.08% | 27 | 0.15% | 25 | 0.14% | 5,086 | 27.60% | 18,427 |
| Centre | 7,723 | 59.13% | 4,443 | 34.01% | 673 | 5.15% | 92 | 0.70% | 122 | 0.93% | 9 | 0.07% | 3,280 | 25.11% | 13,062 |
| Chester | 22,333 | 75.76% | 5,946 | 20.17% | 1,013 | 3.44% | 78 | 0.26% | 100 | 0.34% | 10 | 0.03% | 16,387 | 55.59% | 29,480 |
| Clarion | 5,913 | 55.27% | 3,642 | 34.04% | 897 | 8.38% | 139 | 1.30% | 100 | 0.93% | 7 | 0.07% | 2,271 | 21.23% | 10,698 |
| Clearfield | 13,745 | 60.32% | 5,027 | 22.06% | 3,383 | 14.85% | 338 | 1.48% | 247 | 1.08% | 47 | 0.21% | 8,718 | 38.26% | 22,787 |
| Clinton | 5,129 | 54.62% | 1,939 | 20.65% | 1,624 | 17.29% | 628 | 6.69% | 66 | 0.70% | 5 | 0.05% | 3,190 | 33.97% | 9,391 |
| Columbia | 7,336 | 47.42% | 7,390 | 47.77% | 526 | 3.40% | 63 | 0.41% | 133 | 0.86% | 21 | 0.14% | -54 | -0.35% | 15,469 |
| Crawford | 10,918 | 63.09% | 2,969 | 17.16% | 2,987 | 17.26% | 67 | 0.39% | 348 | 2.01% | 16 | 0.09% | 7,931[lower-alpha 2] | 45.83% | 17,305 |
| Cumberland | 10,196 | 53.22% | 7,643 | 39.89% | 1,132 | 5.91% | 44 | 0.23% | 138 | 0.72% | 7 | 0.04% | 2,553 | 13.32% | 19,160 |
| Dauphin | 27,838 | 68.04% | 9,004 | 22.01% | 3,756 | 9.18% | 43 | 0.11% | 245 | 0.60% | 30 | 0.07% | 18,834 | 46.03% | 40,916 |
| Delaware | 41,998 | 81.80% | 6,368 | 12.40% | 2,750 | 5.36% | 52 | 0.10% | 130 | 0.25% | 47 | 0.09% | 35,630 | 69.39% | 51,345 |
| Elk | 6,626 | 70.85% | 1,370 | 14.65% | 1,175 | 12.56% | 20 | 0.21% | 134 | 1.43% | 27 | 0.29% | 5,256 | 56.20% | 9,352 |
| Erie | 19,480 | 61.29% | 3,502 | 11.02% | 8,267 | 26.01% | 69 | 0.22% | 390 | 1.23% | 76 | 0.24% | 11,213[lower-alpha 2] | 35.28% | 31,784 |
| Fayette | 19,064 | 53.57% | 8,855 | 24.88% | 6,103 | 17.15% | 1,264 | 3.55% | 210 | 0.59% | 91 | 0.26% | 10,209 | 28.69% | 35,587 |
| Forest | 1,130 | 71.20% | 280 | 17.64% | 95 | 5.99% | 6 | 0.38% | 76 | 4.79% | 0 | 0.00% | 850 | 53.56% | 1,587 |
| Franklin | 9,791 | 58.82% | 5,770 | 34.67% | 1,010 | 6.07% | 2 | 0.01% | 67 | 0.40% | 5 | 0.03% | 4,021 | 24.16% | 16,645 |
| Fulton | 1,160 | 47.64% | 1,207 | 49.57% | 42 | 1.72% | 26 | 1.07% | 0 | 0.00% | 0 | 0.00% | -47 | -1.93% | 2,435 |
| Greene | 4,590 | 41.82% | 5,874 | 53.52% | 378 | 3.44% | 95 | 0.87% | 30 | 0.27% | 9 | 0.08% | -1,284 | -11.70% | 10,976 |
| Huntingdon | 6,567 | 73.99% | 1,488 | 16.77% | 750 | 8.45% | 29 | 0.33% | 35 | 0.39% | 6 | 0.07% | 5,079 | 57.23% | 8,875 |
| Indiana | 12,748 | 69.75% | 2,067 | 11.31% | 2,648 | 14.49% | 325 | 1.78% | 459 | 2.51% | 30 | 0.16% | 10,100[lower-alpha 2] | 55.26% | 18,277 |
| Jefferson | 10,673 | 64.88% | 2,664 | 16.19% | 2,618 | 15.91% | 338 | 2.05% | 144 | 0.88% | 13 | 0.08% | 8,009 | 48.69% | 16,450 |
| Juniata | 2,177 | 57.41% | 1,420 | 37.45% | 177 | 4.67% | 1 | 0.03% | 17 | 0.45% | 0 | 0.00% | 757 | 19.96% | 3,792 |
| Lackawanna | 37,708 | 60.43% | 16,859 | 27.02% | 7,533 | 12.07% | 12 | 0.02% | 184 | 0.29% | 105 | 0.17% | 20,849 | 33.41% | 62,401 |
| Lancaster | 42,787 | 73.73% | 12,091 | 20.83% | 2,871 | 4.95% | 35 | 0.06% | 200 | 0.34% | 50 | 0.09% | 30,696 | 52.89% | 58,034 |
| Lawrence | 12,533 | 64.58% | 1,880 | 9.69% | 4,211 | 21.70% | 465 | 2.40% | 274 | 1.41% | 43 | 0.22% | 8,322[lower-alpha 2] | 42.88% | 19,406 |
| Lebanon | 9,494 | 74.27% | 2,464 | 19.28% | 756 | 5.91% | 19 | 0.15% | 45 | 0.35% | 5 | 0.04% | 7,030 | 54.99% | 12,783 |
| Lehigh | 20,826 | 59.02% | 10,415 | 29.52% | 3,879 | 10.99% | 60 | 0.17% | 65 | 0.18% | 39 | 0.11% | 10,411 | 29.51% | 35,284 |
| Luzerne | 46,475 | 53.18% | 20,472 | 23.42% | 20,093 | 22.99% | 61 | 0.07% | 171 | 0.20% | 124 | 0.14% | 26,003 | 29.75% | 87,396 |
| Lycoming | 14,039 | 58.70% | 6,857 | 28.67% | 2,432 | 10.17% | 172 | 0.72% | 408 | 1.71% | 8 | 0.03% | 7,182 | 30.03% | 23,916 |
| McKean | 9,072 | 68.99% | 2,376 | 18.07% | 1,373 | 10.44% | 50 | 0.38% | 271 | 2.06% | 7 | 0.05% | 6,696 | 50.92% | 13,149 |
| Mercer | 14,639 | 65.29% | 3,688 | 16.45% | 3,580 | 15.97% | 135 | 0.60% | 339 | 1.51% | 39 | 0.17% | 10,951 | 48.84% | 22,420 |
| Mifflin | 4,780 | 66.92% | 1,999 | 27.99% | 322 | 4.51% | 13 | 0.18% | 27 | 0.38% | 2 | 0.03% | 2,781 | 38.93% | 7,143 |
| Monroe | 3,462 | 44.28% | 3,901 | 49.89% | 426 | 5.45% | 4 | 0.05% | 21 | 0.27% | 5 | 0.06% | -439 | -5.61% | 7,819 |
| Montgomery | 45,407 | 75.48% | 11,094 | 18.44% | 3,450 | 5.74% | 54 | 0.09% | 113 | 0.19% | 36 | 0.06% | 34,313 | 57.04% | 60,154 |
| Montour | 2,499 | 55.83% | 1,799 | 40.19% | 148 | 3.31% | 12 | 0.27% | 16 | 0.36% | 2 | 0.04% | 700 | 15.64% | 4,476 |
| Northampton | 20,459 | 58.42% | 11,459 | 32.72% | 2,882 | 8.23% | 55 | 0.16% | 93 | 0.27% | 74 | 0.21% | 9,000 | 25.70% | 35,022 |
| Northumberland | 17,516 | 56.18% | 7,571 | 24.28% | 5,902 | 18.93% | 77 | 0.25% | 84 | 0.27% | 27 | 0.09% | 9,945 | 31.90% | 31,177 |
| Perry | 4,185 | 57.52% | 2,710 | 37.25% | 333 | 4.58% | 17 | 0.23% | 28 | 0.38% | 3 | 0.04% | 1,475 | 20.27% | 7,276 |
| Philadelphia | 347,457 | 77.73% | 54,213 | 12.13% | 44,230 | 9.89% | 142 | 0.03% | 364 | 0.08% | 616 | 0.14% | 293,244 | 65.60% | 447,022 |
| Pike | 1,581 | 54.20% | 993 | 34.04% | 329 | 11.28% | 7 | 0.24% | 5 | 0.17% | 2 | 0.07% | 588 | 20.16% | 2,917 |
| Potter | 4,087 | 65.49% | 1,161 | 18.60% | 925 | 14.82% | 16 | 0.26% | 42 | 0.67% | 10 | 0.16% | 2,926 | 46.88% | 6,241 |
| Schuylkill | 34,578 | 64.44% | 10,111 | 18.84% | 8,533 | 15.90% | 170 | 0.32% | 83 | 0.15% | 181 | 0.34% | 24,467 | 45.60% | 53,656 |
| Snyder | 3,055 | 72.00% | 970 | 22.86% | 210 | 4.95% | 2 | 0.05% | 4 | 0.09% | 2 | 0.05% | 2,085 | 49.14% | 4,243 |
| Somerset | 12,389 | 72.74% | 2,315 | 13.59% | 1,974 | 11.59% | 204 | 1.20% | 117 | 0.69% | 33 | 0.19% | 10,074 | 59.15% | 17,032 |
| Sullivan | 1,668 | 59.76% | 913 | 32.71% | 155 | 5.55% | 7 | 0.25% | 47 | 1.68% | 1 | 0.04% | 755 | 27.05% | 2,791 |
| Susquehanna | 7,266 | 67.38% | 2,208 | 20.47% | 1,223 | 11.34% | 3 | 0.03% | 71 | 0.66% | 13 | 0.12% | 5,058 | 46.90% | 10,784 |
| Tioga | 8,452 | 81.22% | 1,271 | 12.21% | 541 | 5.20% | 16 | 0.15% | 121 | 1.16% | 5 | 0.05% | 7,181 | 69.01% | 10,406 |
| Union | 3,707 | 71.59% | 1,209 | 23.35% | 236 | 4.56% | 6 | 0.12% | 20 | 0.39% | 0 | 0.00% | 2,498 | 48.24% | 5,178 |
| Venango | 10,841 | 74.29% | 1,886 | 12.92% | 1,496 | 10.25% | 131 | 0.90% | 232 | 1.59% | 6 | 0.04% | 8,955 | 61.37% | 14,592 |
| Warren | 8,502 | 70.93% | 2,161 | 18.03% | 841 | 7.02% | 40 | 0.33% | 422 | 3.52% | 20 | 0.17% | 6,341 | 52.90% | 11,986 |
| Washington | 22,315 | 60.64% | 6,706 | 18.22% | 7,089 | 19.27% | 309 | 0.84% | 151 | 0.41% | 227 | 0.62% | 15,226[lower-alpha 2] | 41.38% | 36,797 |
| Wayne | 5,578 | 72.87% | 1,477 | 19.29% | 513 | 6.70% | 16 | 0.21% | 64 | 0.84% | 7 | 0.09% | 4,101 | 53.57% | 7,655 |
| Westmoreland | 34,522 | 55.22% | 10,223 | 16.35% | 13,403 | 21.44% | 3,617 | 5.79% | 538 | 0.86% | 211 | 0.34% | 21,119[lower-alpha 2] | 33.78% | 62,514 |
| Wyoming | 3,213 | 68.06% | 1,194 | 25.29% | 236 | 5.00% | 2 | 0.04% | 71 | 1.50% | 5 | 0.11% | 2,019 | 42.77% | 4,721 |
| York | 23,044 | 56.15% | 15,600 | 38.01% | 2,146 | 5.23% | 74 | 0.18% | 166 | 0.40% | 9 | 0.02% | 7,444 | 18.14% | 41,039 |
| Totals | 1,401,481 | 65.34% | 409,192 | 19.08% | 307,567 | 14.34% | 13,035 | 0.61% | 9,779 | 0.46% | 3,796 | 0.18% | 992,289 | 46.26% | 2,144,850 |
Notes
References
- ↑ "1924 Presidential Election Statistics". Dave Leip’s Atlas of U.S. Presidential Elections. Retrieved 2018-03-05.
- ↑ "1924 Presidential General Election Results – Pennsylvania". Dave Leip’s U.S. Election Atlas. Retrieved 2018-03-17.
- ↑ Pennsylvania Bureau of Publications, ‘Official Vote of Pennsylvania for Presidential Electors, 1924,’ Pennsylvania State Manual 1925-26 (Harrisburg, 1925)
| Candidates | 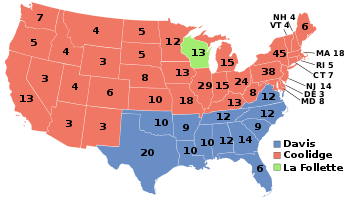 | |
|---|---|---|
| General articles |
| |
| Local results |
| |
| Other 1924 elections | ||