United States presidential election in Pennsylvania, 1940
|
| ||||||||||||||||||||||||||
| ||||||||||||||||||||||||||
| ||||||||||||||||||||||||||
 County results | ||||||||||||||||||||||||||
| ||||||||||||||||||||||||||

The 1940 United States presidential election in Pennsylvania took place on November 5, 1940. Voters chose 36 representatives, or electors to the Electoral College, who voted for president and vice president.
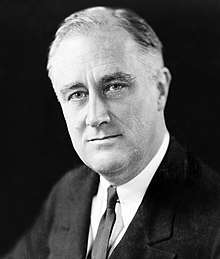
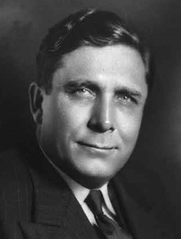
Pennsylvania voted to give Democratic nominee, President Franklin D. Roosevelt an unprecedented third term, over the Republican nominee, corporate lawyer Wendell Willkie, a dark horse candidate who had never before run for a political office. Roosevelt won Pennsylvania by a margin of 6.9 percent.
Results
| United States presidential election in Pennsylvania, 1940[1] | |||||
|---|---|---|---|---|---|
| Party | Candidate | Votes | Percentage | Electoral votes | |
| Democratic | Franklin D. Roosevelt | 2,171,035 | 53.23% | 36 | |
| Republican | Wendell Willkie | 1,889,848 | 46.33% | 0 | |
| Socialist | Norman Thomas | 10,967 | 0.27% | 0 | |
| Communist | Earl Browder | 4,519 | 0.11% | 0 | |
| Industrial Government | John Aiken | 1,518 | 0.04% | 0 | |
| Write-ins | Write-ins | 827 | 0.02% | 0 | |
| Totals | 4,078,714 | 100.00% | 36 | ||
Results by county
| Franklin Delano Roosevelt Democratic |
Wendell Lewis Willkie Republican |
Various candidates Other parties |
Margin | Total votes cast[2] | |||||
|---|---|---|---|---|---|---|---|---|---|
| County | # | % | # | % | # | % | # | % | # |
| Adams | 7,354 | 46.01% | 8,609 | 53.86% | 20 | 0.13% | -1,255 | -7.85% | 15,983 |
| Allegheny | 367,926 | 58.03% | 263,285 | 41.52% | 2,849 | 0.45% | 104,641 | 16.50% | 634,060 |
| Armstrong | 12,144 | 45.44% | 14,524 | 54.34% | 60 | 0.22% | -2,380 | -8.90% | 26,728 |
| Beaver | 33,609 | 57.78% | 24,324 | 41.81% | 239 | 0.41% | 9,285 | 15.96% | 58,172 |
| Bedford | 7,388 | 45.32% | 8,864 | 54.38% | 49 | 0.30% | -1,476 | -9.05% | 16,301 |
| Berks | 53,301 | 61.31% | 32,111 | 36.94% | 1,522 | 1.75% | 21,190 | 24.37% | 86,934 |
| Blair | 21,573 | 44.65% | 26,639 | 55.13% | 106 | 0.22% | -5,066 | -10.48% | 48,318 |
| Bradford | 6,605 | 30.75% | 14,826 | 69.02% | 49 | 0.23% | -8,221 | -38.27% | 21,480 |
| Bucks | 25,169 | 54.75% | 20,586 | 44.78% | 212 | 0.46% | 4,583 | 9.97% | 45,967 |
| Butler | 13,875 | 41.52% | 19,450 | 58.20% | 96 | 0.29% | -5,575 | -16.68% | 33,421 |
| Cambria | 42,894 | 58.44% | 30,306 | 41.29% | 193 | 0.26% | 12,588 | 17.15% | 73,393 |
| Cameron | 1,450 | 44.60% | 1,793 | 55.15% | 8 | 0.25% | -343 | -10.55% | 3,251 |
| Carbon | 12,777 | 54.50% | 10,618 | 45.29% | 51 | 0.22% | 2,159 | 9.21% | 23,446 |
| Centre | 9,869 | 47.90% | 10,665 | 51.77% | 68 | 0.33% | -796 | -3.86% | 20,602 |
| Chester | 22,473 | 44.18% | 28,222 | 55.48% | 174 | 0.34% | -5,749 | -11.30% | 50,869 |
| Clarion | 6,564 | 41.99% | 9,035 | 57.79% | 34 | 0.22% | -2,471 | -15.81% | 15,633 |
| Clearfield | 17,705 | 53.23% | 15,407 | 46.32% | 148 | 0.44% | 2,298 | 6.91% | 33,260 |
| Clinton | 7,419 | 54.03% | 6,291 | 45.81% | 22 | 0.16% | 1,128 | 8.21% | 13,732 |
| Columbia | 12,523 | 56.76% | 9,518 | 43.14% | 21 | 0.10% | 3,005 | 13.62% | 22,062 |
| Crawford | 10,197 | 38.92% | 15,891 | 60.65% | 115 | 0.44% | -5,694 | -21.73% | 26,203 |
| Cumberland | 15,758 | 50.64% | 15,297 | 49.16% | 61 | 0.20% | 461 | 1.48% | 31,116 |
| Dauphin | 38,305 | 47.30% | 42,394 | 52.35% | 276 | 0.34% | -4,089 | -5.05% | 80,975 |
| Delaware | 60,225 | 42.74% | 80,158 | 56.88% | 534 | 0.38% | -19,933 | -14.15% | 140,917 |
| Elk | 6,920 | 49.78% | 6,949 | 49.99% | 31 | 0.22% | -29 | -0.21% | 13,900 |
| Erie | 31,735 | 46.19% | 36,608 | 53.29% | 355 | 0.52% | -4,873 | -7.09% | 68,698 |
| Fayette | 41,960 | 63.47% | 23,908 | 36.16% | 246 | 0.37% | 18,052 | 27.30% | 66,114 |
| Forest | 919 | 33.59% | 1,811 | 66.19% | 6 | 0.22% | -892 | -32.60% | 2,736 |
| Franklin | 12,713 | 49.21% | 13,084 | 50.64% | 39 | 0.15% | -371 | -1.44% | 25,836 |
| Fulton | 1,982 | 48.40% | 2,108 | 51.48% | 5 | 0.12% | -126 | -3.08% | 4,095 |
| Greene | 10,214 | 60.17% | 6,726 | 39.63% | 34 | 0.20% | 3,488 | 20.55% | 16,974 |
| Huntingdon | 5,631 | 37.97% | 9,141 | 61.64% | 58 | 0.39% | -3,510 | -23.67% | 14,830 |
| Indiana | 12,035 | 43.53% | 15,547 | 56.23% | 68 | 0.25% | -3,512 | -12.70% | 27,650 |
| Jefferson | 8,559 | 41.37% | 12,081 | 58.40% | 47 | 0.23% | -3,522 | -17.03% | 20,687 |
| Juniata | 3,579 | 50.46% | 3,507 | 49.44% | 7 | 0.10% | 72 | 1.02% | 7,093 |
| Lackawanna | 71,343 | 56.32% | 54,931 | 43.36% | 411 | 0.32% | 16,412 | 12.95% | 126,685 |
| Lancaster | 32,210 | 41.62% | 44,939 | 58.07% | 245 | 0.32% | -12,729 | -16.45% | 77,394 |
| Lawrence | 18,814 | 49.07% | 19,361 | 50.50% | 167 | 0.44% | -547 | -1.43% | 38,342 |
| Lebanon | 13,315 | 49.61% | 13,449 | 50.11% | 73 | 0.27% | -134 | -0.50% | 26,837 |
| Lehigh | 33,007 | 52.44% | 29,584 | 47.00% | 356 | 0.57% | 3,423 | 5.44% | 62,947 |
| Luzerne | 101,577 | 55.85% | 79,685 | 43.81% | 622 | 0.34% | 21,892 | 12.04% | 181,884 |
| Lycoming | 18,363 | 46.05% | 21,423 | 53.72% | 91 | 0.23% | -3,060 | -7.67% | 39,877 |
| McKean | 6,911 | 31.63% | 14,822 | 67.84% | 115 | 0.53% | -7,911 | -36.21% | 21,848 |
| Mercer | 16,968 | 44.42% | 21,058 | 55.12% | 175 | 0.46% | -4,090 | -10.71% | 38,201 |
| Mifflin | 6,993 | 52.31% | 6,352 | 47.51% | 24 | 0.18% | 641 | 4.79% | 13,369 |
| Monroe | 6,670 | 52.57% | 6,001 | 47.30% | 16 | 0.13% | 669 | 5.27% | 12,687 |
| Montgomery | 49,409 | 40.15% | 73,250 | 59.52% | 403 | 0.33% | -23,841 | -19.37% | 123,062 |
| Montour | 3,080 | 53.04% | 2,723 | 46.89% | 4 | 0.07% | 357 | 6.15% | 5,807 |
| Northampton | 33,304 | 56.49% | 25,385 | 43.06% | 266 | 0.45% | 7,919 | 13.43% | 58,955 |
| Northumberland | 26,315 | 53.31% | 22,914 | 46.42% | 134 | 0.27% | 3,401 | 6.89% | 49,363 |
| Perry | 4,601 | 43.87% | 5,877 | 56.03% | 11 | 0.10% | -1,276 | -12.17% | 10,489 |
| Philadelphia | 532,149 | 59.69% | 354,878 | 39.81% | 4,459 | 0.50% | 177,271 | 19.88% | 891,486 |
| Pike | 1,818 | 41.08% | 2,596 | 58.65% | 12 | 0.27% | -778 | -17.58% | 4,426 |
| Potter | 2,731 | 34.30% | 5,205 | 65.36% | 27 | 0.34% | -2,474 | -31.07% | 7,963 |
| Schuylkill | 48,739 | 52.71% | 43,505 | 47.05% | 231 | 0.25% | 5,234 | 5.66% | 92,475 |
| Snyder | 2,478 | 30.17% | 5,722 | 69.66% | 14 | 0.17% | -3,244 | -39.49% | 8,214 |
| Somerset | 14,085 | 44.71% | 17,369 | 55.13% | 52 | 0.17% | -3,284 | -10.42% | 31,506 |
| Sullivan | 1,626 | 44.04% | 2,059 | 55.77% | 7 | 0.19% | -433 | -11.73% | 3,692 |
| Susquehanna | 5,383 | 36.04% | 9,520 | 63.73% | 35 | 0.23% | -4,137 | -27.69% | 14,938 |
| Tioga | 4,434 | 27.51% | 11,645 | 72.24% | 40 | 0.25% | -7,211 | -44.74% | 16,119 |
| Union | 2,220 | 28.27% | 5,612 | 71.45% | 22 | 0.28% | -3,392 | -43.19% | 7,854 |
| Venango | 6,873 | 27.89% | 17,728 | 71.95% | 38 | 0.15% | -10,855 | -44.06% | 24,639 |
| Warren | 5,825 | 34.39% | 11,016 | 65.04% | 97 | 0.57% | -5,191 | -30.65% | 16,938 |
| Washington | 50,829 | 63.43% | 29,026 | 36.22% | 285 | 0.36% | 21,803 | 27.21% | 80,140 |
| Wayne | 3,460 | 27.26% | 9,203 | 72.50% | 30 | 0.24% | -5,743 | -45.25% | 12,693 |
| Westmoreland | 64,567 | 59.90% | 42,643 | 39.56% | 577 | 0.54% | 21,924 | 20.34% | 107,787 |
| Wyoming | 2,548 | 32.51% | 5,273 | 67.28% | 16 | 0.20% | -2,725 | -34.77% | 7,837 |
| York | 39,543 | 56.56% | 30,228 | 43.23% | 146 | 0.21% | 9,315 | 13.32% | 69,917 |
| Totals | 2,175,538 | 53.35% | 1,885,265 | 46.23% | 17,004 | 0.42% | 290,273 | 7.12% | 4,077,807 |
References
- ↑ David Leip. "1940 Presidential General Election Results – Pennsylvania". Dave Leip’s U.S. Election Atlas. Retrieved 2018-03-24.
- ↑ Scammon, Richard M. (compiler); America at the Polls: A Handbook of Presidential Election Statistics 1920-1964; pp. 381-382 ISBN 0405077114
| Candidates | 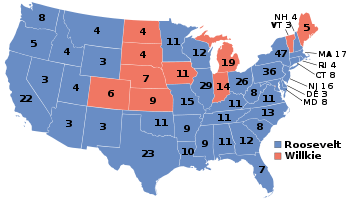 | |
|---|---|---|
| General articles |
| |
| Local results |
| |
| Other 1940 elections | ||
This article is issued from
Wikipedia.
The text is licensed under Creative Commons - Attribution - Sharealike.
Additional terms may apply for the media files.