Cayuga County, New York
| Cayuga County, New York | ||
|---|---|---|
| County | ||
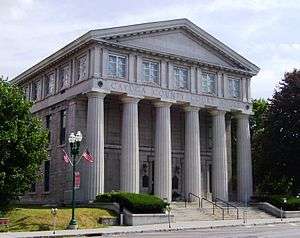 Cayuga County Courthouse | ||
| ||
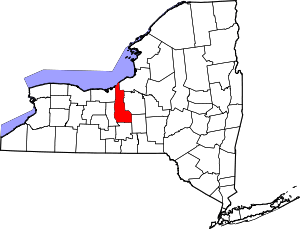 Location in the U.S. state of New York | ||
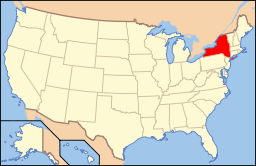 New York's location in the U.S. | ||
| Founded | 1799 | |
| Named for | Cayuga people | |
| Seat | Auburn | |
| Largest city | Auburn | |
| Area | ||
| • Total | 864 sq mi (2,238 km2) | |
| • Land | 692 sq mi (1,792 km2) | |
| • Water | 172 sq mi (445 km2), 20% | |
| Population | ||
| • (2010) | 80,026 | |
| • Density | 116/sq mi (45/km2) | |
| Congressional district | 24th | |
| Time zone | Eastern: UTC−5/−4 | |
| Website |
www | |

Cayuga County is a county in the U.S. state of New York. As of the 2010 census, the population was 80,026.[1] Its county seat is Auburn.[2] The county was named for one of the tribes of Indians in the Iroquois Confederation.
Cayuga County comprises the Auburn, NY Micropolitan Statistical Area, which is also included in the Syracuse-Auburn, NY Combined Statistical Area.
History
When counties were established in the Province of New York in 1683, the present Cayuga County was part of Albany County. This was an enormous county, including the northern part of the present state of New York and all of the present state of Vermont and, in theory, extending westward to the Pacific Ocean. This county was reduced in size on July 3, 1766 by the creation of Cumberland County, and further on March 16, 1770, by the creation of Gloucester County, both containing territory now in Vermont.
On March 12, 1772, what was left of Albany County was split into three parts, one remaining under the name Albany County. One of the other pieces, Tryon County, contained the western portion (and thus, since no western boundary was specified, theoretically still extended west to the Pacific). The eastern boundary of Tryon County was approximately five miles west of the present city of Schenectady, and the county included the western part of the Adirondack Mountains and the area west of the West Branch of the Delaware River. The area then designated as Tryon County now includes 37 counties of New York State. The county was named for William Tryon, colonial governor of New York. In the years prior to 1776, most of the Loyalists in Tryon County fled to Canada.
In 1784, following the peace treaty that ended the American Revolutionary War, the name of Tryon County was changed to Montgomery County in honor of the general, Richard Montgomery, who had captured several places in Canada and died attempting to capture the city of Quebec, replacing the name of the hated British governor.
In 1789, Montgomery County was reduced in size by the splitting off of Ontario County. The actual area split off from Montgomery County was much larger than the present county, also including the present Allegany, Cattaraugus, Chautauqua, Erie, Genesee, Livingston, Monroe, Niagara, Orleans, Steuben, Wyoming, Yates, and part of Schuyler and Wayne Counties. Harriet Tubman visited Auburn, New York, located in Cayuga County, in 1887 with her daughter (adopted) and her 2nd husband.
Herkimer County was one of three counties split off from Montgomery County (the others being Otsego and Tioga Counties) in 1791.
Onondaga County was formed in 1794 by the splitting of Herkimer County.
Cayuga County was formed in 1799 by the splitting of Onondaga County. This county was, however, much larger than the present Cayuga County. It then included the present Seneca and Tompkins Counties.
In 1804, Seneca County was formed by the splitting of Cayuga County. Then in 1817, in turn, a portion of Seneca County was combined with a piece of the remainder of Cayuga County to form Tompkins County.
In the late 19th and early 20th century, this region attracted European immigrants who developed farms or took over existing ones, particularly from Italy and Poland.
Geography
According to the U.S. Census Bureau, the county has a total area of 864 square miles (2,240 km2), of which 692 square miles (1,790 km2) is land and 172 square miles (450 km2) (20%) is water.[3]
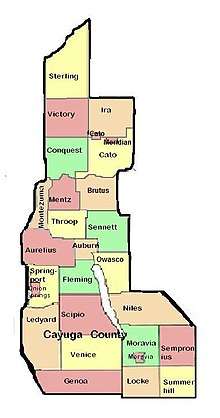
Cayuga County is located in the west central part of the state, in the Finger Lakes region. Owasco Lake is in the center of the county, and Cayuga Lake forms part of the western boundary. Lake Ontario is on the northern border, and Skaneateles Lake and Cross Lake form part of the eastern border. Cayuga County has more waterfront land than any other county in the state not adjacent to the Atlantic Ocean.
Adjacent counties
- Oswego County – northeast
- Onondaga County – east
- Cortland County – southeast
- Tompkins County – south
- Seneca County – west
- Wayne County – west
- Prince Edward County, Ontario – north
Major highways
National protected area
Demographics
| Historical population | |||
|---|---|---|---|
| Census | Pop. | %± | |
| 1800 | 15,871 | — | |
| 1810 | 29,843 | 88.0% | |
| 1820 | 38,897 | 30.3% | |
| 1830 | 47,948 | 23.3% | |
| 1840 | 50,338 | 5.0% | |
| 1850 | 55,458 | 10.2% | |
| 1860 | 55,767 | 0.6% | |
| 1870 | 59,550 | 6.8% | |
| 1880 | 65,081 | 9.3% | |
| 1890 | 65,302 | 0.3% | |
| 1900 | 66,234 | 1.4% | |
| 1910 | 67,106 | 1.3% | |
| 1920 | 65,221 | −2.8% | |
| 1930 | 64,751 | −0.7% | |
| 1940 | 65,508 | 1.2% | |
| 1950 | 70,136 | 7.1% | |
| 1960 | 73,942 | 5.4% | |
| 1970 | 77,439 | 4.7% | |
| 1980 | 79,894 | 3.2% | |
| 1990 | 82,313 | 3.0% | |
| 2000 | 81,963 | −0.4% | |
| 2010 | 80,026 | −2.4% | |
| Est. 2016 | 77,861 | [4] | −2.7% |
| U.S. Decennial Census[5] 1790–1960[6] 1900–1990[7] 1990–2000[8] 2010–2013[1] | |||
As of the census[9] of 2000, there were 81,963 people, 30,558 households, and 20,840 families residing in the county. The population density was 118 people per square mile (46/km²). There were 35,477 housing units at an average density of 51 per square mile (20/km²). The racial makeup of the county was 93.34% White, 3.99% Black or African American, 0.31% Native American, 0.42% Asian, 0.02% Pacific Islander, 0.88% from other races, and 1.03% from two or more races. 1.97% of the population were Hispanic or Latino of any race. 16.3% were of Irish, 16.0% English, 15.7% Italian, 11.3% German, 9.5% American and 6.3% Polish ancestry according to Census 2000.[10] 94.9% spoke English, 2.0% Spanish and 1.0% Italian as their first language.
There were 30,558 households out of which 32.60% had children under the age of 18 living with them, 52.00% were married couples living together, 11.00% had a female householder with no husband present, and 31.80% were non-families. 26.20% of all households were made up of individuals and 11.90% had someone living alone who was 65 years of age or older. The average household size was 2.53 and the average family size was 3.04.
In the county, the population was spread out with 25.10% under the age of 18, 8.20% from 18 to 24, 29.70% from 25 to 44, 22.60% from 45 to 64, and 14.40% who were 65 years of age or older. The median age was 37 years. For every 100 females there were 102.20 males. For every 100 females age 18 and over, there were 101.80 males.
The median income for a household in the county was $37,487, and the median income for a family was $44,973. Males had a median income of $33,356 versus $23,919 for females. The per capita income for the county was $18,003. About 7.80% of families and 11.10% of the population were below the poverty line, including 14.90% of those under age 18 and 8.20% of those age 65 or over.
Government and politics
| Year | Republican | Democratic | Third Parties |
|---|---|---|---|
| 2016 | 52.4% 17,384 | 40.8% 13,522 | 6.8% 2,266 |
| 2012 | 43.2% 13,454 | 54.6% 17,007 | 2.3% 700 |
| 2008 | 44.8% 15,243 | 53.3% 18,128 | 1.9% 651 |
| 2004 | 49.2% 17,743 | 48.6% 17,534 | 2.2% 775 |
| 2000 | 44.1% 14,988 | 50.1% 17,031 | 5.8% 1,959 |
| 1996 | 34.8% 11,093 | 49.8% 15,879 | 15.4% 4,922 |
| 1992 | 33.8% 12,065 | 36.7% 13,088 | 29.5% 10,518 |
| 1988 | 52.5% 16,934 | 46.6% 15,044 | 1.0% 307 |
| 1984 | 63.5% 21,451 | 36.1% 12,207 | 0.4% 121 |
| 1980 | 54.8% 17,945 | 35.7% 11,708 | 9.5% 3,103 |
| 1976 | 59.3% 19,775 | 40.0% 13,348 | 0.7% 220 |
| 1972 | 67.1% 22,774 | 32.7% 11,097 | 0.2% 81 |
| 1968 | 49.5% 16,167 | 44.7% 14,604 | 5.8% 1,895 |
| 1964 | 32.2% 11,453 | 67.7% 24,090 | 0.1% 23 |
| 1960 | 54.2% 20,437 | 45.8% 17,257 | 0.1% 28 |
| 1956 | 72.1% 26,503 | 27.9% 10,268 | 0.0% 0 |
| 1952 | 68.1% 25,037 | 31.8% 11,695 | 0.1% 46 |
| 1948 | 56.4% 19,017 | 42.4% 14,317 | 1.2% 413 |
| 1944 | 57.3% 18,680 | 42.4% 13,849 | 0.3% 100 |
| 1940 | 59.8% 21,032 | 39.8% 13,985 | 0.4% 156 |
| 1936 | 60.9% 20,203 | 36.6% 12,158 | 2.5% 839 |
| 1932 | 55.7% 17,280 | 41.8% 12,989 | 2.5% 774 |
| 1928 | 62.1% 20,202 | 36.2% 11,787 | 1.7% 536 |
| 1924 | 63.7% 17,252 | 27.2% 7,369 | 9.2% 2,479 |
| 1920 | 67.7% 15,234 | 28.2% 6,343 | 4.1% 933 |
| 1916 | 53.3% 7,831 | 43.5% 6,391 | 3.2% 467 |
| 1912 | 42.0% 5,788 | 34.1% 4,691 | 23.9% 3,298 |
| 1908 | 58.3% 9,699 | 34.8% 5,789 | 6.8% 1,136 |
| 1904 | 62.9% 10,708 | 33.5% 5,707 | 3.6% 613 |
| 1900 | 60.0% 10,328 | 36.8% 6,330 | 3.3% 559 |
| 1896 | 61.4% 10,024 | 35.8% 5,846 | 2.8% 460 |
| 1892 | 54.0% 8,341 | 38.8% 5,999 | 7.3% 1,121 |
| 1888 | 57.8% 9,646 | 38.2% 6,380 | 4.0% 668 |
| 1884 | 56.6% 9,205 | 37.2% 6,041 | 6.2% 1,012 |
Cayuga County is considered a swing county in national elections. In 2000, Democrat Al Gore won Cayuga County with 50% of the vote to George W. Bush's 44%. In 2004, however, incumbent President Bush defeated John Kerry by a narrow margin of only 0.58%, or 49.22% to 48.64%. In 2008 it was won by Democrat Barack Obama with 53% of the vote, to Republican John McCain's 45%.
In statewide elections it has gone for Democrats: both Eliot Spitzer and Hillary Clinton won it in 2006 with more than 60% of the vote. In 2010, Democrat Andrew Cuomo defeated Republican Carl Paladino 53% to 40% for the governorship, with 3% going to Green Party candidate Howie Hawkins. Also in 2010, both Democratic US Senators, Kirsten Gillibrand and Chuck Schumer, carried Cayuga County. Gillibrand won 54% of the vote, while Schumer won 61%.
The Cayuga County Legislature consists of 15 members, each of whom are elected from single-member districts.
| Voter registration as of April 1, 2016[12] | |||||
|---|---|---|---|---|---|
| Party | Active voters | Inactive voters | Total voters | Percentage | |
| Democratic | 14,745 | 1,341 | 16,086 | 33.08% | |
| Republican | 16,299 | 1,122 | 17,421 | 35.83% | |
| Unaffiliated | 9,517 | 1,091 | 10,608 | 21.82% | |
| Other[nb 1] | 4,069 | 438 | 4,507 | 9.27% | |
| Total | 44,630 | 3,992 | 48,622 | 100% | |
Communities
City
- Auburn (county seat)
Towns
Villages
Census-designated place
Hamlets
Notable people
- William H. Carpenter (1821-1885), U.S. Consul to Foochow, China 1861–1865 and a founding member of Cayuga County Historical Society in 1877.
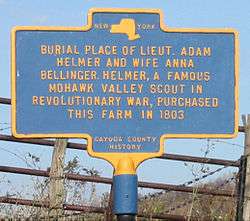
- Adam Helmer, (c.1754 – April 9, 1830), American Revolutionary War hero among those of the Mohawk Valley and surrounding regions of New York State.
See also
Notes
- ↑ Included are voters affiliated with the Conservative Party, Green Party, Working Families Party, Independence Party, Women's Equality Party, Reform Party, and other small parties.
References
- 1 2 "State & County QuickFacts". United States Census Bureau. Retrieved October 11, 2013.
- ↑ "Find a County". National Association of Counties. Archived from the original on 2011-05-31. Retrieved 2011-06-07.
- ↑ "2010 Census Gazetteer Files". United States Census Bureau. August 22, 2012. Archived from the original on May 19, 2014. Retrieved January 3, 2015.
- ↑ "Counties Population Totals Tables: 2010-2016, Annual Estimates of the Resident Population for Counties: April 1, 2010 to July 1, 2016". Retrieved June 10, 2017.
- ↑ "U.S. Decennial Census". United States Census Bureau. Archived from the original on May 12, 2015. Retrieved January 3, 2015.
- ↑ "Historical Census Browser". University of Virginia Library. Retrieved January 3, 2015.
- ↑ "Population of Counties by Decennial Census: 1900 to 1990". United States Census Bureau. Retrieved January 3, 2015.
- ↑ "Census 2000 PHC-T-4. Ranking Tables for Counties: 1990 and 2000" (PDF). United States Census Bureau. Retrieved January 3, 2015.
- ↑ "American FactFinder". United States Census Bureau. Archived from the original on 2013-09-11. Retrieved 2008-01-31.
- ↑ "American FactFinder". Factfinder.census.gov. Retrieved 2013-11-12.
- ↑ Leip, David. "Dave Leip's Atlas of U.S. Presidential Elections". uselectionatlas.org. Retrieved 29 March 2018.
- ↑ "NYSVoter Enrollment by County, Party Affiliation and Status" (PDF). New York State Board of Elections. April 2016. Archived from the original (PDF) on July 30, 2016. Retrieved July 30, 2016.
External links
| Wikimedia Commons has media related to Cayuga County, New York. |
- Official website
- Cayuga County NYGenWeb Project
- Cayuga County history pages
- Summary early history of counties and towns of Cayuga County
- Area photos, maps, history and genealogy
- Cayuga County Sheriff
- Cayuga County at Curlie (based on DMOZ)
- Cayuga Community College
- Cayuga County Historical Aerial Photographs of New York , Cornell University Library & Cornell Institute for Resource Information Sciences
- Genealogy and history resources for Cayuga County
Places adjacent to Cayuga County, New York | ||||||||||
|---|---|---|---|---|---|---|---|---|---|---|
| ||||||||||
Municipalities and communities of Cayuga County, New York, United States | ||
|---|---|---|
| City | | |
| Towns | ||
| Villages | ||
| CDP | ||
| Other hamlets | ||
| Footnotes | ‡This populated place also has portions in an adjacent county or counties | |