United States presidential election in New York, 1992
|
| |||||||||||||||||||||||||||||||||
| |||||||||||||||||||||||||||||||||
| |||||||||||||||||||||||||||||||||
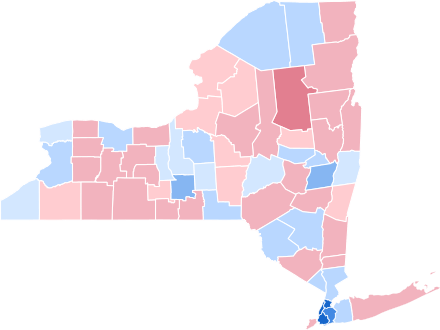 County Results
Clinton—70-80%
Clinton—60-70%
Clinton—50-60%
Clinton—40-50%
Clinton—<40%
Bush—<40%
Bush—40-50%
Bush—50-60% | |||||||||||||||||||||||||||||||||
| |||||||||||||||||||||||||||||||||

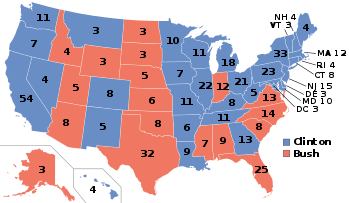
The 1992 United States presidential election in New York took place on November 3, 1992, as part of the 1992 United States presidential election. Voters chose thirty-three representatives, or electors to the Electoral College, who voted for president and vice president.
New York was won by the Democratic candidate, Governor Bill Clinton of Arkansas) who received 49.73 percent of the vote over incumbent Republican President George H.W. Bush of Texas, who received 33.88 percent. Independent candidate Ross Perot, a billionaire Texas businessman, finished in third, with 15.75 percent of the popular vote.[1] Clinton ultimately won the national election, defeating incumbent President Bush.[2]
Clinton's double-digit 15.85 percent margin of victory would mark the beginning of a dramatic shift toward the Democratic Party in New York, from a Democratic leaning swing state to a solidly blue state that Democrats would carry by landslide margins in every election since. In the preceding six elections, the state had gone Republican three times and Democratic three times, all but once decided by a single-digit margin. In the six elections that have followed 1992, Democratic presidential candidates have received between 58 percent and 64 percent of the vote, making it one of the most overwhelmingly Democratic states in the nation, largely as a result of trends that began in 1992.
Despite Ross Perot’s strong showing as a third-party candidate, taking votes away from the major party nominees statewide and nationally, Clinton increased the total Democratic vote share in the five heavily populated boroughs of New York City to 69 percent in 1992, compared to the 66 percent received by Democrat Michael Dukakis in the 1988 election, while Bush fell from 33 percent in 1988 to only 24 percent in his re-election bid.
In addition, Clinton also picked up wins in heavily populated suburban counties around New York City that had long been reliably Republican, namely Westchester County just north of the city, and Nassau County on Long Island, which have remained loyally Democratic in every election that has followed, as well as Rockland County. Bush only carried Suffolk County by 1.5 percent, down from a landslide 21.8 percent victory margin in that county in 1988. Republican dominance of the populous suburbs had been crucial to previous Republican victories in the state in order to overcome the massive Democratic advantage in New York City. As the city became even more Democratic while downstate suburban voters defected from the GOP to the Democrats, Republican hopes of competing in New York State would vanish following this election.
Bush performed more strongly in traditionally Republican upstate New York, where he won most rural counties, although he lost a number of counties he had won in 1988 to Clinton. Clinton won a handful of rural upstate counties, and more significantly scored strong wins in counties home to the cities of Albany, Buffalo, Rochester, Syracuse, and the college town of Ithaca, all of which have become reliable Democratic bastions in upstate New York.
Clinton's victory margin would make New York State about 10 percentage points more Democratic than the nation as a whole in the 1992 election. As of the 2016 presidential election, this is the last election in which Clinton County and Columbia County voted for a Republican presidential candidate.[3]
Results
| United States presidential election in New York, 1992[1] | |||||
|---|---|---|---|---|---|
| Party | Candidate | Votes | Percentage | Electoral votes | |
| Democratic | Bill Clinton | 3,346,894 | 48.32% | ||
| Liberal | Bill Clinton | 97,556 | 1.41% | ||
| Total | Bill Clinton | 3,444,450 | 49.73% | 33 | |
| Republican | George H.W. Bush | 2,041,690 | 29.47% | ||
| Conservative | George H.W. Bush | 177,000 | 2.56% | ||
| Right to Life | George H.W. Bush | 127,959 | 1.85% | ||
| Total | George H.W. Bush | 2,346,649 | 33.88% | 0 | |
| Independent | Ross Perot | 1,090,721 | 15.75% | 0 | |
| Socialist Workers | James Warren | 15,924 | 0.23% | 0 | |
| Libertarian | Andre Marrou | 13,451 | 0.19% | 0 | |
| New Alliance | Lenora Fulani | 11,269 | 0.16% | 0 | |
| Natural Law | Dr. John Hagelin (write-in) | 4,017 | 0.06% | 0 | |
| Peace and Freedom | Ron Daniels (write-in) | 385 | 0.01% | 0 | |
| America First | James "Bo" Gritz (write-in) | 25 | 0.00% | 0 | |
Economic Recovery |
Lyndon LaRouche (write-in) | 18 | 0.00% | 0 | |
| Independent | J. Quinn Brisben (write-in) | 16 | 0.00% | 0 | |
| Totals | 6,926,925 | 100.0% | 33 | ||
Results by county
| William Jefferson Clinton Democratic |
George Herbert Walker Bush Republican |
Henry Ross Perot Independent |
Various candidates Other parties |
Margin | Total votes cast | ||||||
|---|---|---|---|---|---|---|---|---|---|---|---|
| County | # | % | # | % | # | % | # | % | # | % | # |
| Albany | 80,641 | 51.90% | 49,452 | 31.83% | 24,064 | 15.49% | 1,206 | 0.78% | 31,189 | 20.07% | 155,363 |
| Allegany | 4,848 | 25.90% | 8,976 | 47.95% | 4,703 | 25.12% | 192 | 1.03% | -4,128 | -22.05% | 18,719 |
| Bronx | 225,038 | 73.67% | 63,310 | 20.73% | 15,115 | 4.95% | 1,997 | 0.65% | 161,728 | 52.95% | 305,460 |
| Broome | 43,444 | 43.51% | 34,653 | 34.71% | 21,280 | 21.31% | 469 | 0.47% | 8,791 | 8.80% | 99,846 |
| Cattaraugus | 10,150 | 28.92% | 13,944 | 39.74% | 10,662 | 30.38% | 336 | 0.96% | 3,282[lower-alpha 1] | 9.35% | 35,092 |
| Cayuga | 13,088 | 36.69% | 12,065 | 33.82% | 10,279 | 28.82% | 239 | 0.67% | 1,023 | 2.87% | 35,671 |
| Chautauqua | 22,645 | 36.07% | 21,222 | 33.80% | 18,455 | 29.39% | 467 | 0.74% | 1,423 | 2.27% | 62,789 |
| Chemung | 15,099 | 38.58% | 16,088 | 41.11% | 7,493 | 19.15% | 455 | 1.16% | -989 | -2.53% | 39,135 |
| Chenango | 8,017 | 36.80% | 8,114 | 37.24% | 5,356 | 24.58% | 300 | 1.38% | -97 | -0.45% | 21,787 |
| Clinton | 12,881 | 40.27% | 13,455 | 42.06% | 5,389 | 16.85% | 263 | 0.82% | -574 | -1.79% | 31,988 |
| Columbia | 11,368 | 39.12% | 11,568 | 39.81% | 5,829 | 20.06% | 291 | 1.00% | -200 | -0.69% | 29,056 |
| Cortland | 7,815 | 37.48% | 7,782 | 37.32% | 5,098 | 24.45% | 156 | 0.75% | 33 | 0.16% | 20,851 |
| Delaware | 7,152 | 34.84% | 8,829 | 43.01% | 4,404 | 21.45% | 145 | 0.71% | -1,677 | -8.17% | 20,530 |
| Dutchess | 41,655 | 36.12% | 46,709 | 40.50% | 26,320 | 22.82% | 644 | 0.56% | -5,054 | -4.38% | 115,328 |
| Erie | 196,233 | 43.46% | 129,444 | 28.67% | 123,358 | 27.32% | 2,461 | 0.55% | 66,789 | 14.79% | 451,496 |
| Essex | 6,717 | 35.40% | 8,278 | 43.63% | 3,784 | 19.94% | 194 | 1.02% | -1,561 | -8.23% | 18,973 |
| Franklin | 7,654 | 41.68% | 6,635 | 36.13% | 3,857 | 21.00% | 219 | 1.19% | 1,019 | 5.55% | 18,365 |
| Fulton | 8,400 | 36.77% | 9,137 | 40.00% | 5,120 | 22.41% | 188 | 0.82% | -737 | -3.23% | 22,845 |
| Genesee | 8,071 | 30.78% | 11,663 | 44.47% | 6,192 | 23.61% | 299 | 1.14% | -3,592 | -13.70% | 26,225 |
| Greene | 6,924 | 32.67% | 9,390 | 44.31% | 4,689 | 22.13% | 188 | 0.89% | -2,466 | -11.64% | 21,191 |
| Hamilton | 963 | 25.23% | 2,038 | 53.39% | 793 | 20.78% | 23 | 0.60% | -1,075 | -28.16% | 3,817 |
| Herkimer | 10,880 | 36.34% | 12,052 | 40.26% | 6,866 | 22.93% | 141 | 0.47% | -1,172 | -3.91% | 29,939 |
| Jefferson | 13,380 | 35.75% | 14,227 | 38.01% | 9,461 | 25.28% | 358 | 0.96% | -847 | -2.26% | 37,426 |
| Kings (Brooklyn) | 411,183 | 70.70% | 133,344 | 22.93% | 33,014 | 5.68% | 4,053 | 0.70% | 277,839 | 47.77% | 581,594 |
| Lewis | 3,676 | 33.32% | 4,101 | 37.17% | 3,164 | 28.68% | 91 | 0.82% | -425 | -3.85% | 11,032 |
| Livingston | 8,648 | 32.25% | 12,122 | 45.21% | 5,775 | 21.54% | 269 | 1.00% | -3,474 | -12.96% | 26,814 |
| Madison | 10,099 | 34.78% | 11,293 | 38.90% | 7,391 | 25.46% | 251 | 0.86% | -1,194 | -4.11% | 29,034 |
| Monroe | 141,502 | 41.57% | 134,021 | 39.38% | 63,229 | 18.58% | 1,617 | 0.48% | 7,481 | 2.20% | 340,369 |
| Montgomery | 9,509 | 40.56% | 8,802 | 37.55% | 5,020 | 21.41% | 112 | 0.48% | 707 | 3.02% | 23,443 |
| Nassau | 282,593 | 46.38% | 246,881 | 40.52% | 77,097 | 12.65% | 2,755 | 0.45% | 35,712 | 5.86% | 609,326 |
| New York (Manhattan) | 416,142 | 78.20% | 84,501 | 15.88% | 27,689 | 5.20% | 3,786 | 0.71% | 331,641 | 62.32% | 532,118 |
| Niagara | 35,649 | 36.91% | 30,401 | 31.48% | 30,126 | 31.19% | 408 | 0.42% | 5,248 | 5.43% | 96,584 |
| Oneida | 40,966 | 37.81% | 43,806 | 40.43% | 22,717 | 20.97% | 853 | 0.79% | -2,840 | -2.62% | 108,342 |
| Onondaga | 90,645 | 42.18% | 77,642 | 36.13% | 45,175 | 21.02% | 1,445 | 0.67% | 13,003 | 6.05% | 214,907 |
| Ontario | 16,064 | 35.79% | 18,995 | 42.32% | 9,571 | 21.32% | 259 | 0.58% | -2,931 | -6.53% | 44,889 |
| Orange | 45,946 | 37.50% | 53,493 | 43.66% | 22,499 | 18.36% | 582 | 0.48% | -7,547 | -6.16% | 122,520 |
| Orleans | 4,927 | 29.41% | 7,468 | 44.57% | 4,275 | 25.52% | 84 | 0.50% | -2,541 | -15.17% | 16,754 |
| Oswego | 16,990 | 33.36% | 18,530 | 36.38% | 14,853 | 29.16% | 558 | 1.10% | -1,540 | -3.02% | 50,931 |
| Otsego | 10,471 | 39.36% | 10,141 | 38.12% | 5,841 | 21.95% | 153 | 0.58% | 330 | 1.24% | 26,606 |
| Putnam | 14,048 | 34.05% | 18,934 | 45.89% | 8,011 | 19.41% | 270 | 0.65% | -4,886 | -11.84% | 41,263 |
| Queens | 349,520 | 62.87% | 157,561 | 28.34% | 46,014 | 8.28% | 2,861 | 0.51% | 191,959 | 34.53% | 555,956 |
| Rensselaer | 29,793 | 39.95% | 28,937 | 38.80% | 15,198 | 20.38% | 652 | 0.87% | 856 | 1.15% | 74,580 |
| Richmond | 56,901 | 38.51% | 70,707 | 47.85% | 19,678 | 13.32% | 474 | 0.32% | -13,806 | -9.34% | 147,760 |
| Rockland | 56,759 | 46.59% | 49,608 | 40.72% | 15,026 | 12.33% | 438 | 0.36% | 7,151 | 5.87% | 121,831 |
| St. Lawrence | 18,197 | 43.00% | 13,901 | 32.85% | 9,758 | 23.06% | 461 | 1.09% | 4,296 | 10.15% | 42,317 |
| Saratoga | 33,011 | 36.76% | 36,917 | 41.10% | 19,091 | 21.26% | 793 | 0.88% | -3,906 | -4.35% | 89,812 |
| Schenectady | 32,335 | 43.77% | 26,258 | 35.55% | 14,838 | 20.09% | 439 | 0.59% | 6,077 | 8.23% | 73,870 |
| Schoharie | 4,997 | 35.32% | 5,678 | 40.14% | 3,327 | 23.52% | 145 | 1.02% | -681 | -4.81% | 14,147 |
| Schuyler | 2,859 | 34.87% | 3,226 | 39.35% | 2,051 | 25.02% | 63 | 0.77% | -367 | -4.48% | 8,199 |
| Seneca | 5,810 | 38.80% | 5,432 | 36.28% | 3,660 | 24.44% | 72 | 0.48% | 378 | 2.52% | 14,974 |
| Steuben | 12,043 | 29.08% | 19,761 | 47.72% | 9,378 | 22.65% | 228 | 0.55% | -7,718 | -18.64% | 41,410 |
| Suffolk | 220,811 | 38.88% | 229,467 | 40.40% | 112,973 | 19.89% | 4,704 | 0.83% | -8,656 | -1.52% | 567,955 |
| Sullivan | 13,717 | 43.36% | 11,396 | 36.02% | 6,336 | 20.03% | 186 | 0.59% | 2,321 | 7.34% | 31,635 |
| Tioga | 7,791 | 33.78% | 9,287 | 40.26% | 5,867 | 25.44% | 120 | 0.52% | -1,496 | -6.49% | 23,065 |
| Tompkins | 23,197 | 55.68% | 11,520 | 27.65% | 6,704 | 16.09% | 239 | 0.57% | 11,677 | 28.03% | 41,660 |
| Ulster | 32,886 | 40.69% | 29,223 | 36.16% | 17,952 | 22.21% | 760 | 0.94% | 3,663 | 4.53% | 80,821 |
| Warren | 9,820 | 34.14% | 12,260 | 42.62% | 6,401 | 22.25% | 286 | 0.99% | -2,440 | -8.48% | 28,767 |
| Washington | 8,429 | 33.53% | 10,305 | 41.00% | 6,143 | 24.44% | 258 | 1.03% | -1,876 | -7.46% | 25,135 |
| Wayne | 11,866 | 30.19% | 18,019 | 45.84% | 9,188 | 23.38% | 233 | 0.59% | -6,153 | -15.65% | 39,306 |
| Westchester | 184,300 | 48.65% | 151,990 | 40.12% | 39,933 | 10.54% | 2,617 | 0.69% | 32,310 | 8.53% | 378,840 |
| Wyoming | 4,045 | 24.70% | 7,324 | 44.73% | 4,837 | 29.54% | 169 | 1.03% | 2,487[lower-alpha 1] | 15.19% | 16,375 |
| Yates | 3,242 | 32.12% | 4,366 | 43.26% | 2,354 | 23.33% | 130 | 1.29% | -1,124 | -11.14% | 10,092 |
| Totals | 3,444,450 | 49.73% | 2,346,649 | 33.88% | 1,090,721 | 15.75% | 45,105 | 0.65% | 1,097,801 | 15.85% | 6,926,925 |
Notes
References
- 1 2 "1992 Presidential General Election Results - New York". U.S. Election Atlas. Retrieved 9 June 2012.
- ↑ "1992 Presidential General Election Results". U.S. Election Atlas. Retrieved 9 June 2012.
- ↑ Sullivan, Robert David; ‘How the Red and Blue Map Evolved Over the Past Century’; America Magazine in The National Catholic Review; June 29, 2016
State results of the 1992 U.S. presidential election | ||
|---|---|---|
|  | |