Broome County, New York
| Broome County, New York | |||
|---|---|---|---|
| County of New York State | |||
| County of Broome | |||
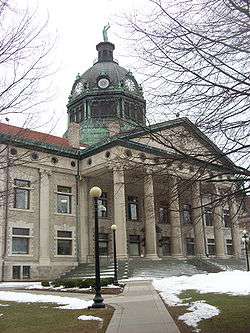 Broome County Courthouse | |||
| |||
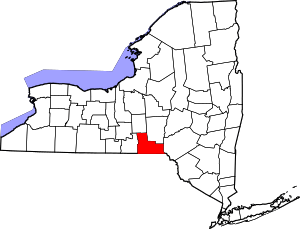 Location in the U.S. state of New York | |||
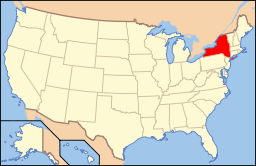 New York's location in the U.S. | |||
| Founded | 1806 | ||
| Named for | John Broome | ||
| Seat | Binghamton | ||
| Largest city | Binghamton | ||
| Area | |||
| • Total | 716 sq mi (1,854 km2) | ||
| • Land | 706 sq mi (1,829 km2) | ||
| • Water | 9.7 sq mi (25 km2), 1.4% | ||
| Population (est.) | |||
| • (2017) | 193,639[1] | ||
| • Density | 274.3/sq mi (105.9/km2) | ||
| Congressional districts | 19th, 22nd | ||
| Time zone | Eastern: UTC−5/−4 | ||
| Website |
www | ||

Broome County is a county in the U.S. state of New York. As of the 2010 census, the population was 200,600.[2] Its county seat is Binghamton. The county was named in honor of John Broome, who was lieutenant governor in 1806 when Broome County was established.
Broome County is part of the Binghamton, NY Metropolitan Statistical Area.
The current county executive is Jason T. Garnar. Broome County is the site of Binghamton University, one of four university centers in the State University of New York (SUNY) system.
History
When counties were established in the Province of New York in 1683, the present Broome County was part of the enormous Albany County, including the northern part of New York State as well as all of the present State of Vermont and, in theory, extending westward to the Pacific Ocean. This county was reduced in size on July 3, 1766 by the creation of Cumberland County, and further on March 16, 1770 by the creation of Gloucester County, both containing territory now in Vermont.
On March 12, 1772, what was left of Albany County was split into three parts, one remaining under the name Albany County. One of the other pieces, Tryon County, contained the western portion (and thus, since no western boundary was specified, theoretically still extended west to the Pacific). The eastern boundary of Tryon County was approximately five miles west of the present city of Schenectady, and the county included the western part of the Adirondack Mountains and the area west of the West Branch of the Delaware River. The area then designated as Tryon County now is organized as 37 counties of New York State. The county was named for William Tryon, colonial governor of New York.
In the years prior to 1776, most of the Loyalists in Tryon County fled to Canada. In 1784, following the peace treaty that ended the American Revolutionary War, the name of Tryon County was changed to Montgomery County in honor of the general, Richard Montgomery, who had captured several places in Canada and died attempting to capture the city of Quebec, replacing the name of the hated British governor.
In 1789, Montgomery County was reduced in size by the splitting off of Ontario County. The actual area split off from Montgomery County was much larger than the present county, also including the present Allegany, Cattaraugus, Chautauqua, Erie, Genesee, Livingston, Monroe, Niagara, Orleans, Steuben, Wyoming, Yates, and part of Schuyler and Wayne Counties.
In 1791, Tioga County split off from Montgomery County, along with Herkimer and Otsego Counties. Tioga County was at this time much larger than the present county and included the present Broome and Chemung Counties and parts of Chenango and Schuyler Counties.
In 1798, Tioga County was reduced in size by the splitting off of Chemung County (which also included part of the present Schuyler County) and by the combination of a portion with a portion of Herkimer County to create Chenango County.
In 1806, the present-day Broome County was split off from Tioga County.
Geography
According to the U.S. Census Bureau, the county has a total area of 716 square miles (1,850 km2), of which 706 square miles (1,830 km2) is land and 9.7 square miles (25 km2) (1.4%) is water.[3]
Broome County is located in south-central New York, directly north of the border with Pennsylvania in a section of the state called the Southern Tier. The Chenango River joins the Susquehanna River, which flows through the county.
The western half of the county is hilly but has wide valleys that accommodate Binghamton and its suburbs. In the northern portion Interstate 81 takes advantage of another glacial valley. To the east, however, the terrain becomes much more rugged as the land tilts up to the Catskills.
The highest elevation is a U.S. National Geodetic Survey benchmark known as Slawson atop an unnamed hill in the Town of Sanford. It is approximately 2087 feet[4] (636 m) above sea level. An area due east on the Delaware County line in Oquaga Creek State Park also lies within the same elevation contour line. The lowest point is 864 feet (263 m) above sea level, along the Susquehanna at the Pennsylvania state line.
Adjacent counties
- Chenango County - north
- Delaware County - east
- Wayne County, Pennsylvania - southeast
- Susquehanna County, Pennsylvania - south
- Tioga County - west
- Cortland County - northwest
Major highways
Demographics
| Historical population | |||
|---|---|---|---|
| Census | Pop. | %± | |
| 1810 | 8,130 | — | |
| 1820 | 14,343 | 76.4% | |
| 1830 | 17,579 | 22.6% | |
| 1840 | 22,338 | 27.1% | |
| 1850 | 30,660 | 37.3% | |
| 1860 | 35,906 | 17.1% | |
| 1870 | 44,103 | 22.8% | |
| 1880 | 49,483 | 12.2% | |
| 1890 | 62,973 | 27.3% | |
| 1900 | 69,149 | 9.8% | |
| 1910 | 78,809 | 14.0% | |
| 1920 | 113,610 | 44.2% | |
| 1930 | 147,022 | 29.4% | |
| 1940 | 165,749 | 12.7% | |
| 1950 | 184,698 | 11.4% | |
| 1960 | 212,661 | 15.1% | |
| 1970 | 221,815 | 4.3% | |
| 1980 | 213,648 | −3.7% | |
| 1990 | 212,160 | −0.7% | |
| 2000 | 200,536 | −5.5% | |
| 2010 | 200,600 | 0.0% | |
| Est. 2017 | 193,639 | [5] | −3.5% |
| U.S. Decennial Census[6] 1790-1960[7] 1900-1990[8] 1990-2000[9] 2010-2013[2] | |||
As of the census[10] of 2000, there were 200,536 people, 80,749 households, and 50,225 families residing in the county. The population density was 284 people per square mile (110/km²). There were 88,817 housing units at an average density of 126 per square mile (49/km²). The racial makeup of the county was 91.33% White, 3.28% Black or African American, 0.19% Native American, 2.79% Asian, 0.03% Pacific Islander, 0.79% from other races, and 1.59% from two or more races. 1.99% of the population were Hispanic or Latino of any race. 16.1% were of Irish, 13.3% Italian, 12.3% German, 11.6% English, 6.4% American and 5.7% Polish ancestry according to Census 2000 . 91.4% spoke English, 2.0% Spanish and 1.1% Italian as their first language.
There were 80,749 households out of which 28.20% had children under the age of 18 living with them, 47.60% were married couples living together, 10.80% had a female householder with no husband present, and 37.80% were non-families. 31.00% of all households were made up of individuals and 12.40% had someone living alone who was 65 years of age or older. The average household size was 2.37 and the average family size was 2.97.
In the county, the population was spread out with 23.00% under the age of 18, 11.00% from 18 to 24, 26.80% from 25 to 44, 22.80% from 45 to 64, and 16.40% who were 65 years of age or older. The median age was 38 years. For every 100 females there were 93.20 males. For every 100 females age 18 and over, there were 89.90 males.
The median income for a household in the county was $35,347, and the median income for a family was $45,422. Males had a median income of $34,426 versus $24,542 for females. The per capita income for the county was $19,168. About 8.80% of families and 12.80% of the population were below the poverty line, including 15.90% of those under age 18 and 7.20% of those age 65 or over.
Government and politics
| Year | Republican | Democratic | Third Parties |
|---|---|---|---|
| 2016 | 47.6% 40,943 | 45.6% 39,212 | 6.9% 5,917 |
| 2012 | 46.2% 37,641 | 51.5% 41,970 | 2.4% 1,954 |
| 2008 | 45.1% 40,077 | 53.1% 47,204 | 1.8% 1,556 |
| 2004 | 47.4% 43,568 | 50.4% 46,281 | 2.2% 2,041 |
| 2000 | 42.4% 36,946 | 52.1% 45,381 | 5.5% 4,757 |
| 1996 | 36.1% 31,327 | 51.2% 44,407 | 12.8% 11,080 |
| 1992 | 34.7% 34,653 | 43.5% 43,444 | 21.8% 21,749 |
| 1988 | 49.4% 47,610 | 50.0% 48,130 | 0.7% 625 |
| 1984 | 60.5% 58,109 | 39.2% 37,658 | 0.3% 322 |
| 1980 | 44.0% 39,275 | 41.5% 37,013 | 14.6% 12,992 |
| 1976 | 55.5% 50,340 | 43.9% 39,827 | 0.5% 491 |
| 1972 | 59.8% 55,736 | 39.9% 37,154 | 0.3% 245 |
| 1968 | 52.5% 46,872 | 41.9% 37,451 | 5.6% 4,988 |
| 1964 | 35.2% 32,048 | 64.8% 59,021 | 0.1% 70 |
| 1960 | 59.4% 56,467 | 40.5% 38,462 | 0.1% 62 |
| 1956 | 74.3% 67,024 | 25.7% 23,217 | 0.0% 0 |
| 1952 | 71.4% 64,738 | 28.5% 25,833 | 0.1% 119 |
| 1948 | 60.7% 43,110 | 36.1% 25,654 | 3.1% 2,222 |
| 1944 | 58.5% 44,013 | 41.3% 31,056 | 0.2% 137 |
| 1940 | 57.7% 44,013 | 42.1% 32,092 | 0.2% 179 |
| 1936 | 54.7% 36,945 | 43.9% 29,708 | 1.4% 950 |
| 1932 | 58.0% 32,751 | 40.4% 22,802 | 1.7% 941 |
| 1928 | 65.3% 39,860 | 32.0% 19,563 | 2.7% 1,669 |
| 1924 | 67.7% 28,262 | 22.3% 9,289 | 10.1% 4,198 |
| 1920 | 69.0% 24,759 | 25.8% 9,251 | 5.3% 1,893 |
| 1916 | 53.3% 11,445 | 41.5% 8,906 | 5.2% 1,105 |
| 1912 | 43.6% 7,949 | 35.8% 6,533 | 20.7% 3,770 |
| 1908 | 58.2% 10,705 | 36.2% 6,671 | 5.6% 1,032 |
| 1904 | 59.5% 10,853 | 35.6% 6,480 | 4.9% 897 |
| 1900 | 58.0% 10,397 | 37.1% 6,652 | 4.9% 877 |
| 1896 | 63.8% 10,630 | 32.8% 5,461 | 3.5% 583 |
| 1892 | 52.4% 8,259 | 38.3% 6,040 | 9.3% 1,474 |
| 1888 | 53.7% 8,405 | 41.2% 6,447 | 5.1% 801 |
| 1884 | 53.0% 7,182 | 42.6% 5,780 | 4.4% 602 |
Broome County's offices are housed in the Edwin L. Crawford County Office Building of Government Plaza located at 60 Hawley Street in Downtown Binghamton. In 2016 Donald Trump became the first Republican to win the county since Ronald Reagan in 1984.
Executive
| Name | Party | Term |
|---|---|---|
| Edwin L. Crawford | Republican | 1969–1976 |
| Donald L. McManus | Democratic | 1977–1980 |
| Carl S. Young | Republican | 1981–1988 |
| Timothy M. Grippen | Democratic | 1989–1996 |
| Jeffrey P. Kraham | Republican | 1997–2004 |
| Barbara J. Fiala | Democratic | 2005–Apr. 15, 2011 |
| Patrick J. Brennan | Democratic | Apr. 16, 2011–Dec. 31, 2011 |
| Debra A. Preston | Republican | Jan. 1, 2012–Dec. 31, 2016 |
| Jason T. Garnar[12] | Democratic | Jan. 1 2017– |
Legislature
The Broome County Legislature consists of 15 members.[13] All fifteen members of the legislature are elected from individual districts. Currently, there are 11 Republicans and 4 Democrats.
| District | Legislator | Title | Party | Residence |
|---|---|---|---|---|
| 1 | Stephen J. Flagg | Majority Leader | Republican | Colesville |
| 2 | Scott D. Baker | Republican | Windsor | |
| 3 | Kelly F. Wildoner | Republican | Binghamton | |
| 4 | Daniel D. Reynolds | Democratic | Vestal | |
| 5 | Daniel J. Reynolds | Chairman | Republican | Vestal |
| 6 | Greg W. Baldwin | Republican | Endicott | |
| 7 | Matthew J. Pasquale | Republican | Endicott | |
| 8 | Jason E. Shaw | Republican | Endwell | |
| 9 | Ronald J. Keibel | Republican | Triangle | |
| 10 | Cindy O'Brien | Republican | Chenango | |
| 11 | Ron Heebner | Republican | Johnson City | |
| 12 | Michael P. Sopchak, Jr. | Republican | Johnson City | |
| 13 | Robert Weslar | Democratic | Binghamton | |
| 14 | Mary Kaminsky | Democratic | Binghamton | |
| 15 | Mark R. Whalen | Minority Leader | Democratic | Binghamton |
Party affiliation
| Party | Active voters | Inactive voters | Total voters | Percentage | |
|---|---|---|---|---|---|
| Democratic | 42,121 | 4,361 | 46,482 | 37.23% | |
| Republican | 41,172 | 2,635 | 43,807 | 35.08% | |
| Unaffiliated | 21,996 | 2,991 | 24,987 | 20.01% | |
| Other[nb 1] | 8,609 | 981 | 9,590 | 7.68% | |
| Total | 113,898 | 10,968 | 124,866 | 100% | |
Education
The four primary institutes of higher education in Broome County include:
- Binghamton University With a student population of 16,000, it is responsible for a large portion of the population in and around Broome's largest city, Binghamton, New York.
- Broome Community College (BCC) serves as a two-year associate-granting institution for local residents.
- Davis College is a small, private, Christian college in Johnson City, New York.
- Ridley-Lowell Business and Technical Institute is a career technical institute that offers career training programs.
Communities

City
- Binghamton (county seat)
Towns
Villages
Census-designated places
Hamlets
Notable natives
- John Allen, noted dentist and inventor of new denture method[15]
- Norman F. Cantor, world historian, author, editor, lecturer
- Ira Cook, Iowa land surveyor and businessman, was born here
- Daniel S. Dickinson, mid-19th century U.S. Senator
- John Ducey, actor
- Exterminator, "Old Bones", thoroughbred race horse, Kentucky Derby winner 1918, horse of the year 1922, in ancestral line of Secretariat and Seattle Slew
- Robert Harpur, colonial teacher, politician, pioneer, for whom Harpur College (now Binghamton University) was named
- Johnny Hart, cartoonist, creator of B.C. and co-creator of The Wizard of Id
- George F. Johnson, industrialist, philanthropist, co-founder of Endicott-Johnson Co.
- Bill T. Jones, modern dancer, dance company founder, choreographer
- Willis Sharpe Kilmer, early 20th-century industrialist and entrepreneur History of the City of Binghamton, Life & Times Part 1, Life & Times Part 2
- Edwin A. Link, inventor, visionary, entrepreneur, industrialist
- David Ross Locke, journalist and early political commentator during the American Civil War
- Ron Luciano, American League baseball umpire, author
- Billy Martin, New York Yankees second baseman and manager
- Leonard Melfi, poet, screenwriter, author, playwright
- William L. Mercereau, businessman, superintendent of carferries
- Mary Blair Moody physician, anatomist
- Hidy Ochiai, karate and judo grand master, author, actor
- Camille Paglia, philosopher, author, editor, lecturer
- Alice Freeman Palmer (1855-1902), educator
- Amy Sedaris, actress, author, playwright
- David Sedaris, comedian, essayist, playwright
- Rod Serling, screenwriter, playwright, most famous for his science fiction anthology television series The Twilight Zone
- Jack Sharkey, born Joseph Paul Cukoschay, world heavyweight boxing champion, 1931–33
See also
Notes
- ↑ Included are voters affiliated with the Conservative Party, Green Party, Working Families Party, Independence Party, Women's Equality Party, Reform Party, and other small parties.
External links
- Broome County, New York
- Broome County at Curlie (based on DMOZ)
- Summary Early history of Broome County
- BingWiki, the area's local regional wiki
References
- ↑ "U.S. Census Bureau QuickFacts: Broome County, New York". Census Bureau QuickFacts. Retrieved 23 April 2018.
- 1 2 "State & County QuickFacts". United States Census Bureau. Retrieved October 11, 2013.
- ↑ "2010 Census Gazetteer Files". United States Census Bureau. August 22, 2012. Archived from the original on May 19, 2014. Retrieved January 3, 2015.
- ↑ http://www.cnyhiking.com/BroomeCounty.htm
- ↑ "Population and Housing Unit Estimates".
- ↑ "U.S. Decennial Census". United States Census Bureau. Archived from the original on May 12, 2015. Retrieved January 3, 2015.
- ↑ "Historical Census Browser". University of Virginia Library. Retrieved January 3, 2015.
- ↑ "Population of Counties by Decennial Census: 1900 to 1990". United States Census Bureau. Retrieved January 3, 2015.
- ↑ "Census 2000 PHC-T-4. Ranking Tables for Counties: 1990 and 2000" (PDF). United States Census Bureau. Retrieved January 3, 2015.
- ↑ "American FactFinder". United States Census Bureau. Archived from the original on 2013-09-11. Retrieved 2008-01-31.
- ↑ http://uselectionatlas.org/RESULTS
- ↑ "County Executive - Jason T. Garnar | broomecountyny". www.gobroomecounty.com. Retrieved 2017-01-30.
- ↑
- ↑ "NYSVoter Enrollment by County, Party Affiliation and Status" (PDF). New York State Board of Elections. April 2018. Archived from the original (PDF) on May 2, 2018. Retrieved May 2, 2018.
- ↑ Who Was Who in America, Historical Volume, 1607-1896. Chicago: Marquis Who's Who. 1963.
Places adjacent to Broome County, New York | ||||||||||
|---|---|---|---|---|---|---|---|---|---|---|
| ||||||||||
Municipalities and communities of Broome County, New York, United States | ||
|---|---|---|
| City | | |
| Towns | ||
| Villages | ||
| CDPs | ||
| Other hamlets | ||
| Footnotes | ‡This populated place also has portions in an adjacent county or counties | |