United States presidential election in New York, 1988
|
| ||||||||||||||||||||||||||
| ||||||||||||||||||||||||||
| ||||||||||||||||||||||||||
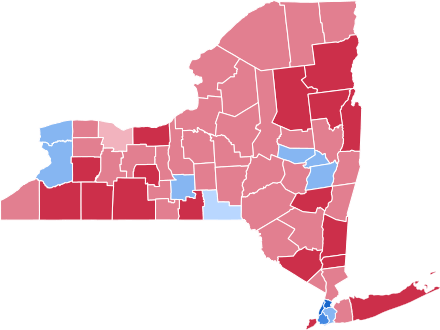 County Results
Dukakis—70-80%
Dukakis—60-70%
Dukakis—50-60%
Dukakis—<50%
Bush—<50%
Bush—50-60%
Bush—60-70% | ||||||||||||||||||||||||||
| ||||||||||||||||||||||||||

The 1988 United States presidential election in New York took place on November 8, 1988, as part of the 1988 United States presidential election. Voters chose thirty-six representatives, or electors to the Electoral College, who voted for president and vice president.
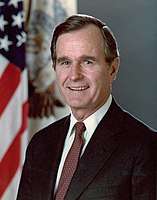
New York was won by Democratic Governor Michael Dukakis of Massachusetts with 51.62% of the popular vote over Republican Vice President George H.W. Bush of Texas, who took 47.52%, a victory margin of 4.10%.[1]
1988 would mark the end of an era in New York's political history. Since the 1940s, New York had been a Democratic-leaning swing state, usually voting Democratic in close elections, but often by small margins. Republicans would dominate much of upstate New York and populated suburban counties like Nassau County, Suffolk County, and Westchester County. However they would be narrowly outvoted statewide by the fiercely Democratic and massively populated New York City area, along with some upstate cities like Buffalo, Albany, and the college town of Ithaca. This pattern would endure in 1988 for the final time, allowing Bush to keep the race fairly close, only losing the state to Dukakis by 4 percentage points.
Dukakis’ statewide victory is largely attributable to winning the five boroughs of New York City overall with 66.2 percent of the vote. However even though losing the city in a landslide, Bush’s 32.8% of the vote was a relatively respectable showing for a Republican in NYC, particularly in retrospect. In the six elections that have followed 1988, Republican presidential candidates have received only seventeen to twenty-four percent of the vote in New York City.
This was the last election in which a Republican presidential nominee won heavily populated Nassau and Westchester Counties, as well as Monroe, Onondaga, and Ulster Counties,[2] and also the last election in which New York was decided by a single-digit margin. Beginning in 1992, the Democrats would make substantial inroads in the suburbs around New York City as well as parts of upstate, making New York a solid blue state that has gone Democratic by double-digit margins in every election since.
Results
| United States presidential election in New York, 1988 | |||||
|---|---|---|---|---|---|
| Party | Candidate | Votes | Percentage | Electoral votes | |
| Democratic | Michael Dukakis | 3,255,487 | 50.19% | ||
| Liberal | Michael Dukakis | 92,395 | 1.42% | ||
| Total | Michael Dukakis | 3,347,882 | 51.62% | 36 | |
| Republican | George H.W. Bush | 2,838,414 | 43.76% | ||
| Conservative | George H.W. Bush | 243,457 | 3.75% | ||
| Total | George H.W. Bush | 3,081,871 | 47.52% | 0 | |
| Right to Life | William Marra | 20,497 | 0.32% | 0 | |
| New Alliance | Lenora Fulani | 15,845 | 0.24% | 0 | |
| Libertarian | Ron Paul | 12,109 | 0.19% | 0 | |
| Workers World | Larry Holmes | 4,179 | 0.06% | 0 | |
| Socialist Workers | James Warren | 3,287 | 0.05% | 0 | |
| Write-in | Edward Winn | 10 | 0.00% | 0 | |
| Write-in | Willa Kenoyer | 3 | 0.00% | 0 | |
| Totals | 6,485,683 | 100.0% | 36 | ||
Results by county
| Michael Stanley Dukakis Democratic |
George Herbert Walker Bush Republican |
Various candidates Other parties |
Margin | Total votes cast | |||||
|---|---|---|---|---|---|---|---|---|---|
| County | # | % | # | % | # | % | # | % | # |
| Albany | 86,564 | 58.70% | 59,534 | 40.37% | 1,363 | 0.92% | 27,030 | 18.33% | 147,461 |
| Allegany | 5,614 | 31.85% | 11,880 | 67.40% | 132 | 0.75% | -6,266 | -35.55% | 17,626 |
| Bronx | 218,245 | 73.22% | 76,043 | 25.51% | 3,793 | 1.27% | 142,202 | 47.71% | 298,081 |
| Broome | 48,130 | 49.95% | 47,610 | 49.41% | 625 | 0.65% | 520 | 0.54% | 96,365 |
| Cattaraugus | 12,447 | 38.38% | 19,691 | 60.72% | 290 | 0.89% | -7,244 | -22.34% | 32,428 |
| Cayuga | 15,044 | 46.60% | 16,934 | 52.45% | 307 | 0.95% | -1,890 | -5.85% | 32,285 |
| Chautauqua | 25,814 | 44.61% | 31,642 | 54.68% | 411 | 0.71% | -5,828 | -10.07% | 57,867 |
| Chemung | 15,966 | 42.99% | 20,951 | 56.41% | 222 | 0.60% | -4,985 | -13.42% | 37,139 |
| Chenango | 8,021 | 40.30% | 11,727 | 58.92% | 154 | 0.77% | -3,706 | -18.62% | 19,902 |
| Clinton | 12,670 | 44.36% | 15,702 | 54.97% | 191 | 0.67% | -3,032 | -10.62% | 28,563 |
| Columbia | 11,585 | 43.03% | 15,111 | 56.12% | 228 | 0.85% | -3,526 | -13.10% | 26,924 |
| Cortland | 7,673 | 40.88% | 10,934 | 58.26% | 162 | 0.86% | -3,261 | -17.37% | 18,769 |
| Delaware | 7,463 | 39.26% | 11,391 | 59.92% | 156 | 0.82% | -3,928 | -20.66% | 19,010 |
| Dutchess | 38,968 | 38.22% | 62,165 | 60.97% | 826 | 0.81% | -23,197 | -22.75% | 101,959 |
| Erie | 238,779 | 55.43% | 188,796 | 43.83% | 3,217 | 0.75% | 49,983 | 11.60% | 430,792 |
| Essex | 6,623 | 38.70% | 10,350 | 60.48% | 140 | 0.82% | -3,727 | -21.78% | 17,113 |
| Franklin | 7,928 | 46.11% | 9,135 | 53.14% | 129 | 0.75% | -1,207 | -7.02% | 17,192 |
| Fulton | 9,012 | 43.06% | 11,757 | 56.17% | 162 | 0.77% | -2,745 | -13.11% | 20,931 |
| Genesee | 9,945 | 40.87% | 14,182 | 58.29% | 205 | 0.84% | -4,237 | -17.41% | 24,332 |
| Greene | 7,265 | 37.61% | 11,874 | 61.46% | 180 | 0.93% | -4,609 | -23.86% | 19,319 |
| Hamilton | 976 | 29.42% | 2,320 | 69.94% | 21 | 0.63% | -1,344 | -40.52% | 3,317 |
| Herkimer | 12,694 | 45.30% | 15,104 | 53.90% | 224 | 0.80% | -2,410 | -8.60% | 28,022 |
| Jefferson | 14,137 | 42.05% | 19,304 | 57.41% | 181 | 0.54% | -5,167 | -15.37% | 33,622 |
| Kings (Brooklyn) | 363,916 | 66.28% | 178,961 | 32.60% | 6,142 | 1.12% | 184,955 | 33.69% | 549,019 |
| Lewis | 4,252 | 41.94% | 5,787 | 57.08% | 99 | 0.98% | -1,535 | -15.14% | 10,138 |
| Livingston | 9,506 | 40.11% | 14,004 | 59.10% | 187 | 0.79% | -4,498 | -18.98% | 23,697 |
| Madison | 10,665 | 41.41% | 14,902 | 57.86% | 187 | 0.73% | -4,237 | -16.45% | 25,754 |
| Monroe | 153,650 | 49.33% | 155,271 | 49.85% | 2,545 | 0.82% | -1,621 | -0.52% | 311,466 |
| Montgomery | 11,371 | 50.13% | 11,128 | 49.05% | 186 | 0.82% | 243 | 1.07% | 22,685 |
| Nassau | 250,130 | 42.22% | 337,430 | 56.96% | 4,858 | 0.82% | -87,300 | -14.74% | 592,418 |
| New York (Manhattan) | 385,675 | 76.14% | 115,927 | 22.89% | 4,949 | 0.98% | 269,748 | 53.25% | 506,551 |
| Niagara | 43,801 | 50.42% | 42,537 | 48.97% | 530 | 0.61% | 1,264 | 1.46% | 86,868 |
| Oneida | 47,665 | 46.07% | 55,039 | 53.20% | 757 | 0.73% | -7,374 | -7.13% | 103,461 |
| Onondaga | 94,751 | 47.26% | 104,080 | 51.91% | 1,654 | 0.82% | -9,329 | -4.65% | 200,485 |
| Ontario | 17,341 | 43.97% | 21,780 | 55.23% | 314 | 0.80% | -4,439 | -11.26% | 39,435 |
| Orange | 38,465 | 36.70% | 65,446 | 62.44% | 899 | 0.86% | -26,981 | -25.74% | 104,810 |
| Orleans | 5,913 | 39.28% | 9,028 | 59.97% | 114 | 0.76% | -3,115 | -20.69% | 15,055 |
| Oswego | 18,430 | 41.69% | 25,362 | 57.37% | 419 | 0.95% | -6,932 | -15.68% | 44,211 |
| Otsego | 11,069 | 45.49% | 13,021 | 53.51% | 245 | 1.01% | -1,952 | -8.02% | 24,335 |
| Putnam | 12,158 | 33.31% | 24,086 | 65.99% | 256 | 0.70% | -11,928 | -32.68% | 36,500 |
| Queens | 325,147 | 59.47% | 217,049 | 39.70% | 4,533 | 0.83% | 108,098 | 19.77% | 546,729 |
| Rensselaer | 33,066 | 47.79% | 35,412 | 51.18% | 719 | 1.04% | -2,346 | -3.39% | 69,197 |
| Richmond (Staten Island) | 47,812 | 37.95% | 77,427 | 61.46% | 736 | 0.58% | -29,615 | -23.51% | 125,975 |
| Rockland | 47,634 | 42.42% | 63,825 | 56.83% | 842 | 0.75% | -16,191 | -14.42% | 112,301 |
| St. Lawrence | 18,921 | 47.92% | 20,290 | 51.39% | 270 | 0.68% | -1,369 | -3.47% | 39,481 |
| Saratoga | 31,684 | 41.81% | 43,498 | 57.39% | 606 | 0.80% | -11,814 | -15.59% | 75,788 |
| Schenectady | 36,483 | 51.83% | 33,364 | 47.40% | 539 | 0.77% | 3,119 | 4.43% | 70,386 |
| Schoharie | 5,389 | 42.99% | 7,008 | 55.90% | 139 | 1.11% | -1,619 | -12.91% | 12,536 |
| Schuyler | 2,900 | 40.04% | 4,291 | 59.25% | 51 | 0.70% | -1,391 | -19.21% | 7,242 |
| Seneca | 6,215 | 45.80% | 7,221 | 53.21% | 135 | 0.99% | -1,006 | -7.41% | 13,571 |
| Steuben | 12,824 | 33.34% | 25,359 | 65.93% | 283 | 0.74% | -12,535 | -32.59% | 38,466 |
| Suffolk | 199,215 | 38.73% | 311,242 | 60.51% | 3,893 | 0.76% | -112,027 | -21.78% | 514,350 |
| Sullivan | 11,635 | 42.20% | 15,713 | 57.00% | 220 | 0.80% | -4,078 | -14.79% | 27,568 |
| Tioga | 8,102 | 38.68% | 12,670 | 60.49% | 174 | 0.83% | -4,568 | -21.81% | 20,946 |
| Tompkins | 21,455 | 58.46% | 14,932 | 40.69% | 312 | 0.85% | 6,523 | 17.77% | 36,699 |
| Ulster | 30,744 | 42.37% | 41,173 | 56.75% | 640 | 0.88% | -10,429 | -14.37% | 72,557 |
| Warren | 8,580 | 34.85% | 15,860 | 64.41% | 182 | 0.74% | -7,280 | -29.57% | 24,622 |
| Washington | 8,201 | 36.42% | 14,103 | 62.64% | 211 | 0.94% | -5,902 | -26.21% | 22,515 |
| Wayne | 12,959 | 38.22% | 20,613 | 60.80% | 330 | 0.97% | -7,654 | -22.58% | 33,902 |
| Westchester | 169,860 | 45.78% | 197,956 | 53.36% | 3,192 | 0.86% | -28,096 | -7.57% | 371,008 |
| Wyoming | 5,228 | 35.17% | 9,451 | 63.59% | 184 | 1.24% | -4,223 | -28.41% | 14,863 |
| Yates | 3,507 | 38.65% | 5,488 | 60.48% | 79 | 0.87% | -1,981 | -21.83% | 9,074 |
| Totals | 3,347,882 | 51.62% | 3,081,871 | 47.52% | 55,930 | 0.86% | 266,011 | 4.10% | 6,485,683 |
References
- ↑ "1988 Presidential General Election Results - New York". U.S. Election Atlas. Retrieved 13 October 2012.
- ↑ Sullivan, Robert David; ‘How the Red and Blue Map Evolved Over the Past Century’; America Magazine in The National Catholic Review; June 29, 2016
State results of the 1988 U.S. presidential election | ||
|---|---|---|
| 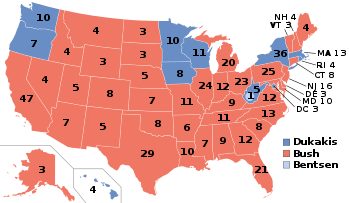 | |