United States presidential election in New York, 1964
|
| ||||||||||||||||||||||||||
| ||||||||||||||||||||||||||
| ||||||||||||||||||||||||||
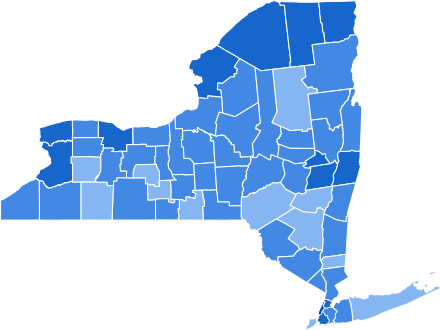 County Results
Johnson 50-60% 60-70% 70-80% 80-90%
| ||||||||||||||||||||||||||
| ||||||||||||||||||||||||||
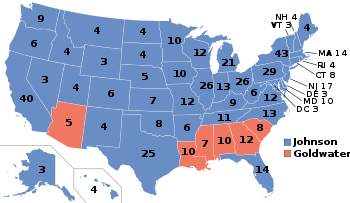
The 1964 United States presidential election in New York took place on November 3, 1964. All fifty states and the District of Columbia, were part of the 1964 United States presidential election. New York voters chose forty three electors to the Electoral College, which selected the president and vice president.
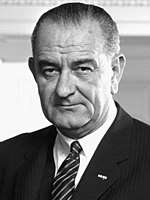
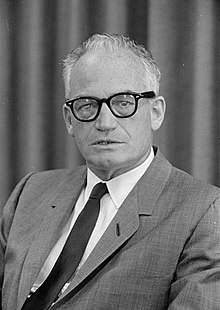
New York was won by incumbent Democratic President Lyndon B. Johnson, who was running against Republican Senator Barry Goldwater of Arizona. Johnson ran with Senator Hubert Humphrey of Minnesota, and Goldwater ran with Representative William E. Miller of New York.
Johnson carried the state in a historic landslide, taking 68.56 percent of the vote to Goldwater’s 31.31 percent, a victory margin of 37.25%. This is the only election in history in which a Democratic presidential candidate carried every single county in the state of New York. Johnson not only dominated traditionally Democratic cities like New York City, Albany, and Buffalo, but also swept every county in traditionally Republican upstate New York and Long Island. Allegany,[1] Genesee,[2] Livingston,[3] Orleans,[4] Tioga,[5] Wayne[6] and Wyoming Counties[7] have never voted for a Democratic presidential candidate before or since. Unlike some analogous Northeastern counties where Johnson only won very narrowly, like Lancaster in Pennsylvania, Johnson won these normally Republican upstate counties by large margins: Genesee and Livingston were won for the Democratic Party by over thirty percentage points, and Orleans and Wayne by over twenty-five percentage points.[8]
Hamilton[9] and Greene Counties[10] had not voted Democratic since 1916, nor have they ever voted for a Democrat since 1968, whilst Putnam[11] and Steuben Counties[12] previously voted Democratic in 1912 and have never done so since.
This result also made Johnson one of only three presidential candidates of either party who have been able to sweep every county in New York State, the others being Republicans Warren G. Harding in 1920 and Calvin Coolidge in 1924.
New York weighed in for this election as 15 percent more Democratic than the national average.
The presidential election of 1964 was a very partisan election for New York, with almost 99.9% of the electorate voting for either the Republican Party or the Democratic Party.[8]
Lyndon Johnson carried all five boroughs of New York City, the first presidential candidate to do so since the landslide re-election of Franklin Roosevelt in 1936. In the borough of Manhattan, Johnson broke 80% of the vote, the first presidential candidate ever to do so. Brooklyn and the Bronx voted over 70% Democratic. Traditionally Republican Queens, narrowly carried by John F. Kennedy in 1960, gave over 60% of the vote to Johnson. Even Staten Island voted Democratic, the only occasion it would do so between 1936 and 1996, although Goldwater’s best performances at around 45 percent of the vote were in Suffolk and Richmond Counties.[8] Overall, New York City gave LBJ about 73% of the vote, a citywide vote share no candidate would surpass until fellow Democrat Bill Clinton’s 77 percent in the 1996 election. With 2,183,646 votes from the five boroughs, Johnson also received more votes in New York City than any other presidential candidate in history, setting a record that would hold for over another half-century until Democrat Hillary Clinton would finally surpass him by winning the city by 2,191,869 votes in the 2016 election.
Johnson won the election in New York with a powerful 37 point sweep-out landslide. The staunch conservative Barry Goldwater was widely seen in the liberal New England states as a right-wing extremist;[13] he had voted against the Civil Rights Act of 1964, and the Johnson campaign portrayed him as a warmonger who as president would provoke a nuclear war.[14] Thus Goldwater performed especially weakly in northeastern states like New York: he wrote off the state and neighbouring Pennsylvania, New Jersey, Massachusetts, Connecticut, Rhode Island and Michigan off from the beginning of his presidential campaign before Kennedy’s assassination.[15] By September, polls suggested Johnson would carry the Empire State by forty percentage points[16] – a result more accurate than polls in the South.
For the first time in history, a Democratic presidential candidate swept every Northeastern state in 1964. Not only did Johnson win every Northeastern state, but he won all of them with landslides of over sixty percent of the vote, including New York, which weighed in as the fifth most Democratic state in the nation.
However the results of this election in New York are typical of President Johnson’s almost universal popularity across the United States at the time. The only region of the United States that did not send electors for Johnson were Arizona (Goldwater's home state), and several states in the Deep South. 1964 was the first election where the South showed a trend towards independent identification with the Republican Party. Johnson’s Civil Rights Act had solidified integration which had already been happening in New York for the better part of fifty years by the 1964 election. Johnson’s socially liberal and racially tolerant political position largely increased his popularity in New York, in contrast to the highly conservative Goldwater who opposed the Civil Rights Act of 1964.
Johnson’s 68.56 percent of the vote remains the highest vote share any presidential candidate of either party has ever received in New York State. His 37.25 percent victory margin also remains the widest margin by which any Democratic presidential candidate has ever won New York State, and the second-widest margin by which any candidate of either party has ever carried the state, only beaten narrowly by Republican Warren G. Harding’s 37.61 percent margin in the 1920 Republican landslide.[17]
Results
| United States presidential election in New York, 1964 | |||||
|---|---|---|---|---|---|
| Party | Candidate | Votes | Percentage | Electoral votes | |
| Democratic | Lyndon B. Johnson | 4,570,724 | 63.78% | ||
| Liberal | Lyndon B. Johnson | 342,432 | 4.78% | ||
| Total | Lyndon B. Johnson | 4,913,156 | 68.56% | 43 | |
| Republican | Barry Goldwater | 2,243,559 | 31.31% | 0 | |
| Socialist Labor | Eric Hass | 6,085 | 0.08% | 0 | |
| Socialist Workers | Clifton DeBerry | 3,215 | 0.04% | 0 | |
| Totals | 7,166,015 | 100.0% | 43 | ||
Results by county
| Lyndon Baines Johnson Democratic |
Barry Morris Goldwater Republican |
Various candidates Other parties |
Margin | Total votes cast | |||||
|---|---|---|---|---|---|---|---|---|---|
| County | # | % | # | % | # | % | # | % | # |
| Albany | 114,827 | 78.03% | 32,224 | 21.90% | 101 | 0.07% | 82,603 | 56.13% | 147,152 |
| Allegany | 10,329 | 57.26% | 7,688 | 42.62% | 22 | 0.12% | 2,641 | 14.64% | 18,039 |
| Bronx | 403,014 | 74.69% | 135,780 | 25.16% | 800 | 0.15% | 267,234 | 49.53% | 539,594 |
| Broome | 59,021 | 64.76% | 32,048 | 35.16% | 70 | 0.08% | 26,973 | 29.60% | 91,139 |
| Cattaraugus | 21,994 | 66.78% | 10,907 | 33.12% | 32 | 0.10% | 11,087 | 33.67% | 32,933 |
| Cayuga | 24,090 | 67.73% | 11,453 | 32.20% | 23 | 0.06% | 12,637 | 35.53% | 35,566 |
| Chautauqua | 42,924 | 69.17% | 19,069 | 30.73% | 63 | 0.10% | 23,855 | 38.44% | 62,056 |
| Chemung | 26,332 | 64.10% | 14,716 | 35.82% | 34 | 0.08% | 11,616 | 28.28% | 41,082 |
| Chenango | 11,653 | 61.49% | 7,293 | 38.48% | 6 | 0.03% | 4,360 | 23.01% | 18,952 |
| Clinton | 18,398 | 75.12% | 6,078 | 24.82% | 16 | 0.07% | 12,320 | 50.30% | 24,492 |
| Columbia | 14,516 | 61.62% | 9,023 | 38.30% | 19 | 0.08% | 5,493 | 23.32% | 23,558 |
| Cortland | 11,110 | 64.33% | 6,149 | 35.61% | 11 | 0.06% | 4,961 | 28.73% | 17,270 |
| Delaware | 11,686 | 58.24% | 8,359 | 41.66% | 19 | 0.09% | 3,327 | 16.58% | 20,064 |
| Dutchess | 50,179 | 62.94% | 29,503 | 37.01% | 43 | 0.05% | 20,676 | 25.93% | 79,725 |
| Erie | 344,910 | 73.14% | 125,962 | 26.71% | 704 | 0.15% | 218,948 | 46.43% | 471,576 |
| Essex | 10,739 | 64.75% | 5,837 | 35.19% | 9 | 0.05% | 4,902 | 29.56% | 16,585 |
| Franklin | 12,467 | 71.94% | 4,846 | 27.96% | 16 | 0.09% | 7,621 | 43.98% | 17,329 |
| Fulton | 15,846 | 68.46% | 7,278 | 31.44% | 23 | 0.10% | 8,568 | 37.02% | 23,147 |
| Genesee | 15,713 | 65.91% | 8,114 | 34.03% | 14 | 0.06% | 7,599 | 31.87% | 23,841 |
| Greene | 10,034 | 56.07% | 7,842 | 43.82% | 18 | 0.10% | 2,192 | 12.25% | 17,894 |
| Hamilton | 1,603 | 55.80% | 1,269 | 44.17% | 1 | 0.03% | 334 | 11.63% | 2,873 |
| Herkimer | 20,136 | 66.42% | 10,159 | 33.51% | 22 | 0.07% | 9,977 | 32.91% | 30,317 |
| Jefferson | 25,175 | 70.10% | 10,718 | 29.84% | 21 | 0.06% | 14,457 | 40.25% | 35,914 |
| Kings | 684,839 | 74.80% | 229,291 | 25.05% | 1,373 | 0.15% | 455,548 | 49.76% | 915,503 |
| Lewis | 6,584 | 67.33% | 3,185 | 32.57% | 10 | 0.10% | 3,399 | 34.76% | 9,779 |
| Livingston | 13,481 | 65.38% | 7,120 | 34.53% | 18 | 0.09% | 6,361 | 30.85% | 20,619 |
| Madison | 14,313 | 61.75% | 8,858 | 38.21% | 9 | 0.04% | 5,455 | 23.53% | 23,180 |
| Monroe | 205,226 | 71.86% | 80,099 | 28.05% | 257 | 0.09% | 125,127 | 43.81% | 285,582 |
| Montgomery | 19,370 | 69.52% | 8,471 | 30.40% | 20 | 0.07% | 10,899 | 39.12% | 27,861 |
| Nassau | 382,590 | 60.53% | 248,886 | 39.37% | 639 | 0.10% | 133,704 | 21.15% | 632,115 |
| New York | 503,848 | 80.52% | 120,125 | 19.20% | 1,746 | 0.28% | 383,723 | 61.33% | 625,719 |
| Niagara | 67,260 | 70.07% | 28,663 | 29.86% | 62 | 0.06% | 38,597 | 40.21% | 95,985 |
| Oneida | 73,359 | 64.80% | 39,737 | 35.10% | 114 | 0.10% | 33,622 | 29.70% | 113,210 |
| Onondaga | 128,630 | 66.99% | 63,205 | 32.92% | 179 | 0.09% | 65,425 | 34.07% | 192,014 |
| Ontario | 19,922 | 64.72% | 10,847 | 35.24% | 15 | 0.05% | 9,075 | 29.48% | 30,784 |
| Orange | 48,244 | 61.13% | 30,610 | 38.78% | 70 | 0.09% | 17,634 | 22.34% | 78,924 |
| Orleans | 9,304 | 62.46% | 5,567 | 37.37% | 25 | 0.17% | 3,737 | 25.09% | 14,896 |
| Oswego | 24,788 | 66.59% | 12,415 | 33.35% | 23 | 0.06% | 12,373 | 33.24% | 37,226 |
| Otsego | 15,190 | 63.67% | 8,643 | 36.23% | 26 | 0.11% | 6,547 | 27.44% | 23,859 |
| Putnam | 12,636 | 57.75% | 9,219 | 42.14% | 24 | 0.11% | 3,417 | 15.62% | 21,879 |
| Queens | 541,418 | 66.28% | 274,351 | 33.59% | 1,059 | 0.13% | 267,067 | 32.70% | 816,828 |
| Rensselaer | 51,170 | 71.01% | 20,814 | 28.88% | 76 | 0.11% | 30,356 | 42.13% | 72,060 |
| Richmond | 50,524 | 54.36% | 42,330 | 45.54% | 92 | 0.10% | 8,194 | 8.82% | 92,946 |
| Rockland | 46,173 | 63.74% | 26,187 | 36.15% | 82 | 0.11% | 19,986 | 27.59% | 72,442 |
| St. Lawrence | 29,173 | 70.62% | 12,102 | 29.30% | 32 | 0.08% | 17,071 | 41.33% | 41,307 |
| Saratoga | 29,264 | 68.57% | 13,364 | 31.32% | 47 | 0.11% | 15,900 | 37.26% | 42,675 |
| Schenectady | 51,892 | 70.30% | 21,848 | 29.60% | 80 | 0.11% | 30,044 | 40.70% | 73,820 |
| Schoharie | 7,187 | 63.09% | 4,193 | 36.81% | 11 | 0.10% | 2,994 | 26.28% | 11,391 |
| Schuyler | 4,326 | 59.62% | 2,925 | 40.31% | 5 | 0.07% | 1,401 | 19.31% | 7,256 |
| Seneca | 8,890 | 66.46% | 4,473 | 33.44% | 13 | 0.10% | 4,417 | 33.02% | 13,376 |
| Steuben | 24,634 | 60.61% | 15,988 | 39.34% | 23 | 0.06% | 8,646 | 21.27% | 40,645 |
| Suffolk | 180,598 | 55.51% | 144,350 | 44.37% | 385 | 0.12% | 36,248 | 11.14% | 325,333 |
| Sullivan | 16,728 | 67.52% | 8,006 | 32.31% | 41 | 0.17% | 8,722 | 35.20% | 24,775 |
| Tioga | 10,411 | 59.26% | 7,147 | 40.68% | 9 | 0.05% | 3,264 | 18.58% | 17,567 |
| Tompkins | 16,103 | 63.90% | 9,070 | 35.99% | 29 | 0.12% | 7,033 | 27.91% | 25,202 |
| Ulster | 35,486 | 59.82% | 23,749 | 40.03% | 91 | 0.15% | 11,737 | 19.78% | 59,326 |
| Warren | 12,772 | 61.94% | 7,834 | 37.99% | 14 | 0.07% | 4,938 | 23.95% | 20,620 |
| Washington | 13,826 | 62.87% | 8,160 | 37.10% | 7 | 0.03% | 5,666 | 25.76% | 21,993 |
| Wayne | 18,729 | 63.83% | 10,586 | 36.08% | 27 | 0.09% | 8,143 | 27.75% | 29,342 |
| Westchester | 243,723 | 61.98% | 149,052 | 37.90% | 460 | 0.12% | 94,671 | 24.07% | 393,235 |
| Wyoming | 8,866 | 59.19% | 6,099 | 40.71% | 15 | 0.10% | 2,767 | 18.47% | 14,980 |
| Yates | 4,983 | 57.52% | 3,675 | 42.42% | 5 | 0.06% | 1,308 | 15.10% | 8,663 |
| Totals | 4,913,156 | 68.56% | 2,243,559 | 31.31% | 9,300 | 0.13% | 2,669,597 | 37.25% | 7,166,015 |
See also
References
- ↑ The Political Graveyard; Allegany County, New York
- ↑ The Political Graveyard; Genesee County, New York
- ↑ The Political Graveyard; Livingston County, New York
- ↑ The Political Graveyard; Orleans County, New York
- ↑ The Political Graveyard; Tioga County, New York
- ↑ The Political Graveyard; Wayne County, New York
- ↑ Wyoming County, New York
- 1 2 3 "Dave Leip's Atlas of U.S. Presidential Elections". Uselectionatlas.org. Retrieved 2013-07-12.
- ↑ The Political Graveyard; Hamilton County, New York
- ↑ The Political Graveyard; Greene County, New York
- ↑ The Political Graveyard; Putnam County, New York
- ↑ The Political Graveyard; Steuben County, New York
- ↑ Donaldson, Gary; Liberalism’s Last Hurrah: The Presidential Campaign of 1964; p. 190 ISBN 1510702369
- ↑ Edwards, Lee and Schlafly, Phyllis; Goldwater: The Man Who Made a Revolution; pp. 286-290 ISBN 162157458X
- ↑ Kelley, Stanley junior; ‘The Goldwater Strategy’; The Princeton Review; pp. 8-11
- ↑ Johnson, Robert David; Al the way with LBJ: the 1964 Presidential Election, p. 232 ISBN 9780521425957
- ↑ Dave Leip’s Atlas of U.S. Presidential Elections; Presidential General Election Results Comparison – New York
State results of the 1964 U.S. presidential election | ||
|---|---|---|
| Candidates |
|  |
| General articles |
| |
| Other 1964 elections | ||