United States presidential election in New York, 1976
|
| ||||||||||||||||||||||||||
| ||||||||||||||||||||||||||
| ||||||||||||||||||||||||||
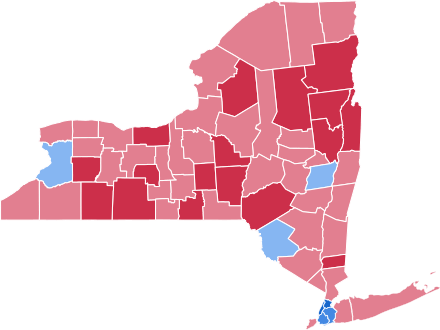 County Results
Carter—70-80%
Carter—60-70%
Carter—50-60%
Ford—50-60%
Ford—60-70% | ||||||||||||||||||||||||||
| ||||||||||||||||||||||||||

The 1976 United States presidential election in New York took place on November 2, 1976. All 50 states and The District of Columbia, were part of the 1976 United States presidential election. New York voters chose forty one electors to the Electoral College, which voted for President and Vice President.
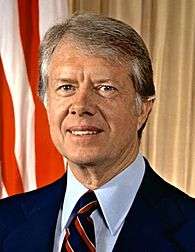
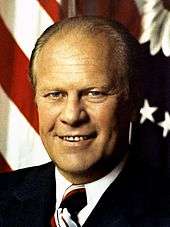
New York was won by Democratic Georgia Governor Jimmy Carter, in a narrow victory against incumbent Republican President Gerald Ford, who failed to gain the presidency through formal election that year. Carter was running with Minnesota Senator Walter Mondale, and President Ford had selected Kansas Congressman Bob Dole.
Carter took 51.95 percent of the popular vote to Ford's 47.52 percent, a victory margin of 4.43 percent.
New York weighed in as being slightly more Democratic than the national average, by about 2%. The vast majority of counties in New York were won by the more conservative Ford, but the highly populated regions of New York City, Buffalo, and Albany were able to tip the scales for the more progressive Carter.
The presidential election of 1976 was a very partisan election, with more than 99 percent of the electorate voting either Republican or Democrat.[1] Also, this election marks the first time that New York was won by a presidential candidate from the Deep South in over 100 years. The last time that a candidate from the Deep South carried the vote in this State, it was Zachary Taylor, who was elected under the US. Whig Party in 1848. Another reason why Carter (a relatively inexperienced politician at the time of the 1976 election)[2] was able to attain victory in New York, and generally, was because of the residual distaste for the Ford Administration due to the 1974 Watergate Scandal, which resulted in the resignation of then President Richard Nixon, who was succeeded by Ford.
Despite Ford being a Northern moderate, the Southerner Carter won commanding victories over Ford in four of the five boroughs of New York City. Carter broke 70% of the vote in Manhattan and the Bronx, and received over 60% of the vote in Brooklyn and Queens. Overall Carter took a citywide vote total of 66.37%, up to that point the third highest vote share ever received by a Democratic presidential candidate in New York City, surpassed only by the nationwide landslide victories of Lyndon Johnson in 1964 and Franklin Roosevelt in 1936, despite the fact that Carter was only winning a narrow 2-point victory nationwide. The massive raw vote margin in New York City provided all of Carter's narrow margin of victory in New York State. One reason for Ford's unusually weak performance in the city may have been his initial refusal to grant the nearly bankrupt city a federal bailout in 1975, sparking the infamous New York Daily News headline "Ford to City: Drop Dead."[3] While Ford ultimately would extend federal loans to the city to prevent it from falling into bankruptcy, the damage to Ford's reputation in New York City may have contributed to his poor performance in the city and his narrow loss of the state overall.
Even though Ford won an overwhelming majority of New York State's counties, Carter's landslide in massively populated New York City provided all of Carter's statewide victory margin over Ford. The 5 boroughs provided Carter with a citywide vote advantage over Ford of 716,717 votes, more than twice Carter's statewide victory margin of 288,767 votes.
Carter’s victory in New York was a key to his winning this election. Had Ford carried the state instead, along with all the other states he won, he would have been elected instead with an Electoral College victory of 281 to 256.
The 1976 Democratic National Convention was held at Madison Square Garden in New York City, in August 1976. At the convention, electors and delegates met for 3 days in New York City before formally nominating Carter to run for the presidency.
Results
| United States presidential election in New York, 1976 | |||||
|---|---|---|---|---|---|
| Party | Candidate | Votes | Percentage | Electoral votes | |
| Democratic | Jimmy Carter | 3,244,165 | 49.72% | ||
| Liberal | Jimmy Carter | 145,393 | 2.23% | ||
| Total | Jimmy Carter | 3,389,558 | 51.95% | 41 | |
| Republican | Gerald Ford | 2,825,913 | 43.31% | ||
| Conservative | Gerald Ford | 274,878 | 4.21% | ||
| Total | Gerald Ford | 3,100,791 | 47.52% | 0 | |
| Free Libertarian | Roger MacBride | 12,197 | 0.19% | 0 | |
| Communist | Gus Hall | 10,270 | 0.16% | 0 | |
| Socialist Workers | Peter Camejo | 6,996 | 0.11% | 0 | |
| U.S. Labor | Lyndon LaRouche | 5,413 | 0.08% | 0 | |
| Totals | 6,525,225 | 100.0% | 41 | ||
Results by county
| James Earl Carter Democratic |
Gerald Rudolph Ford Republican |
Various candidates Other parties |
Margin | Total votes cast | |||||
|---|---|---|---|---|---|---|---|---|---|
| County | # | % | # | % | # | % | # | % | # |
| Albany | 71,616 | 50.29% | 69,592 | 48.87% | 1,201 | 0.84% | 2,024 | 1.42% | 142,409 |
| Allegany | 6,134 | 34.06% | 11,769 | 65.35% | 107 | 0.59% | -5,635 | -31.29% | 18,010 |
| Bronx | 238,786 | 70.77% | 96,842 | 28.70% | 1,763 | 0.52% | 141,944 | 42.07% | 337,391 |
| Broome | 39,827 | 43.93% | 50,340 | 55.53% | 491 | 0.54% | -10,513 | -11.60% | 90,658 |
| Cattaraugus | 13,768 | 41.19% | 19,469 | 58.25% | 185 | 0.55% | -5,701 | -17.06% | 33,422 |
| Cayuga | 13,348 | 40.03% | 19,775 | 59.31% | 220 | 0.66% | -6,427 | -19.28% | 33,343 |
| Chautauqua | 27,447 | 44.68% | 33,730 | 54.90% | 259 | 0.42% | -6,283 | -10.23% | 61,436 |
| Chemung | 17,207 | 45.25% | 20,640 | 54.28% | 179 | 0.47% | -3,433 | -9.03% | 38,026 |
| Chenango | 7,356 | 37.08% | 12,384 | 62.43% | 97 | 0.49% | -5,028 | -25.35% | 19,837 |
| Clinton | 11,555 | 42.63% | 15,433 | 56.94% | 115 | 0.42% | -3,878 | -14.31% | 27,103 |
| Columbia | 10,514 | 39.56% | 15,871 | 59.72% | 189 | 0.71% | -5,357 | -20.16% | 26,574 |
| Cortland | 6,947 | 37.96% | 11,222 | 61.32% | 131 | 0.72% | -4,275 | -23.36% | 18,300 |
| Delaware | 7,254 | 36.59% | 12,443 | 62.76% | 130 | 0.66% | -5,189 | -26.17% | 19,827 |
| Dutchess | 37,531 | 41.65% | 51,312 | 56.94% | 1,268 | 1.41% | -13,781 | -15.29% | 90,111 |
| Erie | 229,397 | 50.66% | 220,310 | 48.65% | 3,136 | 0.69% | 9,087 | 2.01% | 452,843 |
| Essex | 6,556 | 38.97% | 10,194 | 60.59% | 74 | 0.44% | -3,638 | -21.62% | 16,824 |
| Franklin | 7,248 | 44.87% | 8,846 | 54.77% | 58 | 0.36% | -1,598 | -9.89% | 16,152 |
| Fulton | 9,323 | 43.10% | 12,161 | 56.23% | 145 | 0.67% | -2,838 | -13.12% | 21,629 |
| Genesee | 10,803 | 42.30% | 14,567 | 57.04% | 166 | 0.65% | -3,764 | -14.74% | 25,536 |
| Greene | 7,740 | 40.18% | 11,370 | 59.02% | 154 | 0.80% | -3,630 | -18.84% | 19,264 |
| Hamilton | 1,052 | 31.22% | 2,306 | 68.43% | 12 | 0.36% | -1,254 | -37.21% | 3,370 |
| Herkimer | 12,875 | 45.37% | 15,362 | 54.14% | 140 | 0.49% | -2,487 | -8.76% | 28,377 |
| Jefferson | 13,503 | 39.68% | 20,401 | 59.95% | 124 | 0.36% | -6,898 | -20.27% | 34,028 |
| Kings (Brooklyn) | 419,382 | 68.34% | 190,728 | 31.08% | 3,533 | 0.58% | 228,654 | 37.26% | 613,643 |
| Lewis | 3,764 | 39.07% | 5,840 | 60.62% | 29 | 0.30% | -2,076 | -21.55% | 9,633 |
| Livingston | 9,629 | 40.43% | 14,044 | 58.96% | 146 | 0.61% | -4,415 | -18.54% | 23,819 |
| Madison | 8,822 | 35.87% | 15,674 | 63.74% | 95 | 0.39% | -6,852 | -27.86% | 24,591 |
| Monroe | 134,739 | 44.40% | 167,303 | 55.14% | 1,392 | 0.46% | -32,564 | -10.73% | 303,434 |
| Montgomery | 11,271 | 45.57% | 13,281 | 53.70% | 182 | 0.74% | -2,010 | -8.13% | 24,734 |
| Nassau | 302,869 | 47.64% | 329,176 | 51.78% | 3,711 | 0.58% | -26,307 | -4.14% | 635,756 |
| New York (Manhattan) | 337,438 | 73.22% | 117,702 | 25.54% | 5,698 | 1.24% | 219,736 | 47.68% | 460,838 |
| Niagara | 43,667 | 48.39% | 46,101 | 51.09% | 471 | 0.52% | -2,434 | -2.70% | 90,239 |
| Oneida | 47,779 | 45.08% | 57,655 | 54.40% | 554 | 0.52% | -9,876 | -9.32% | 105,988 |
| Onondaga | 76,097 | 39.51% | 115,474 | 59.96% | 1,007 | 0.52% | -39,377 | -20.45% | 192,578 |
| Ontario | 14,044 | 39.63% | 21,118 | 59.59% | 279 | 0.79% | -7,074 | -19.96% | 35,441 |
| Orange | 40,362 | 44.51% | 49,685 | 54.80% | 626 | 0.69% | -9,323 | -10.28% | 90,673 |
| Orleans | 5,927 | 39.45% | 8,994 | 59.87% | 102 | 0.68% | -3,067 | -20.42% | 15,023 |
| Oswego | 16,332 | 40.36% | 23,949 | 59.19% | 182 | 0.45% | -7,617 | -18.82% | 40,463 |
| Otsego | 9,787 | 39.54% | 14,796 | 59.77% | 171 | 0.69% | -5,009 | -20.24% | 24,754 |
| Putnam | 11,963 | 38.95% | 18,523 | 60.31% | 225 | 0.73% | -6,560 | -21.36% | 30,711 |
| Queens | 379,907 | 60.54% | 244,396 | 38.95% | 3,200 | 0.51% | 135,511 | 21.60% | 627,503 |
| Rensselaer | 28,979 | 41.60% | 40,229 | 57.76% | 445 | 0.64% | -11,250 | -16.15% | 69,653 |
| Richmond (Staten Island) | 47,867 | 45.45% | 56,995 | 54.11% | 464 | 0.44% | -9,128 | -8.67% | 105,326 |
| Rockland | 48,673 | 47.93% | 52,087 | 51.30% | 780 | 0.77% | -3,414 | -3.36% | 101,540 |
| St. Lawrence | 17,503 | 43.83% | 22,249 | 55.71% | 182 | 0.46% | -4,746 | -11.88% | 39,934 |
| Saratoga | 23,768 | 38.04% | 38,296 | 61.29% | 422 | 0.68% | -14,528 | -23.25% | 62,486 |
| Schenectady | 31,838 | 42.60% | 40,789 | 54.58% | 2,105 | 2.82% | -8,951 | -11.98% | 74,732 |
| Schoharie | 5,250 | 41.95% | 7,154 | 57.16% | 111 | 0.89% | -1,904 | -15.21% | 12,515 |
| Schuyler | 2,885 | 40.13% | 4,267 | 59.35% | 37 | 0.51% | -1,382 | -19.22% | 7,189 |
| Seneca | 5,745 | 42.53% | 7,659 | 56.70% | 104 | 0.77% | -1,914 | -14.17% | 13,508 |
| Steuben | 14,685 | 38.63% | 23,164 | 60.93% | 166 | 0.44% | -8,479 | -22.30% | 38,015 |
| Suffolk | 208,263 | 45.27% | 248,908 | 54.10% | 2,877 | 0.63% | -40,645 | -8.83% | 460,048 |
| Sullivan | 14,189 | 50.50% | 13,709 | 48.79% | 198 | 0.70% | 480 | 1.71% | 28,096 |
| Tioga | 6,969 | 36.89% | 11,824 | 62.58% | 100 | 0.53% | -4,855 | -25.70% | 18,893 |
| Tompkins | 12,808 | 44.67% | 15,463 | 53.93% | 400 | 1.40% | -2,655 | -9.26% | 28,671 |
| Ulster | 30,190 | 45.64% | 35,353 | 53.44% | 610 | 0.92% | -5,163 | -7.80% | 66,153 |
| Warren | 7,264 | 33.15% | 14,548 | 66.39% | 100 | 0.46% | -7,284 | -33.24% | 21,912 |
| Washington | 7,262 | 34.06% | 13,946 | 65.40% | 116 | 0.54% | -6,684 | -31.34% | 21,324 |
| Wayne | 12,061 | 38.22% | 19,324 | 61.24% | 172 | 0.55% | -7,263 | -23.02% | 31,557 |
| Westchester | 173,153 | 45.06% | 208,527 | 54.26% | 2,616 | 0.68% | -35,374 | -9.20% | 384,296 |
| Wyoming | 5,737 | 36.92% | 9,726 | 62.59% | 76 | 0.49% | -3,989 | -25.67% | 15,539 |
| Yates | 2,903 | 33.21% | 5,796 | 66.30% | 43 | 0.49% | -2,893 | -33.09% | 8,742 |
| Totals | 3,389,558 | 51.87% | 3,100,791 | 47.45% | 44,071 | 0.67% | 288,767 | 4.42% | 6,534,420 |
See also
References
- ↑ "1976 Presidential General Election Results — New York". Dave Leip’s Atlas of U.S. Presidential Elections. Retrieved 2013-07-09.
- ↑ Election of 1976: A Political Outsider Prevails. C-SPAN. Retrieved on 2013-07-09.
- ↑ Van Riper, Frank (October 30, 1975). "Ford to New York: Drop Dead". Daily News. New York. Archived from the original on October 6, 2008. Retrieved March 2, 2014.
| Candidates | 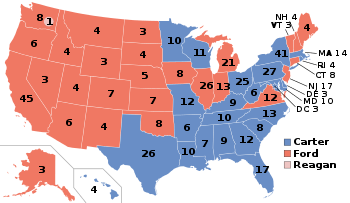 | |
|---|---|---|
| General articles | ||
| Local results |
| |
| Other 1976 elections | ||