United States presidential election in New York, 1968
|
| |||||||||||||||||||||||||||||||||
| |||||||||||||||||||||||||||||||||
| |||||||||||||||||||||||||||||||||
 County Results
Humphrey—70-80%
Humphrey—60-70%
Humphrey—50-60%
Humphrey—<50%
Nixon—<50%
Nixon—50-60%
Nixon—60-70% | |||||||||||||||||||||||||||||||||
| |||||||||||||||||||||||||||||||||
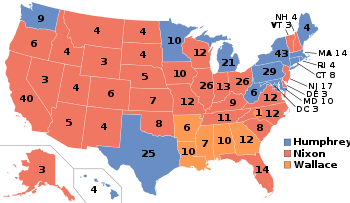
The 1968 United States presidential election in New York took place on November 5, 1968. All fifty states and the District of Columbia, were part of the 1968 United States presidential election. New York voters chose forty three electors to the Electoral College, which selected the president and vice president.
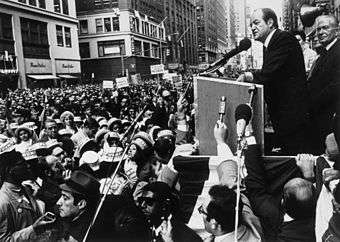
New York was won by incumbent Democratic Vice President Hubert Humphrey, who was running against former Republican Vice President Richard Nixon. Hubert Humphrey ran with Maine Senator Edmund Muskie for vice president, and Nixon ran with Maryland Governor Spiro Agnew. Former and future Alabama Governor George Wallace ran a strong third-party insurgent campaign as a Southern populist with his American Independent Party.
Humphrey took 49.76 percent of the vote to Nixon's 44.30%, a victory margin of 5.46 percent. Wallace, a mostly Southern-oriented candidate, came in a distant third, with 5.29 percent. He did best in suburban and exurban counties around New York, and reached double figures in some wholly Italian-American precincts.[2] In these, Wallace's pro-segregation stance was popular due to African-Americans taking over the national Democratic Party locally;[3] however in the inner cities and upstate counties his views were seen as repugnant.
New York weighed in for this election as seven percentage points more Democratic than the national average.
The presidential election of 1968 was a very multi-partisan election for New York, with almost six percent of the electorate voting for Third Parties.[4] In typical form for the time, the highly populated centers of New York City, Buffalo, and Albany, voted Democratic, while the smaller counties in New York turned out for Nixon as the Republican candidate.
Despite Nixon winning a strong majority of the state's counties, Humphrey's dominant performance in massively populated New York City provided him with his statewide victory, receiving 60.6% of the vote in the five boroughs to Nixon's 33.9 percent, a 26.7 percent Democratic victory margin in the City of New York amounting to a raw vote advantage for Humphrey of 695,722 votes, providing all of Humphrey's 370,538 statewide vote advantage.
Humphrey won the election in New York with a strong 5 percentage point margin. The election results in New York represent a trend in the national mentality towards progressive politics, resulting from nationwide emergence of the hippie counterculture, the riots following the assassination of Martin Luther King Jr., numerous demonstrations in opposition to the Vietnam War, and the violent confrontation between police and protesters at the 1968 Democratic National Convention in Chicago. Humphrey was seen by many as promising to continue the reformist legacy of President Johnson,[5] and this garnered him much support by liberal voters across America.
Nationwide, the election of 1968 was very contentious across the United States. Nixon, running on a largely socially conservative agenda, was able to attain victory nationwide with less than 1% popular lead on Humphrey, while the historically one-party Democratic stronghold of the Deep South turned out en masse for their own George Wallace, who was spearheading the new American Independent Party.
As of the 2016 presidential election, this is the last election where New York had the most number of electoral votes.
Results
| United States presidential election in New York, 1968 | |||||
|---|---|---|---|---|---|
| Party | Candidate | Votes | Percentage | Electoral votes | |
| Democratic | Hubert Humphrey | 3,066,848 | 45.17% | ||
| Liberal | Hubert Humphrey | 311,622 | 4.59% | ||
| Total | Hubert Humphrey | 3,378,470 | 49.76% | 43 | |
| Republican | Richard Nixon | 3,007,932 | 44.30% | 0 | |
| American Independent[lower-alpha 1] | George Wallace | 358,864 | 5.29% | 0 | |
| Peace and Freedom | Dick Gregory | 24,517 | 0.36% | 0 | |
| Socialist Workers | Fred Halstead | 11,851 | 0.17% | 0 | |
| Socialist Labor | Henning Blomen | 8,432 | 0.12% | 0 | |
| Totals | 6,790,066 | 100.0% | 43 | ||
Results by county
| Hubert Horatio Humphrey Jr. Democratic |
Richard Milhous Nixon Republican |
George Corley Wallace Courage |
Various candidates Other parties |
Margin | Total votes cast | ||||||
|---|---|---|---|---|---|---|---|---|---|---|---|
| County | # | % | # | % | # | % | # | % | # | % | # |
| Albany | 80,724 | 57.93% | 52,948 | 38.00% | 5,025 | 3.61% | 654 | 0.47% | 27,776 | 19.93% | 139,351 |
| Allegany | 4,986 | 29.08% | 11,222 | 65.45% | 851 | 4.96% | 86 | 0.50% | -6,236 | -36.37% | 17,145 |
| Bronx | 277,385 | 62.40% | 142,314 | 32.02% | 21,950 | 4.94% | 2,868 | 0.65% | 135,071 | 30.39% | 444,517 |
| Broome | 37,451 | 41.93% | 46,872 | 52.48% | 4,618 | 5.17% | 370 | 0.41% | -9,421 | -10.55% | 89,311 |
| Cattaraugus | 12,733 | 40.88% | 16,594 | 53.27% | 1,674 | 5.37% | 147 | 0.47% | -3,861 | -12.40% | 31,148 |
| Cayuga | 14,604 | 44.71% | 16,167 | 49.49% | 1,826 | 5.59% | 69 | 0.21% | -1,563 | -4.78% | 32,666 |
| Chautauqua | 26,431 | 45.18% | 28,561 | 48.82% | 3,273 | 5.59% | 242 | 0.41% | -2,130 | -3.64% | 58,507 |
| Chemung | 15,820 | 40.00% | 20,693 | 52.32% | 2,807 | 7.10% | 233 | 0.59% | -4,873 | -12.32% | 39,553 |
| Chenango | 5,706 | 30.92% | 11,785 | 63.86% | 887 | 4.81% | 77 | 0.42% | -6,079 | -32.94% | 18,455 |
| Clinton | 10,153 | 43.82% | 11,951 | 51.58% | 931 | 4.02% | 133 | 0.57% | -1,798 | -7.76% | 23,168 |
| Columbia | 7,762 | 33.62% | 13,857 | 60.03% | 1,372 | 5.94% | 94 | 0.41% | -6,095 | -26.40% | 23,085 |
| Cortland | 5,791 | 34.47% | 10,209 | 60.76% | 720 | 4.29% | 81 | 0.48% | -4,418 | -26.30% | 16,801 |
| Delaware | 5,360 | 28.36% | 12,366 | 65.44% | 1,121 | 5.93% | 51 | 0.27% | -7,006 | -37.07% | 18,898 |
| Dutchess | 31,025 | 37.80% | 45,032 | 54.87% | 5,662 | 6.90% | 348 | 0.42% | -14,007 | -17.07% | 82,067 |
| Erie | 250,054 | 55.18% | 167,853 | 37.04% | 33,402 | 7.37% | 1,856 | 0.41% | 82,201 | 18.14% | 453,165 |
| Essex | 5,218 | 33.98% | 9,377 | 61.07% | 701 | 4.57% | 59 | 0.38% | -4,159 | -27.09% | 15,355 |
| Franklin | 6,678 | 42.80% | 8,314 | 53.29% | 544 | 3.49% | 66 | 0.42% | -1,636 | -10.49% | 15,602 |
| Fulton | 8,871 | 40.66% | 11,895 | 54.52% | 989 | 4.53% | 63 | 0.29% | -3,024 | -13.86% | 21,818 |
| Genesee | 9,533 | 41.18% | 12,418 | 53.64% | 1,141 | 4.93% | 58 | 0.25% | -2,885 | -12.46% | 23,150 |
| Greene | 5,499 | 30.56% | 10,954 | 60.87% | 1,421 | 7.90% | 123 | 0.68% | -5,455 | -30.31% | 17,997 |
| Hamilton | 762 | 24.96% | 2,123 | 69.54% | 163 | 5.34% | 5 | 0.16% | -1,361 | -44.58% | 3,053 |
| Herkimer | 10,940 | 39.54% | 15,192 | 54.91% | 1,455 | 5.26% | 78 | 0.28% | -4,252 | -15.37% | 27,665 |
| Jefferson | 13,438 | 40.59% | 18,552 | 56.03% | 1,016 | 3.07% | 103 | 0.31% | -5,114 | -15.45% | 33,109 |
| Kings (Brooklyn) | 489,174 | 63.12% | 247,936 | 31.99% | 33,563 | 4.33% | 4,296 | 0.55% | 241,238 | 31.13% | 774,969 |
| Lewis | 3,205 | 34.91% | 5,524 | 60.17% | 430 | 4.68% | 21 | 0.23% | -2,319 | -25.26% | 9,180 |
| Livingston | 6,989 | 35.82% | 11,659 | 59.75% | 775 | 3.97% | 90 | 0.46% | -4,670 | -23.93% | 19,513 |
| Madison | 7,056 | 32.06% | 13,819 | 62.79% | 1,053 | 4.78% | 82 | 0.37% | -6,763 | -30.73% | 22,010 |
| Monroe | 141,437 | 47.66% | 143,233 | 48.27% | 10,875 | 3.66% | 1,210 | 0.41% | -1,796 | -0.61% | 296,755 |
| Montgomery | 11,449 | 45.33% | 12,566 | 49.75% | 1,147 | 4.54% | 95 | 0.38% | -1,117 | -4.42% | 25,257 |
| Nassau | 278,599 | 43.31% | 329,792 | 51.27% | 30,860 | 4.80% | 3,944 | 0.61% | -51,193 | -7.96% | 643,195 |
| New York (Manhattan) | 370,806 | 70.04% | 135,458 | 25.59% | 12,958 | 2.45% | 10,170 | 1.92% | 235,348 | 44.46% | 529,392 |
| Niagara | 41,999 | 47.77% | 38,796 | 44.12% | 6,617 | 7.53% | 513 | 0.58% | 3,203 | 3.64% | 87,925 |
| Oneida | 44,685 | 43.07% | 52,875 | 50.96% | 5,666 | 5.46% | 535 | 0.52% | -8,190 | -7.89% | 103,761 |
| Onondaga | 83,576 | 44.02% | 95,806 | 50.46% | 9,459 | 4.98% | 1,024 | 0.54% | -12,230 | -6.44% | 189,865 |
| Ontario | 11,719 | 38.94% | 17,114 | 56.86% | 1,180 | 3.92% | 85 | 0.28% | -5,395 | -17.92% | 30,098 |
| Orange | 28,122 | 35.09% | 44,955 | 56.09% | 6,473 | 8.08% | 599 | 0.75% | -16,833 | -21.00% | 80,149 |
| Orleans | 4,786 | 34.13% | 8,509 | 60.67% | 696 | 4.96% | 33 | 0.24% | -3,723 | -26.55% | 14,024 |
| Oswego | 14,636 | 39.72% | 20,041 | 54.39% | 1,962 | 5.33% | 206 | 0.56% | -5,405 | -14.67% | 36,845 |
| Otsego | 7,981 | 35.16% | 13,543 | 59.67% | 1,091 | 4.81% | 81 | 0.36% | -5,562 | -24.51% | 22,696 |
| Putnam | 8,472 | 34.84% | 13,293 | 54.67% | 2,388 | 9.82% | 161 | 0.66% | -4,821 | -19.83% | 24,314 |
| Queens | 410,546 | 53.60% | 306,620 | 40.03% | 44,198 | 5.77% | 4,548 | 0.59% | 103,926 | 13.57% | 765,912 |
| Rensselaer | 30,232 | 44.02% | 34,674 | 50.49% | 3,461 | 5.04% | 314 | 0.46% | -4,442 | -6.47% | 68,681 |
| Richmond (Staten Island) | 34,770 | 35.18% | 54,631 | 55.28% | 9,112 | 9.22% | 311 | 0.31% | -19,861 | -20.10% | 98,824 |
| Rockland | 36,948 | 44.35% | 40,880 | 49.07% | 5,028 | 6.04% | 451 | 0.54% | -3,932 | -4.72% | 83,307 |
| St. Lawrence | 15,662 | 41.29% | 20,982 | 55.31% | 1,178 | 3.11% | 111 | 0.29% | -5,320 | -14.02% | 37,933 |
| Saratoga | 17,766 | 38.69% | 25,658 | 55.87% | 2,220 | 4.83% | 278 | 0.61% | -7,892 | -17.19% | 45,922 |
| Schenectady | 34,786 | 48.31% | 33,687 | 46.79% | 3,246 | 4.51% | 283 | 0.39% | 1,099 | 1.53% | 72,002 |
| Schoharie | 3,883 | 36.03% | 6,166 | 57.21% | 689 | 6.39% | 39 | 0.36% | -2,283 | -21.18% | 10,777 |
| Schuyler | 2,034 | 30.38% | 4,105 | 61.31% | 522 | 7.80% | 35 | 0.52% | -2,071 | -30.93% | 6,696 |
| Seneca | 5,222 | 40.15% | 7,083 | 54.46% | 635 | 4.88% | 65 | 0.50% | -1,861 | -14.31% | 13,005 |
| Steuben | 12,229 | 31.61% | 24,189 | 62.52% | 2,194 | 5.67% | 78 | 0.20% | -11,960 | -30.91% | 38,690 |
| Suffolk | 122,590 | 32.71% | 218,027 | 58.18% | 31,304 | 8.35% | 2,846 | 0.76% | -95,437 | -25.47% | 374,767 |
| Sullivan | 10,860 | 44.88% | 11,657 | 48.17% | 1,487 | 6.15% | 194 | 0.80% | -797 | -3.29% | 24,198 |
| Tioga | 5,336 | 31.47% | 10,441 | 61.58% | 1,127 | 6.65% | 52 | 0.31% | -5,105 | -30.11% | 16,956 |
| Tompkins | 10,343 | 40.97% | 13,446 | 53.26% | 1,236 | 4.90% | 223 | 0.88% | -3,103 | -12.29% | 25,248 |
| Ulster | 20,886 | 34.59% | 34,798 | 57.62% | 4,183 | 6.93% | 520 | 0.86% | -13,912 | -23.04% | 60,387 |
| Warren | 6,460 | 31.85% | 12,963 | 63.92% | 807 | 3.98% | 50 | 0.25% | -6,503 | -32.07% | 20,280 |
| Washington | 6,806 | 33.09% | 12,694 | 61.71% | 930 | 4.52% | 139 | 0.68% | -5,888 | -28.63% | 20,569 |
| Wayne | 8,907 | 32.17% | 17,470 | 63.09% | 1,211 | 4.37% | 101 | 0.36% | -8,563 | -30.93% | 27,689 |
| Westchester | 173,954 | 43.40% | 201,652 | 50.31% | 22,115 | 5.52% | 3,086 | 0.77% | -27,698 | -6.91% | 400,807 |
| Wyoming | 4,477 | 32.52% | 8,459 | 61.45% | 799 | 5.80% | 30 | 0.22% | -3,982 | -28.93% | 13,765 |
| Yates | 2,158 | 26.59% | 5,482 | 67.54% | 440 | 5.42% | 37 | 0.46% | -3,324 | -40.95% | 8,117 |
| Totals | 3,378,470 | 49.76% | 3,007,932 | 44.30% | 358,864 | 5.29% | 44,800 | 0.66% | 370,538 | 5.46% | 6,790,066 |
See also
Notes
- ↑ New York law forbids the use of the word "American" in a party's name, and so the American Independent Party was named as the "Courage Party" on the ballot in New York State.[6]
References
- ↑ Although he was born in California and he served as a U.S. Senator from California, in 1968 Richard Nixon's official state of residence was New York, having moved there to practice law after his defeat in the 1962 California gubernatorial election. During his first term as president, Nixon re-established his residency in California. Consequently, most reliable reference books list Nixon's home state as New York in the 1968 election and his home state as California in the 1972 (and 1960) election.
- ↑ Phillips, Kevin P.; The Emerging Republican Majority, pp. 69-70 ISBN 9780691163246
- ↑ Phillips; The Emerging Republican Majority, p. 10
- ↑ "1968 Presidential General Election Results — New York". Dave Leip's Atlas of U.S. Presidential Elections. Retrieved 2018-01-09.
- ↑ Lewis L. Gould (2010). 1968: The Election That Changed America. Government Institutes. pp. 16–18.
- ↑ "Courage Party in State Wants Wallace on Ballot". The New York Times. 18 June 1972. Retrieved 21 March 2017.
| Candidates |
|  |
|---|---|---|
| General articles |
| |
| Local results |
| |
| Other 1968 elections | ||