United States House of Representatives elections, 1992
|
| |||||||||||||||||||||||||||||||||||||||||||||||||||||||||||
| |||||||||||||||||||||||||||||||||||||||||||||||||||||||||||
All 435 seats to the United States House of Representatives 218 seats needed for a majority | |||||||||||||||||||||||||||||||||||||||||||||||||||||||||||
|---|---|---|---|---|---|---|---|---|---|---|---|---|---|---|---|---|---|---|---|---|---|---|---|---|---|---|---|---|---|---|---|---|---|---|---|---|---|---|---|---|---|---|---|---|---|---|---|---|---|---|---|---|---|---|---|---|---|---|---|
| |||||||||||||||||||||||||||||||||||||||||||||||||||||||||||
 Democratic hold Democratic gain Republican hold Republican gain Independent hold | |||||||||||||||||||||||||||||||||||||||||||||||||||||||||||
| |||||||||||||||||||||||||||||||||||||||||||||||||||||||||||
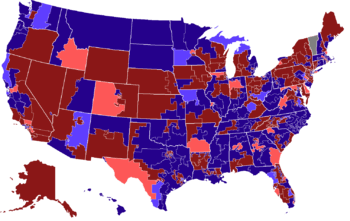
The 1992 United States House of Representatives elections coincided with the 1992 presidential election, in which Democrat Bill Clinton was elected as President, defeating Republican incumbent President George H. W. Bush.
Despite this, however, the Democrats lost a net of nine seats in the House to the Republicans, in part due to redistricting following the 1990 Census. The Democrats nonetheless retained a majority in the House and Senate.
This election was the first using districts drawn on the basis of the 1990 Census. The redrawn districts were notable for the increase in majority-minority districts, drawn as mandated by the Voting Rights Act. The 1980 Census resulted in 17 majority-black districts and 10 majority-Hispanic districts, but 32 and 19 such districts, respectively, were drawn after 1990.[1]
Among the Representatives first elected in 1992 were eight future Senators (Sherrod Brown, Maria Cantwell, Mike Crapo, Rod Grams, Tim Hutchinson, Blanche Lincoln, Bob Menendez, and Jim Talent) and three future Governors (Nathan Deal, Jay Inslee, and Ted Strickland). Also elected were future San Diego mayor Bob Filner, future Milwaukee mayor Tom Barrett, 2008 Green Party presidential nominee Cynthia McKinney, and the first Korean-American elected to Congress, Jay Kim.
Overall results
| 258 | 1 | 176 |
| Democratic | I | Republican |
| Party | Seats | Share | Popular vote | ||||
|---|---|---|---|---|---|---|---|
| Last election (1990) |
This election |
Net change | |||||
| Democratic Party | 267 | 258 | 59.3% | 50.1% | 48,654,189 | ||
| Republican Party | 167 | 176 | 40.5% | 45.1% | 43,812,063 | ||
| Independent | 1 | 1 | 0.2% | 1.3% | 1,255,726 | ||
| Libertarian Party | 0 | 0 | 0.0% | 0.9% | 848,614 | ||
| Peace and Freedom Party | 0 | 0 | 0.0% | 0.3% | 267,827 | ||
| Green Party | 0 | 0 | 0.0% | 0.1% | 134,072 | ||
| Natural Law Party | 0 | 0 | 0.0% | 0.1% | 100,782 | ||
| Right to Life Party | 0 | 0 | 0.0% | 0.1% | 93,452 | ||
| Conservative Party | 0 | 0 | 0.0% | 0.1% | 74,387 | ||
| A Connecticut Party | 0 | 0 | 0.0% | 0.1% | 65,701 | ||
| U.S. Taxpayers' Party | 0 | 0 | 0.0% | <0.1% | 46,100 | ||
| Ross Perot Independent Party | 0 | 0 | 0.0% | <0.1% | 45,042 | ||
| Grassroots Party | 0 | 0 | 0.0% | <0.1% | 42,585 | ||
| For The People Party | 0 | 0 | 0.0% | <0.1% | 38,963 | ||
| Independent Voters Party | 0 | 0 | 0.0% | <0.1% | 29,381 | ||
| Louanner Peters Party | 0 | 0 | 0.0% | <0.1% | 19,293 | ||
| Populist Party | 0 | 0 | 0.0% | <0.1% | 17,600 | ||
| Economic Recovery Party | 0 | 0 | 0.0% | <0.1% | 16,712 | ||
| Independent for Change Party | 0 | 0 | 0.0% | <0.1% | 16,170 | ||
| Independent American Party | 0 | 0 | 0.0% | <0.1% | 13,285 | ||
| New Alliance Party | 0 | 0 | 0.0% | <0.1% | 12,125 | ||
| Socialist Workers Party | 0 | 0 | 0.0% | <0.1% | 11,787 | ||
| Tisch Independent Citizens Party | 0 | 0 | 0.0% | <0.1% | 10,706 | ||
| Independent Congressional Party | 0 | 0 | 0.0% | <0.1% | 9,327 | ||
| Liberal Party | 0 | 0 | 0.0% | <0.1% | 9,022 | ||
| Term Limits Candidate Party | 0 | 0 | 0.0% | <0.1% | 8,602 | ||
| Freedom for LaRouche Party | 0 | 0 | 0.0% | <0.1% | 7,550 | ||
| Peace, Jobs, Justice Party | 0 | 0 | 0.0% | <0.1% | 7,162 | ||
| Workers League Party | 0 | 0 | 0.0% | <0.1% | 6,931 | ||
| Magerman for Congress Party | 0 | 0 | 0.0% | <0.1% | 5,850 | ||
| Clean Up Congress Party | 0 | 0 | 0.0% | <0.1% | 4,491 | ||
| Pro-Democracy Reform Party | 0 | 0 | 0.0% | <0.1% | 4,355 | ||
| Workers World Party | 0 | 0 | 0.0% | <0.1% | 4,270 | ||
| Pro-Life Pro-Family Veteran Party | 0 | 0 | 0.0% | <0.1% | 3,761 | ||
| Economic Justice Party | 0 | 0 | 0.0% | <0.1% | 3,727 | ||
| Liberty Union Party | 0 | 0 | 0.0% | <0.1% | 3,660 | ||
| New Independent Party | 0 | 0 | 0.0% | <0.1% | 3,650 | ||
| Independents Party | 0 | 0 | 0.0% | <0.1% | 3,281 | ||
| Independent Thinking Party | 0 | 0 | 0.0% | <0.1% | 3,250 | ||
| Time for Change Party | 0 | 0 | 0.0% | <0.1% | 3,127 | ||
| Independent Fusion Party | 0 | 0 | 0.0% | <0.1% | 2,970 | ||
| Independents for Change Party | 0 | 0 | 0.0% | <0.1% | 2,916 | ||
| None of Above Party | 0 | 0 | 0.0% | <0.1% | 2,754 | ||
| No Nonsense Government Party | 0 | 0 | 0.0% | <0.1% | 2,612 | ||
| American Party | 0 | 0 | 0.0% | <0.1% | 2,608 | ||
| Stop Tax Increases Party | 0 | 0 | 0.0% | <0.1% | 2,363 | ||
| Pro-Life Independent Conservative Party | 0 | 0 | 0.0% | <0.1% | 2,163 | ||
| The People's Candidate Party | 0 | 0 | 0.0% | <0.1% | 2,153 | ||
| Independent Fusion Party | 0 | 0 | 0.0% | <0.1% | 1,073 | ||
| Equality, Brotherhood, Justice Party | 0 | 0 | 0.0% | <0.1% | 994 | ||
| Reform Party | 0 | 0 | 0.0% | <0.1% | 962 | ||
| You Gotta Believe Party | 0 | 0 | 0.0% | <0.1% | 951 | ||
| Donald of Moorestown Party | 0 | 0 | 0.0% | <0.1% | 901 | ||
| People's Congressional Preference Party | 0 | 0 | 0.0% | <0.1% | 684 | ||
| An Independent Voice Party | 0 | 0 | 0.0% | <0.1% | 515 | ||
| Basic Reformed Government Party | 0 | 0 | 0.0% | <0.1% | 512 | ||
| Capitalist Party | 0 | 0 | 0.0% | <0.1% | 273 | ||
| Others | 0 | 0 | 0.0% | 1.5% | 1,452,334 | ||
| Totals | 435 | 435 | 100.0% | 100.0% | 97,198,316 | ||
Source: Election Statistics - Office of the Clerk
|
[[Image:103 us house membership.png|thumb|450px|
|
[[Image:103 us house changes.png|thumb|450px|
|
||||||||||||||||||||||
Retiring Incumbents
64 Representatives did not seek re-election: 40 Democrats and 24 Republicans.
Democrats
- Claude Harris, Jr. (D) AL-7
- Barbara Boxer (D) CA-6
- Edward R. Roybal (D) CA-30
- Mel Levine (D) CA-36
- Mervyn M. Dymally (D) CA-37
- Glenn M. Anderson (D) CA-38
- Ben Nighthorse Campbell (D) CO-3
- Tom Carper (D) DE-AL
- Charles Edward Bennett (D) FL-3
- Lawrence J. Smith (D) FL-16
- William Lehman (D) FL-17
- Dante Fascell (D) FL-19
- Robert Lindsay Thomas (D) GA-1
- Ed Jenkins (D) GA-9
- Doug Barnard, Jr. (D) GA-10
- Richard H. Stallings (D) ID-2
- Frank Annunzio (D) IL-5
- Carl C. Perkins (D) KY-7
- Brian J. Donnelly (D) MA-9
- J. Bob Traxler (D) MI-5
- Howard Wolpe (D) MI-8
- Dennis M. Hertel (D) MI-12
- Bernard J. Dwyer (D) NJ-6
- Robert A. Roe (D) NJ-8
- Frank Joseph Guarini (D) NJ-14
- Robert J. Mrazek (D) NY-3
- James H. Scheuer (D) NY-8
- Matthew F. McHugh (D) NY-28
- Henry J. Nowak (D) NY-33
- Charlie Luken (D) OH-1
- Dennis E. Eckart (D) OH-11
- Don Pease (D) OH-13
- Ed Feighan (D) OH-19
- Les AuCoin (D) OR-1
- Gus Yatron (D) PA-6
- Joseph M. Gaydos (D) PA-20
- Robin Tallon (D) SC-6
- Wayne Owens (D) UT-2
- Jim Olin (D) VA-6
- Jim Moody (D) WI-5
Republicans
- William Louis Dickinson (R) AL-2
- John Paul Hammerschmidt (R) AR-3
- Tom Campbell (R) CA-14
- William E. Dannemeyer (R) CA-39
- Bill Lowery (R) CA-41
- Craig T. James (R) FL-4
- Andy Ireland (R) FL-10
- Larry J. Hopkins (R) KY-6
- Robert William Davis (R) MI-1
- Carl Pursell (R) MI-7
- William Broomfield (R) MI-11
- Vin Weber (R) MN-2
- Matthew J. Rinaldo (R) NJ-7
- Norman F. Lent (R) NY-4
- Raymond J. McGrath (R) NY-5
- David O'Brien Martin (R) NY-26
- Frank Horton (R) NY-29
- Chalmers P. Wylie (R) OH-15
- Richard T. Schulze (R) PA-5
- R. Lawrence Coughlin (R) PA-13
- George Allen (R) VA-7
- John R. Miller (R) WA-1
- Sid Morrison (R) WA-4
- Jennifer Dunn (R) WA-8
Incumbents Defeated
- Ben Erdreich (D) AL-6
- John Jacob Rhodes III (R) AZ-1
- William Vollie Alexander, Jr. (D) AR-1
- Beryl Anthony, Jr. (D) AR-4
- Frank Riggs (R) CA-1
- Robert J. Lagomarsino (R) CA-22
- Charles Floyd Hatcher (D) GA-2
- Ben L. Jones (D) GA-10
- Charles Hayes (D) IL-1
- Gus Savage (D) IL-2
- Marty Russo (D) IL-3
- John W. Cox, Jr. (D) IL-16
- Terry L. Bruce (D) IL-19
- Jim Jontz (D) IN-5
- David R. Nagle (D) IA-2
- Dick Nichols (R) KS-4
- Carroll Hubbard (D) KY-1
- Jerry Huckaby (D) LA-5
- Clyde C. Holloway (R) LA-6
- Charles Thomas McMillen (D) MD-1
- Beverly Byron (D) MD-6
- Joseph D. Early (D) MA-3
- Chester G. Atkins (D) MA-5
- Nicholas Mavroules (D) MA-6
Alabama
| District | Incumbent | Party | First elected |
Result | Candidates |
|---|---|---|---|---|---|
| Alabama 1 | Sonny Callahan | Republican | 1984 | Incumbent re-elected. | √ Sonny Callahan (Republican) 60.2% William Brewer (Democratic) 36.8% John Garrett (Libertarian) 3.0% |
| Alabama 2 | William Louis Dickinson | Republican | 1964 | Incumbent retired. New member elected. Republican hold. |
√ Terry Everett (Republican) 49.5% George Wallace Jr. (Democratic) 47.9% Glynn Reeves (Libertarian) 1.4% Malcolm Brassell (Independent) 0.6% Richard Boone (Independent) 0.6% |
| Alabama 3 | Glen Browder | Democratic | 1989 | Incumbent re-elected. | √ Glen Browder (Democratic) 60.3% Don Sledge (Republican) 37.3% Rodric Templeton (Libertarian) 2.3% |
| Alabama 4 | Tom Bevill | Democratic | 1966 | Incumbent re-elected. | √ Tom Bevill (Democratic) 68.5% Martha Strickland (Republican) 29.0% Robert King (Libertarian) 2.5% |
| Alabama 5 | Robert E. Cramer | Democratic | 1990 | Incumbent re-elected. | √ Robert E. Cramer (Democratic) 65.6% Terry Smith (Republican) 31.9% Michael Seibert (Libertarian) 2.5% |
| Alabama 6 | Ben Erdreich | Democratic | 1982 | Incumbent lost re-election. New member elected. Republican gain. |
√ Spencer Bachus (Republican) 52.3% Ben Erdreich (Democratic) 45.0% Carla Cloum (Independent) 1.6% Mark Bodenhausen (Libertarian) 1.0% |
| Alabama 7 | Claude Harris, Jr. | Democratic | 1986 | Incumbent retired. New member elected. Democratic hold. |
√ Earl F. Hilliard (Democratic) 69.5% Kervin Jones (Republican) 17.4% James Lewis (Independent) 6.0% James Chambliss (Independent) 5.5% Michael Todd Mayer (Libertarian) 1.0% John Hawkins (SW) 0.6% |
Alaska
| District | Incumbent | Party | First elected |
Result | Candidates |
|---|---|---|---|---|---|
| Alaska at-large | Don Young | Republican | 1973 | Incumbent re-elected. | √ Don Young (Republican) 46.7% John Devens (Democratic) 42.8% Michael States (A) 6.2% Mike Milligan (Green) 3.9% |
Arizona
| District | Incumbent | Party | First elected |
Result | Candidates |
|---|---|---|---|---|---|
| Arizona 1 | John Jacob Rhodes III | Republican | 1986 | Incumbent lost re-election. New member elected. Democratic gain. |
√ Sam Coppersmith (Democratic) 51.3% John Jacob Rhodes III (Republican) 44.6% Ted Goldstein (Natural Law) 4.1% |
| Arizona 2 | Ed Pastor | Democratic | 1991 (Special) | Incumbent re-elected. | √ Ed Pastor (Democratic) 66.0% Don Shooter (Republican) 30.0% Dan Detaranto (Libertarian) 4.0% |
| Arizona 3 | Bob Stump | Republican | 1976 | Incumbent re-elected. | √ Bob Stump (Republican) 61.5% Roger Hartstone (Democratic) 34.4% Pamela Volponi (Natural Law) 4.1% |
| Arizona 4 | Jon Kyl | Republican | 1986 | Incumbent re-elected. | √ Jon Kyl (Republican) 59.2% Walter Mybeck (Democratic) 26.7% Debbie Collings (Independent) 9.7% Tim McDermott (Libertarian) 4.4% |
| Arizona 5 | Jim Kolbe | Republican | 1984 | Incumbent re-elected. | √ Jim Kolbe (Republican) 66.5% Jim Toevs (Democratic) 29.7% Perry Willis (Libertarian) 3.7% |
| Arizona 6 | None (District created) | New seat. New member elected. Democratic gain. |
√ Karan English (Democratic) 53.0% Doug Wead (Republican) 41.4% Sarah Stannard (Independent) 5.6% | ||
Arkansas
| District | Incumbent | Party | First elected |
Result | Candidates |
|---|---|---|---|---|---|
| Arkansas 1 | Bill Alexander | Democratic | 1968 | Incumbent lost renomination. New member elected. Democratic hold. |
√ Blanche Lincoln (Democratic) 69.8% Terry Hayes (Republican) 30.2% |
| Arkansas 2 | Ray Thornton | Democratic | 1990 | Incumbent re-elected. | √ Ray Thornton (Democratic) 74.2% Dennis Scott (Republican) 25.8% |
| Arkansas 3 | John Paul Hammerschmidt | Republican | 1966 | Incumbent retired. New member elected. Republican hold. |
√ Tim Hutchinson (Republican) 50.2% John VanWinkle (Democratic) 47.2% Ralph Forbes (Independent) 2.5% |
| Arkansas 4 | Beryl Anthony, Jr. | Democratic | 1978 | Incumbent lost renomination. New member elected. Republican gain. |
√ Jay Dickey (Republican) 52.3% Bill McCuen (Democratic) 47.7% |
California
The delegation increased from 45 to 52 seats. To create the seven-seat net gain, eight seats were added, designated as: the 10th, 11th, 25th, 33rd, 41st, 43rd, 49th, and 50th districts, and one seat was lost through the merger of two seats: the former 41st and 44th districts merged into the redesignated 51st district, in an election contest.
| District | Incumbent | Party | First elected |
Results | Candidates |
|---|---|---|---|---|---|
| California 1 | Frank Riggs | Republican | 1990 | Incumbent lost re-election. New member elected. Democratic gain. |
√ Dan Hamburg (Democratic) 47.6% Frank Riggs (Republican) 45.1% Phil Baldwin (Peace and Freedom) 4.3% Matthew L. Howard (Libertarian) 3% |
| California 2 | Wally Herger | Republican | 1986 | Incumbent re-elected. | √ Wally Herger (Republican) 65.2% Elliot Roy Freedman (Democratic) 28% Harry Hugh "Doc" Pendery (Libertarian) 6.8% |
| California 3 | Vic Fazio Redistricted from the 4th district |
Democratic | 1978 | Incumbent re-elected. | √ Vic Fazio (Democratic) 51.2% H. L. Richardson (Republican) 40.3% Ross Crain (Libertarian) 8.6% |
| California 4 | John Doolittle Redistricted from the 14th district |
Republican | 1990 | Incumbent re-elected. | √ John Doolittle (Republican) 49.8% Patricia Malberg (Democratic) 45.7% Patrick Lee McHargue (Libertarian) 4.5% |
| California 5 | Bob Matsui Redistricted from the 3rd district |
Democratic | 1978 | Incumbent re-elected. | √ Bob Matsui (Democratic) 68.6% Robert S. Dinsmore (Republican) 25.5% Gordon D. Mors (American Independent) 2.1% Chris J. Rufer (Libertarian) 2% Tian Harter (Green) 1.9% |
| California 6 | Barbara Boxer | Democratic | 1982 | Retired to run for U.S. Senator. New member elected. Democratic hold. |
√ Lynn Woolsey (Democratic) 65.2% Bill Filante (Republican) 33.6% Write-ins 1.1% |
| California 7 | George Miller | Democratic | 1974 | Incumbent re-elected. | √ George Miller (Democratic) 70.3% Dave Scholl (Republican) 25.2% David L. Franklin (Peace and Freedom) 4.5% |
| California 8 | Nancy Pelosi Redistricted from the 5th district |
Democratic | 1987 | Incumbent re-elected. | √ Nancy Pelosi (Democratic) 82.5% Marc Wolin (Republican) 11% Cesar G. Cadabes (Peace and Freedom) 3.3% James R. Elwood (Libertarian) 3.2% |
| California 9 | Ron Dellums Redistricted from the 8th district |
Democratic | 1970 | Incumbent re-elected. | √ Ron Dellums (Democratic) 71.9% G. William "Billy" Hunter (Republican) 23.5% Dave Linn (Peace and Freedom) 4.6% |
| California 10 | None (District created) | New seat. New member elected. Republican gain. |
√ Bill Baker (Republican) 52% Wendell H. Williams (Democratic) 48% | ||
| California 11 | None (District created) | New seat. New member elected. Republican gain. |
√ Richard Pombo (Republican) 47.6% Patti Garamendi (Democratic) 45.6% Christine Roberts (Libertarian) 6.8% | ||
| California 12 | Tom Lantos Redistricted from the 11th district |
Democratic | 1980 | Incumbent re-elected. | √ Tom Lantos (Democratic) 68.8% Jim R. Tomlin (Republican) 23.3% Mary Weldon (Peace and Freedom) 4.4% George L. O'Brien (Libertarian) 3.4% |
| California 13 | Pete Stark Redistricted from the 9th district |
Democratic | 1972 | Incumbent re-elected. | √ Pete Stark (Democratic) 60.2% Verne W. Teyler (Republican) 31.6% Roslyn A. Allen (Peace and Freedom) 8.2% |
| California 14 | Tom Campbell Redistricted from the 12th district |
Republican | 1988 | Retired to run for U.S. Senator. New member elected. Democratic gain. |
√ Anna Eshoo (Democratic) 56.7% Tom Huening (Republican) 39% Chuck Olson (Libertarian) 2.8% David Wald (Peace and Freedom) 1.5% |
| California 15 | Norm Mineta Redistricted from the 13th district |
Democratic | 1974 | Incumbent re-elected. | √ Norm Mineta (Democratic) 63.5% Robert Wick (Republican) 31.2% Duggan Dieterly (Libertarian) 5% Write-in 0.2% |
| California 16 | Don Edwards Redistricted from the 10th district |
Democratic | 1972 | Incumbent re-elected. | √ Don Edwards (Democratic) 62% Ted Bundesen (Republican) 32% Amani S. Kuumba (Peace and Freedom) 6% |
| California 17 | Leon Panetta Redistricted from the 16th district |
Democratic | 1976 | Incumbent re-elected. | √ Leon Panetta (Democratic) 72.1% Bill McCampbell (Republican) 23.7% Maureen Smith (Peace and Freedom) 2.3% John D. Wilkes (Libertarian) 1.9% |
| California 18 | Gary Condit Redistricted from the 15th district |
Democratic | 1989 | Incumbent re-elected. | √ Gary Condit (Democratic) 84.7% Kim R. Almstrom (Libertarian) 15.3% |
| California 19 | Richard H. Lehman Redistricted from the 18th district |
Democratic | 1982 | Incumbent re-elected. | √ Richard H. Lehman (Democratic) 46.9% Tal L. Cloud (Republican) 46.4% Dorothy L. Wells (Peace and Freedom) 6.2% Write-in 0.5% |
| California 20 | Cal Dooley Redistricted from the 17th district |
Democratic | 1990 | Incumbent re-elected. | √ Cal Dooley (Democratic) 64.9% Ed Hunt (Republican) 35.1% |
| California 21 | Bill Thomas Redistricted from the 20th district |
Republican | 1978 | Incumbent re-elected. | √ Bill Thomas (Republican) 65.2% Deborah A. Vollmer (Democratic) 34.7% Write-ins 0.1% |
| California 22 | Bob Lagomarsino Redistricted from the 19th district |
Republican | 1974 | Incumbent lost renomination. New member elected. Republican hold. |
√ Michael Huffington (Republican) 52.5% Gloria Ochoa (Democratic) 34.9% Mindy Lorenz (Green) 9.5% William Howard Dilbeck (Libertarian) 3% |
| California 23 | Elton Gallegly Redistricted from the 21st district |
Republican | 1986 | Incumbent re-elected. | √ Elton Gallegly (Republican) 54.3% Anita Perez Ferguson (Democratic) 41.4% Jay C. Wood (Libertarian) 4.3% |
| California 24 | Anthony C. Beilenson Redistricted from the 23rd district |
Democratic | 1974 | Incumbent re-elected. | √ Anthony C. Beilenson (Democratic) 55.5% Tom McClintock (Republican) 39.1% John Paul Lindblad (Peace and Freedom) 5.4% |
| California 25 | None (District created) | New seat. New member elected. Republican gain. |
√ Howard McKeon (Republican) 51.9% James H. "Gil" Gilmartin (Democratic) 33% Rick Pamplin (Independent) 6.4% Peggy L. Christensen (Libertarian) 3.2% Charles Wilken (Green) 3.2% Nancy Lawrence (Peace and Freedom) 2.3% | ||
| California 26 | Howard Berman | Democratic | 1982 | Incumbent re-elected. | √ Howard Berman (Democratic) 61% Gary E. Forsch (Republican) 30.2% Margery Hinds (Peace and Freedom) 5.9% Bernard Zimring (Libertarian) 2.9% |
| California 27 | Carlos Moorhead Redistricted from the 22nd district |
Republican | 1972 | Incumbent re-elected. | √ Carlos Moorhead (Republican) 49.7% Doug Kahn (Democratic) 39.4% Jesse A. Moorman (Green) 5.2% Margaret L. Edwards (Peace and Freedom) 3.5% Dennis Decherd (Libertarian) 2.3% |
| California 28 | David Dreier Redistricted from the 33rd district |
Republican | 1980 | Incumbent re-elected. | √ David Dreier (Republican) 58.4% Al Wachtel (Democratic) 36.6% Walt Contreras Sheasby (Green) 3% Thomas J. Dominy (Libertarian) 2% |
| California 29 | Henry Waxman Redistricted from the 24th district |
Democratic | 1976 | Incumbent re-elected. | √ Henry Waxman (Democratic) 61.3% Mark Robbins (Republican) 25.7% David Davis (Independent) 5.9% Susan C. Davies (Peace and Freedom) 5.3% Felix Tsvi Rogin (Libertarian) 1.8% |
| California 30 | Edward R. Roybal Redistricted from the 25th district |
Democratic | 1962 | Incumbent retired. New member elected. Democratic hold. |
√ Xavier Becerra (Democratic) 58.4% Morry Waksberg (Republican) 24% Blase Bonpane (Green) 7.6% Elizabeth A. Nakano (Peace and Freedom) 7.4% Andrew "Drew" Consalvo (Libertarian) 2.7% |
| California 31 | Matthew G. Martinez Redistricted from the 30th district |
Democratic | 1982 | Incumbent re-elected. | √ Matthew G. Martinez (Democratic) 62.6% Reuben D. Franco (Republican) 37.4% |
| California 32 | Julian C. Dixon Redistricted from the 28th district |
Democratic | 1978 | Incumbent re-elected. | √ Julian C. Dixon (Democratic) 87.2% Robert G. "Bob" Weber Jr. (Libertarian) 7.2% William R. Williams (II) (Peace and Freedom) 5.7% |
| California 33 | None (District created) | New seat. New member elected. Democratic gain. |
√ Lucille Roybal-Allard (Democratic) 63% Robert Guzman (Republican) 30.4% Tim Delia (Peace and Freedom) 4.2% Dale S. Olvera (Libertarian) 2.4% | ||
| California 34 | Ed Torres | Democratic | 1982 | Incumbent re-elected. | √ Ed Torres (Democratic) 61.3% J. Jay Hernandez (Republican) 34% Carl M. "Marty" Swinney (Libertarian) 4.7% |
| California 35 | Maxine Waters Redistricted from the 29th district |
Democratic | 1990 | Incumbent re-elected. | √ Maxine Waters (Democratic) 82.5% Nate Truman (Republican) 14% Alice Mae Miles (Peace and Freedom) 2.2% Carin Rogers (Libertarian) 1.3% |
| California 36 | Mel Levine Redistricted from the 27th district |
Democratic | 1982 | Retired to run for U.S. Senator. New member elected. Democratic hold. |
√ Jane Harman (Democratic) 48.4% Joan Milke Flores (Republican) 42.2% Richard Greene (Green) 5.1% Marc F. Denny (Libertarian) 2.1% Owen Staley (Peace and Freedom) 2.1% |
| California 37 | Mervyn M. Dymally Redistricted from the 31st district |
Democratic | 1982 | Incumbent retired. New member elected. Democratic hold. |
√ Walter R. Tucker III (Democratic) 85.7% B. Kwaku Duren (Peace and Freedom) 14.3% |
| California 38 | Glenn M. Anderson Redistricted from the 32nd district |
Democratic | 1968 | Incumbent retired. New member elected. Republican gain. |
√ Steve Horn (Republican) 48.6% Evan Anderson Braude (Democratic) 43.4% Paul Burton (Peace and Freedom) 4.4% Blake Ashley (Libertarian) 3.6% |
| California 39 | William E. Dannemeyer | Republican | 1978 | Retired to run for U.S. Senator. New member elected. Republican hold. |
√ Ed Royce (Republican) 57.3% Molly McClanahan (Democratic) 38.5% Jack Dean (Libertarian) 4.4% |
| California 40 | Jerry Lewis Redistricted from the 35th district |
Republican | 1978 | Incumbent re-elected. | √ Jerry Lewis (Republican) 63.1% Donald M. "Don" Rusk (Democratic) 31.1% Margie Akin (Peace and Freedom) 5.8% |
| California 41 | None (District created) | New seat. New member elected. Republican gain. |
√ Jay Kim (Republican) 59.6% Bob Baker (Democratic) 34.4% James Michael "Mike" Noonan (Peace and Freedom) 5.9% | ||
| California 42 | George Brown, Jr. Redistricted from the 36th district |
Democratic | 1962/1972 | Incumbent re-elected. | √ George Brown, Jr. (Democratic) 50.7% Dick Rutan (Republican) 44% Fritz R. Ward (Libertarian) 5.4% |
| California 43 | None (District created) | New seat. New member elected. Republican gain. |
√ Ken Calvert (Republican) 46.7% Mark Takano (Democratic) 46.4% Gary R. Odom (American Independent) 3.2% Gene L. Berkman (Libertarian) 2.6% John Schwab (W/I) 1.1% | ||
| California 44 | Al McCandless Redistricted from the 37th district |
Republican | 1984 | Incumbent re-elected. | √ Al McCandless (Republican) 54.2% Georgia Smith (Democratic) 40.1% Phil Turner (Libertarian) 5.7% |
| California 45 | Dana Rohrabacher Redistricted from the 42nd district |
Republican | 1988 | Incumbent re-elected. | √ Dana Rohrabacher (Republican) 54.5% Patricia "Pat" McCabe (Democratic) 39% Gary David Copeland (Libertarian) 6.5% |
| California 46 | Bob Dornan Redistricted from the 38th district |
Republican | 1976/1984 | Incumbent re-elected. | √ Bob Dornan (Republican) 50.2% Robert John Banuelos (Democratic) 41% Richard G. Newhouse (Libertarian) 8.8% |
| California 47 | Christopher Cox Redistricted from the 40th district |
Republican | 1986 | Incumbent re-elected. | √ Christopher Cox (Republican) 64.9% John F. Anwiler (Democratic) 30.3% Maxine Bell Quirk (Peace and Freedom) 4.8% |
| California 48 | Ron Packard Redistricted from the 43rd district |
Republican | 1982 | Incumbent re-elected. | √ Ron Packard (Republican) 61.1% Michael P. "Mike" Farber (Democratic) 29.3% Donna White (Peace and Freedom) 5.8% Ted Lowe (Libertarian) 3.8% |
| California 49 | None (District created) | New seat. New member elected. Democratic gain. |
√ Lynn Schenk (Democratic) 51.1% Judy Jarvis (Republican) 42.7% John Wallner (Libertarian) 4.3% Milton Zaslow (Peace and Freedom) 1.9% | ||
| California 50 | None (District created) | New seat. New member elected. Democratic gain. |
√ Bob Filner (Democratic) 56.6% Tony Valencia (Republican) 28.9% Barbara Hutchinson (Libertarian) 11.3% Roger Bruce Batchelder (Peace and Freedom) 3.1% | ||
| California 51 | Duke Cunningham Redistricted from the 44th district |
Republican | 1990 | Incumbent re-elected. | √ Duke Cunningham (Republican) 56.1% Bea Herbert (Democratic) 33.7% Miriam E. Clark (Peace and Freedom) 4.1% Bill Holmes (Libertarian) 4.1% Richard Roe (Green) 2.1% |
| Bill Lowery Redistricted from the 41st district |
Republican | 1980 | |||
| California 52 | Duncan Hunter Redistricted from the 45th district |
Republican | 1980 | Incumbent re-elected. | √ Duncan Hunter (Republican) 52.9% Janet M. Gastil (Democratic) 41.2% Joseph B. Shea (Libertarian) 3.3% Dennis P. Gretsinger (Peace and Freedom) 2.7% |
Colorado
| District | Incumbent | Party | First elected |
Result | Candidates |
|---|---|---|---|---|---|
| Colorado 1 | Patricia Schroeder | Democratic | 1972 | Incumbent re-elected. | √ Patricia Schroeder (Democratic) 68.8% Raymond Diaz Aragon (Republican) 31.2% |
| Colorado 2 | David Skaggs | Democratic | 1986 | Incumbent re-elected. | √ David Skaggs (Democratic) 60.7% Bryan Day (Republican) 32.6% Vern Tharp (Independent) 6.7% |
| Colorado 3 | Ben Nighthorse Campbell | Democratic | 1986 | Retired to run for U.S. Senator. New member elected. Republican gain. |
√ Scott McInnis (Republican) 54.7% Mike Callihan (Democratic) 43.7% Ki R. Nelson (Pop) 1.6% |
| Colorado 4 | Wayne Allard | Republican | 1990 | Incumbent re-elected. | √ Wayne Allard (Republican) 57.8% Tom Redder (Democratic) 42.2% |
| Colorado 5 | Joel Hefley | Republican | 1986 | Incumbent re-elected. | √ Joel Hefley (Republican) 71.1% Charles Oriez (Democratic) 25.7% Keith Hamburger (Libertarian) 3.2% |
| Colorado 6 | Daniel Schaefer | Republican | 1983 | Incumbent re-elected. | √ Daniel Schaefer (Republican) 60.9% Tom Kolbe (Democratic) 39.1% |
Connecticut
| District | Incumbent | Party | First elected |
Result | Candidates |
|---|---|---|---|---|---|
| Connecticut 1 | Barbara B. Kennelly | Democratic | 1982 | Incumbent re-elected. | √ Barbara B. Kennelly (Democratic) 67.1% Philip Steele (Republican) 30.6% Gary Garneau (Concerned Citizens) 2.3% |
| Connecticut 2 | Sam Gejdenson | Democratic | 1980 | Incumbent re-elected. | √ Sam Gejdenson (Democratic) 50.8% Edward W. Munster (Republican) 49.2% |
| Connecticut 3 | Rosa DeLauro | Democratic | 1990 | Incumbent re-elected. | √ Rosa DeLauro (Democratic) 65.7% Tom Scott (Republican) 34.3% |
| Connecticut 4 | Chris Shays | Republican | 1987 | Incumbent re-elected. | √ Chris Shays (Republican) 67.3% Dave Schropfer (Democratic) 26.7% Al Smith (CT) 5.3% Ronald Fried (Natural Law) 0.7% |
| Connecticut 5 | Gary Franks | Republican | 1990 | Incumbent re-elected. | √ Gary Franks (Republican) 43.6% James Lawlor (Democratic) 31.1% Lynn H. Taborsak (CT) 22.5% Rosita Rodriguez (Concerned Citizens) 2.1% Bernard Nevas (Natural Law) 0.4% David LaPointe (Independent) 0.3% |
| Connecticut 6 | Nancy Johnson | Republican | 1982 | Incumbent re-elected. | √ Nancy Johnson (Republican) 69.7% Eugene Slason (Democratic) 25.2% Daniel Plawecki (Concerned Citizens) 4.0% Charles Pearl (Independent) 0.7% Ralph Economu (Independent) 0.4% |
Delaware
| District | Incumbent | Party | First elected |
Result | Candidates |
|---|---|---|---|---|---|
| Delaware at-large | Tom Carper | Democratic | 1982 | Retired to run for Governor. New member elected. Republican gain. |
√ Michael N. Castle (Republican) 55.4% Shien Biau Woo (Democratic) 42.5% Peggy Schmitt (Libertarian) 2.1% |
Florida
Four seats were added by reapportionment.
| District | Incumbent | Party | First elected |
Result | Candidates |
|---|---|---|---|---|---|
| Florida 1 | Earl Hutto | Democratic | 1978 | Incumbent re-elected. | √ Earl Hutto (Democratic) 52.0% Terry Ketchel (Republican) 43.9% Barbara Ann Rodgers-Hendricks (Green) 4.1% |
| Florida 2 | Pete Peterson | Democratic | 1990 | Incumbent re-elected. | √ Pete Peterson (Democratic) 73.4% Ray Wagner (Republican) 26.5% |
| Florida 3 | None (District created) | New seat. New member elected. Democratic gain. |
√ Corrine Brown (Democratic) 59.3% Don Weidner (Republican) 40.7% | ||
| Florida 4 | Craig James | Republican | 1988 | Incumbent retired. New member elected. Republican hold. |
√ Tillie Fowler (Republican) 56.7% Mattox Hair (Democratic) 43.2% |
| Charles Edward Bennett Redistricted from the 3rd district |
Democratic | 1948 | Incumbent retired. New member elected. Democratic loss. | ||
| Florida 5 | None (District created) | New seat. New member elected. Democratic gain. |
√ Karen Thurman (Democratic) 49.2% Tom Hogan (Republican) 43.4% Cindy Munkittrik (Independent) 7.4% | ||
| Florida 6 | Cliff Stearns | Republican | 1988 | Incumbent re-elected. | √ Cliff Stearns (Republican) 65.4% Phil Denton (Democratic) 34.6% |
| Florida 7 | None (District created) | New seat. New member elected. Republican gain. |
√ John Mica (Republican) 56.4% Dan Webster (Democratic) 43.5% | ||
| Florida 8 | Bill McCollum Redistricted from the 5th district |
Republican | 1980 | Incumbent re-elected. | √ Bill McCollum (Republican) 68.5% Chuck Kovaleski (Democratic) 31.5% |
| Florida 9 | Michael Bilirakis | Republican | 1982 | Incumbent re-elected. | √ Michael Bilirakis (Republican) 58.9% Cheryl Davis Knapp (Democratic) 41.1% |
| Florida 10 | Bill Young Redistricted from the 8th district |
Republican | 1970 | Incumbent re-elected. | √ Bill Young (Republican) 56.6% Karen Moffitt (Democratic) 43.4% |
| Florida 11 | Sam M. Gibbons Redistricted from the 7th district |
Democratic | 1962 | Incumbent re-elected. | √ Sam Gibbons (Democratic) 52.8% Mark Sharpe (Republican) 40.6% Joe De Minico (Independent) 6.7% |
| Florida 12 | Andy Ireland Redistricted from the 10th district |
Republican | 1976 | Incumbent retired. New member elected. Republican hold. |
√ Charles T. Canady (Republican) 52.1% Tom Mims (Democratic) 47.9% |
| Florida 13 | None (District created) | New seat. New member elected. Republican gain. |
√ Dan Miller (Republican) 57.8% Rand Snell (Democratic) 42.2% | ||
| Florida 14 | Porter Goss Redistricted from the 13th district |
Republican | 1988 | Incumbent re-elected. | √ Porter Goss (Republican) 82.1% James King (Independent) 17.9% |
| Florida 15 | Jim Bacchus Redistricted from the 11th district |
Democratic | 1990 | Incumbent re-elected. | √ Jim Bacchus (Democratic) 50.7% Bill Tolley (Republican) 49.3% |
| Florida 16 | Tom Lewis Redistricted from the 12th district |
Republican | 1982 | Incumbent re-elected. | √ Tom Lewis (Republican) 60.8% John Comerford (Democratic) 39.2% |
| Florida 17 | William Lehman | Democratic | 1972 | Incumbent retired. New member elected. Democratic hold. |
√ Carrie Meek (Democratic) unopposed |
| Florida 18 | Ileana Ros-Lehtinen | Republican | 1989 (Special) | Incumbent re-elected. | √ Ileana Ros-Lehtinen (Republican) 66.8% Magda Montiel Davis (Democratic) 33.2% |
| Florida 19 | Harry Johnston Redistricted from the 14th district |
Democratic | 1988 | Incumbent re-elected. | √ Harry Johnston (Democratic) 63.1% Larry Metz (Republican) 36.9% |
| Florida 20 | Dante Fascell Redistricted from the 19th district |
Democratic | 1954 | Incumbent retired. New member elected. Democratic hold. |
√ Peter Deutsch (Democratic) 55.1% Beverly Kennedy (Republican) 38.5% James Blackburn (Independent) 6.4% |
| Florida 21 | None (District created) | New seat. New member elected. Republican gain. |
√ Lincoln Diaz-Balart (Republican) unopposed | ||
| Florida 22 | Clay Shaw Redistricted from the 15th district |
Republican | 1980 | Incumbent re-elected. | √ Clay Shaw (Republican) 52.0% Gwen Margolis (Democratic) 37.1% Richard Stephens (Independent) 6.3% Michael Petrie (Independent) 2.6% Bernard Anscher (Independent) 2.1% |
| Lawrence J. Smith Redistricted from the 16th district |
Democratic | 1982 | Incumbent retired. Democratic loss. | ||
| Florida 23 | None (District created) | New seat. New member elected. Democratic gain. |
√ Alcee Hastings (Democratic) 58.5% Ed Fielding (Republican) 31.1% Al Woods (Independent) 10.3% | ||
Georgia
| District | Incumbent | Party | First elected |
Result | Candidates |
|---|---|---|---|---|---|
| Georgia 1 | Robert Lindsay Thomas | Democratic | 1982 | Incumbent retired. New member elected. Republican gain. |
√ Jack Kingston (Republican) 57.8% Barbara Christmas (Democratic) 42.2% |
| Georgia 2 | Charles Floyd Hatcher | Democratic | 1980 | Incumbent lost renomination. New member elected. Democratic hold. |
√ Sanford Bishop (Democratic) 63.7% John Clayton (Republican) 36.3% |
| Georgia 3 | Richard Ray | Democratic | 1982 | Incumbent lost re-election. New member elected. Republican gain. |
√ Mac Collins (Republican) 54.8% Richard Ray (Democratic) 45.2% |
| Georgia 4 | None (District created) | New seat. New member elected. Republican gain. |
√ John Linder (Republican) 50.5% Cathy Steinberg (Democratic) 49.5% | ||
| Georgia 5 | John Lewis | Democratic | 1986 | Incumbent re-elected. | √ John Lewis (Democratic) 72.1% Paul Stabler (Republican) 27.9% |
| Georgia 6 | Newt Gingrich | Republican | 1978 | Incumbent re-elected. | √ Newt Gingrich (Republican) 57.7% Tony Center (Democratic) 42.3% |
| Georgia 7 | George Darden | Democratic | 1983 | Incumbent re-elected. | √ George Darden (Democratic) 57.3% Al Beverly (Republican) 42.7% |
| Georgia 8 | J. Roy Rowland | Democratic | 1982 | Incumbent re-elected. | √ J. Roy Rowland (Democratic) 55.7% Bob Cunningham (Republican) 44.3% |
| Georgia 9 | Ed Jenkins | Democratic | 1976 | Incumbent retired. New member elected. Democratic hold. |
√ Nathan Deal (Democratic) 59.2% Daniel Becker (Republican) 40.8% |
| Georgia 10 | Doug Barnard, Jr. | Democratic | 1976 | Incumbent retired. New member elected. Democratic loss. | |
| Ben L. Jones | Democratic | 1988 Redistricted from the 4th district |
Incumbent lost renomination. New member elected. Democratic hold. |
Don Johnson (Democratic) 53.8% Ralph Hudgens (Republican) 46.2% | |
| Georgia 11 | None (District created) | New seat. New member elected. Democratic gain. |
√ Cynthia McKinney (Democratic) 73.1% Woodrow Lovett (Republican) 26.9% | ||
Hawaii
| District | Incumbent | Party | First elected |
Result | Candidates |
|---|---|---|---|---|---|
| Hawaii 1 | Neil Abercrombie | Democratic | 1990 | Incumbent re-elected. | √ Neil Abercrombie (Democratic) 72.9% Warner Sutton (Republican) 23.4% Rockne Hart Johnson (Libertarian) 3.7% |
| Hawaii 2 | Patsy Mink | Democratic | 1990 | Incumbent re-elected. | √ Patsy Mink (Democratic) 72.6% Kamuela Price (Republican) 22.1% Lloyd (Jeff) Mallan (Libertarian) 5.2% |
Idaho
| District | Incumbent | Party | First elected |
Result | Candidates |
|---|---|---|---|---|---|
| Idaho 1 | Larry LaRocco | Democratic | 1990 | Incumbent re-elected. | √ Larry LaRocco (Democratic) 58.1% Rachel Gilbert (Republican) 37.4% John Abel (Independent) 2.6% Henry Kinsey (Independent) 1.9% |
| Idaho 2 | Richard H. Stallings | Democratic | 1984 | Retired to run for U.S. Senator. New member elected. Republican gain. |
√ Mike Crapo (Republican) 60.8% J.D. Williams (Democratic) 35.4% Steven Kauer (Independent) 2.1% David William Mansfield (Independent) 1.7% |
Illinois
Illinois lost one seat due to reapportionment.
| District | Incumbent | Party | First elected |
Result | Candidates |
|---|---|---|---|---|---|
| Illinois 1 | Charles Hayes | Democratic | 1984 | Incumbent lost renomination. New member elected. Democratic hold. |
√ Bobby Rush (Democratic) 82.8% Jay Walker (Republican) 17.2% |
| Illinois 2 | Gus Savage | Democratic | 1980 | Incumbent lost renomination. New member elected. Democratic hold. |
√ Mel Reynolds (Democratic) 78.1% Ron Blackstone (Republican) 13.7% Louanner Peters (Louanner Peters Party) 8.2% |
| Illinois 3 | Bill Lipinski Redistricted from the 5th district |
Democratic | 1982 | Incumbent re-elected. | Bill Lipinski (Democratic) 63.5% Harry C. Lepinske (Republican) 36.5% |
| Marty Russo | Democratic | 1974 | Redistricting contest Democratic loss. | ||
| Illinois 4 | None (District created) | New seat. New member elected. Democratic gain. |
√ Luis Gutiérrez (Democratic) 77.6% Hildegarde Rodriguez-Schieman (Republican) 22.4% | ||
| Illinois 5 | Dan Rostenkowski Redistricted from the 8th district |
Democratic | 1958 | Incumbent re-elected. | Dan Rostenkowski (Democratic) 57.3% Elias R. Zenkich (Republican) 39.1% Blaise C. Grenke (Libertarian) 3.6% |
| Frank Annunzio Redistricted from the 11th district |
Democratic | 1964 | Incumbent retired. New member elected. Democratic loss. | ||
| Illinois 6 | Henry Hyde | Republican | 1974 | Incumbent re-elected. | √ Henry Hyde (Republican) 65.5% Barry W. Watkins (Democratic) 34.5% |
| Illinois 7 | Cardiss Collins | Democratic | 1973 | Incumbent re-elected. | √ Cardiss Collins (Democratic) 81.1% Norman G. Boccio (Republican) 15.7% Rose-Marie Love (Economic Recovery) 2.1% Geri Knoll McLauchlan (Natural Law) 1.1% |
| Illinois 8 | Philip M. Crane Redistricted from the 12th district |
Republican | 1969 | Incumbent re-elected. | √ Philip M. Crane (Republican) 55.7% Sheila A. Smith (Democratic) 40.4% Joe M. Dillier (Independent) 3.9% |
| Illinois 9 | Sidney Yates | Democratic | 1948/1964 | Incumbent re-elected. | √ Sidney Yates (Democratic) 68.0% Herb Sohn (Republican) 27.0% Sheila A. Jones (Economic Recovery) 5.0% |
| Illinois 10 | John Edward Porter | Republican | 1980 | Incumbent re-elected. | √ John Edward Porter (Republican) 64.5% Michael J. Kennedy (Democratic) 35.5% |
| Illinois 11 | George E. Sangmeister Redistricted from the 4th district |
Democratic | 1988 | Incumbent re-elected. | √ George E. Sangmeister (Democratic) 55.7% Robert T. Herbolsheimer (Republican) 44.3% |
| Illinois 12 | Jerry F. Costello Redistricted from the 21st district |
Democratic | 1988 | Incumbent re-elected. | √ Jerry F. Costello (Democratic) 71.2% Mike Starr (Republican) 28.8% |
| Illinois 13 | Harris W. Fawell |
Republican | 1984 | Incumbent re-elected. | √ Harris W. Fawell (Republican) 68.4% Dennis Michael Temple (Democratic) 31.6% |
| Illinois 14 | J. Dennis Hastert |
Republican | 1986 | Incumbent re-elected. | √ J. Dennis Hastert (Republican) 67.3% Jonathan Abram Reich (Democratic) 32.6% |
| Illinois 15 | Thomas W. Ewing |
Republican | 1991 | Incumbent re-elected. | √ Thomas W. Ewing (Republican) 59.3% Charles D. Mattis (Democratic) 40.6% |
| Illinois 16 | John W. Cox, Jr. |
Democratic | 1986 | Incumbent lost re-election. New member elected. Republican gain. |
√ Donald A. Manzullo (Republican) 55.6% John W. Cox, Jr. (Democratic) 44.4% |
| Illinois 17 | Lane Evans |
Democratic | 1982 | Incumbent re-elected. | √ Lane Evans (Democratic) 60.1% Ken Schloemer (Democratic) 39.9% |
| Illinois 18 | Robert H. Michel |
Republican | 1956 | Incumbent re-elected. | √ Robert H. Michel (Republican) 57.8% Ronald C. Hawkins (Democratic) 42.2% |
| Illinois 19 | Glenn Poshard Redistricted from the 22nd district |
Democratic | 1988 | Incumbent re-elected. | Glenn Poshard (Democratic) 69.1% Douglas E. Lee (Republican) 30.9% |
| Terry L. Bruce | Democratic | 1984 | Redistricting contest Democratic loss. | ||
| Illinois 20 | Richard J. Durbin |
Democratic | 1982 | Incumbent re-elected. | √ Richard J. Durbin (Democratic) 56.5% John M. Shimkus (Republican) 43.5% |
Indiana
| District | Incumbent | Party | First elected |
Result | Candidates |
|---|---|---|---|---|---|
| Indiana 1 | Pete Visclosky | Democratic | 1984 | Incumbent re-elected. | √ Pete Visclosky (Democratic) 69.4% David J. Vucich (Republican) 30.6% |
| Indiana 2 | Philip R. Sharp | Democratic | 1974 | Incumbent re-elected. | √ Philip R. Sharp (Democratic) 57.1% William G. Frazier (Republican) 39.5% Theodore "Ted" Shaver (Independent) 3.4% |
| Indiana 3 | Tim Roemer | Democratic | 1990 | Incumbent re-elected. | √ Tim Roemer (Democratic) 57.4% Carl H. Baxmeyer (Republican) 42.6% |
| Indiana 4 | Jill L. Long | Democratic | 1988 | Incumbent re-elected. | √ Jill L. Long (Democratic) 62.1% Charles W. "Chuck" Pierson (Republican) 37.9% |
| Indiana 5 | Jim Jontz | Democratic | 1986 | Incumbent lost re-election. New member elected. Republican gain. |
√ Steve Buyer (Republican) 51.0% Jim Jontz (Democratic) 49.0% |
| Indiana 6 | Dan Burton | Republican | 1982 | Incumbent re-elected. | √ Dan Burton (Republican) 72.2% Natalie M. Bruner (Democratic) 27.8% |
| Indiana 7 | John T. Myers | Republican | 1966 | Incumbent re-elected. | √ John T. Myers (Republican) 59.5% Ellen E. Wedum (Democratic) 40.5% |
| Indiana 8 | Frank McCloskey | Democratic | 1982 | Incumbent re-elected. | √ Frank McCloskey (Democratic) 52.5% Richard Mourdock (Republican) 45.3% John W. Taylor (Independent) 1.3% Jimmy Gale Funkhouser, Jr. (Libertarian) 0.8% |
| Indiana 9 | Lee H. Hamilton | Democratic | 1964 | Incumbent re-elected. | √ Lee H. Hamilton (Democratic) 69.7% Michael E. Bailey (Republican) 30.3% |
| Indiana 10 | Andrew Jacobs, Jr. | Democratic | 1964/1974 | Incumbent re-elected. | √ Andrew Jacobs, Jr. (Democratic) 64.0% Janos Horvath (Republican) 35.0% Carolyn P. Sackett (NA) 1.0% |
Iowa
One seat was lost due to reapportionment.
| District | Incumbent | Party | First elected |
Result | Candidates |
|---|---|---|---|---|---|
| Iowa 1 | Jim Leach | Republican | 1976 | Incumbent re-elected. | √ Jim Leach (Republican) 68.1% Jan J. Zonneveld (Democratic) 31.2% |
| Iowa 2 | Jim Nussle | Republican | 1990 | Incumbent re-elected. | Jim Nussle (Republican) 50.2% David R. Nagle (Democratic) 49.1% Albert W. Schoeman (Grass Roots) 0.7% |
| David R. Nagle Redistricted from the 3rd district |
Democratic | 1986 | Redistricting contest Democratic loss. | ||
| Iowa 3 | Jim Ross Lightfoot | Republican | 1984 | Incumbent re-elected. | √ Jim Ross Lightfoot (Republican) 48.9% Elaine Baxter (Democratic) 47.1% Larry Chroman (Natural Law) 4.0% |
| Iowa 4 | Neal Smith | Democratic | 1958 | Incumbent re-elected. | √ Neal Smith (Democratic) 61.6% Paul Lunde (Republican) 36.5% Jerry Yellin (Natural Law) 0.9% William C. Oviatt (Grass Roots) 0.9% |
| Iowa 5 | Fred Grandy Redistricted from the 6th district |
Republican | 1986 | Incumbent re-elected. | √ Fred Grandy (Republican) 99.3% |
Kansas
One seat was lost due to reapportionment.
| District | Incumbent | Party | First elected |
Result | Candidates |
|---|---|---|---|---|---|
| Kansas 1 | Pat Roberts | Republican | 1980 | Incumbent re-elected. | √ Pat Roberts (Republican) 68.3% Duane West (Democratic) 29.3% Steven A. Rosile (Libertarian) 2.4% |
| Kansas 2 | Jim Slattery | Democratic | 1982 | Incumbent re-elected. | √ Jim Slattery (Democratic) 56.2% Jim Van Slyke (Republican) 40.8% Arthur L. Clack (Libertarian) 3.0% |
| Kansas 3 | Jan Meyers | Republican | 1984 | Incumbent re-elected. | √ Jan Meyers (Republican) 58.0% Tom Love (Democratic) 37.6% Frank Kaul (Libertarian) 4.4% |
| Kansas 4 | Dan Glickman | Democratic | 1976 | Incumbent re-elected. | √ Dan Glickman (Democratic) 51.7% Eric R. Yost (Republican) 42.1% Seth L. Warren (Libertarian) 6.2% |
| Dick Nichols Redistricted from the 5th district |
Republican | 1990 | Incumbent lost renomination. New member elected. Republican loss. |
Kentucky
| District | Incumbent | Party | First elected |
Result | Candidates |
|---|---|---|---|---|---|
| Kentucky 1 | Carroll Hubbard | Democratic | 1974 | Incumbent lost renomination. New member elected. Democratic hold. |
√ Thomas Barlow (Democratic) 60.5% Steve Hamrick (Republican) 39.1% Marvin Seat (Ref) 0.4% |
| Kentucky 2 | William Huston Natcher | Democratic | 1953 | Incumbent re-elected. | √ William Huston Natcher (Democratic) 61.4% Bruce Bartley (Republican) 38.6% |
| Kentucky 3 | Romano L. Mazzoli | Democratic | 1970 | Incumbent re-elected. | √ Romano L. Mazzoli (Democratic) 52.7% Susan Stokes (Republican) 47.3% |
| Kentucky 4 | Jim Bunning | Republican | 1986 | Incumbent re-elected. | √ Jim Bunning (Republican) 61.6% Sally Harris Skaggs (Democratic) 38.4% |
| Kentucky 5 | Hal Rogers | Republican | 1980 | Incumbent re-elected. | √ Hal Rogers (Republican) 54.6% John Doug Hays (Democratic) 45.4% |
| Carl C. Perkins Redistricted from the 7th district |
Democratic | 1984 | Incumbent retired. New member elected. Democratic loss. | ||
| Kentucky 6 | Larry Hopkins | Republican | 1978 | Incumbent retired. New member elected. Democratic gain. |
√ Scotty Baesler (Democratic) 60.7% Charles Ellinger (Republican) 39.3% |
Louisiana
One seat lost to reapportionment. Four Incumbents were squeezed into two districts and one new district was created.
| District | Incumbent | Party | First elected |
Result | Candidates (and run-off results) |
|---|---|---|---|---|---|
| Louisiana 1 | Bob Livingston | Republican | 1977 | Incumbent re-elected. | √ Bob Livingston (Republican) 72.7% Anne Thompson (Republican) 10.1% Vincent Bruno (Republican) 6.8% Richie Martin (Republican) 4.2% Jules Hillery (Independent) 3.9% Greg Reinhard (Independent) 2.3% |
| Louisiana 2 | William J. Jefferson | Democratic | 1990 | Incumbent re-elected. | √ William J. Jefferson (Democratic) 73.4% Wilma Knox Irvin (Democratic) 15.5% Roger C. Johnson (Independent) 11.1% |
| Louisiana 3 | Billy Tauzin | Democratic | 1980 | Incumbent re-elected. | √ Billy Tauzin (Democratic) 81.7% Paul Boynton (Republican) 18.3% |
| Louisiana 4 | None (District created) | New seat. New member elected. Democratic gain. |
√ Cleo Fields (Democratic) 47.8% (73.9%) Charles Jones (Democratic) 14.0% (26.1%) Joe Shyne (Democratic) 10.8% Faye Williams (Democratic) 8.6% Steve Myers (Republican) 7.8% Emile Ventre (Republican) 6.9% James Ross (Democratic) 2.1% Ralph Hall (Democratic) 2.0% | ||
| Louisiana 5 | Jim McCrery Redistricted from the 4th district |
Republican | 1988 | Incumbent re-elected. | √ Jim McCrery (Republican) 44.1% (63.0%) Jerry Huckaby (Democratic) 29.4% (37.0%) Robert Thompson (Democratic) 22.4% Nota Knox (Independent) 2.1% Donal Milton (Republican) 1.9% |
| Jerry Huckaby | Democratic | 1976 | Redistricting contest Democratic loss. | ||
| Louisiana 6 | Richard Baker | Republican | 1986 | Incumbent re-elected. | √ Richard Baker (Republican) 33.1% (50.6%) Clyde Holloway (Republican) 36.7% (49.4%) Ned Randolph (Democratic) 30.2% |
| Clyde C. Holloway Redistricted from the 8th district |
Republican | 1986 | Redistricting contest Republican loss. | ||
| Louisiana 7 | Jimmy Hayes | Democratic | 1986 | Incumbent re-elected. | √ Jimmy Hayes (Democratic) 73.0% Fredric Hayes (Republican) 20.7% Bob Nain (Republican) 6.2% |
Maine
| District | Incumbent | Party | First elected |
Result | Candidates |
|---|---|---|---|---|---|
| Maine 1 | Thomas Andrews | Democratic | 1990 | Incumbent re-elected. | √ Thomas Andrews (Democratic) 65.0% Linda Bean (Republican) 35.0% |
| Maine 2 | Olympia Snowe | Republican | 1978 | Incumbent re-elected. | √ Olympia Snowe (Republican) 49.1% Patrick McGowan (Democratic) 42.0% Jonathan Carter (Green) 8.8% |
Maryland
| District | Incumbent | Party | First elected |
Result | Candidates |
|---|---|---|---|---|---|
| Maryland 1 | Thomas McMillen Redistricted from the 4th district |
Democratic | 1986 | Redistricting contest Democratic loss. |
√ Wayne Gilchrest (Republican) 51.6% Thomas McMillen (Democratic) 48.4% |
| Wayne Gilchrest | Republican | 1990 | Incumbent re-elected. | ||
| Maryland 2 | Helen Delich Bentley | Republican | 1984 | Incumbent re-elected. | √ Helen Delich Bentley (Republican) 65.1% Michael Hickey Jr. (Democratic) 34.9% |
| Maryland 3 | Ben Cardin | Democratic | 1986 | Incumbent re-elected. | √ Ben Cardin (Democratic) 73.5% William Bricker (Republican) 26.5% |
| Maryland 4 | None (District created) | New seat. New member elected. Democratic gain. |
√ Albert Wynn (Democratic) 75.2% Michele Dyson (Republican) 24.8% | ||
| Maryland 5 | Steny Hoyer | Democratic | 1981 | Incumbent re-elected. | √ Steny Hoyer (Democratic) 53.0% Lawrence Hogan Jr. (Republican) 43.9% William Johntson (Independent) 3.1% |
| Maryland 6 | Beverly Byron | Democratic | 1978 | Incumbent lost renomination. New member elected. Republican gain. |
√ Roscoe Bartlett (Republican) 54.2% Thomas Hattery (Democratic) 45.8% |
| Maryland 7 | Kweisi Mfume | Democratic | 1986 | Incumbent re-elected. | √ Kweisi Mfume (Democratic) 85.3% Kenneth Kondner (Republican) 14.7% |
| Maryland 8 | Connie Morella | Republican | 1986 | Incumbent re-elected. | √ Connie Morella (Republican) 72.5% Edward Heffernan (Democratic) 27.5% |
Massachusetts
Massachusetts lost one seat due to reapportionment.
| District | Incumbent | Party | First elected |
Result | Candidates |
|---|---|---|---|---|---|
| Massachusetts 1 | John Olver | Democratic | June 18, 1991 (Special) |
Incumbent re-elected. | √ John Olver (Democratic) 51.5% Patrick Larkin (Republican) 43.4% Louis R. Godena (Peace, Jobs, Justice) 2.7% Dennis M. Kelly (Pro-Democracy Reform) 1.7% Jeffrey W. Rebello (FFL) 0.6% |
| Massachusetts 2 | Richard Neal | Democratic | 1988 | Incumbent re-elected. | √ Richard Neal (Democratic) 53.1% Anthony W. Ravosa (Republican) 31.1% Thomas R. Sheehan (For the People) 15.8% |
| Massachusetts 3 | Joseph D. Early | Democratic | 1974 | Incumbent lost re-election. New member elected. Republican gain. |
√ Peter Blute (Republican) 50.4% Joseph D. Early (Democratic) 44.3% Leonard J. Umina (Independent Voters) 3.7% Michael T. Moore (Natural Law) 1.6% |
| Massachusetts 4 | Barney Frank | Democratic | 1980 | Incumbent re-elected. | √ Barney Frank (Democratic) 67.7% Edward J. McCormick, III (Republican) 26.2% Luke Lumina (Independent Voters) 5.1% Dennis J. Ingalls (FFL) 1.0% |
| Massachusetts 5 | Chester G. Atkins | Democratic | 1984 | Incumbent lost renomination. New member elected. Democratic hold. |
√ Marty Meehan (Democratic) 52.17% Paul W. Cronin (Republican) 37.5% Mary Farinelli (Independent) 7.44% David E. Coleman (Independent) 2.81% Write-In 0.09% |
| Massachusetts 6 | Nicholas Mavroules | Democratic | 1978 | Incumbent lost re-election. New member elected. Republican gain. |
√ Peter G. Torkildsen (Republican) 54.8% Nicholas Mavroules (Democratic) 44.9% |
| Massachusetts 7 | Ed Markey | Democratic | 1976 | Incumbent re-elected. | √ Ed Markey (Democratic) 62.1% Stephen A. Sohn (Republican) 27.8% Robert B. Antonelli (Independent) 10.1% |
| Massachusetts 8 | Joe Kennedy | Democratic | 1986 | Incumbent re-elected. | √ Joe Kennedy (Democratic) 83.1% Alice Harriett Nakash (Independent) 16.8% |
| Massachusetts 9 | Joe Moakley | Democratic | 1972 | Incumbent re-elected. | Joe Moakley (Democratic) 69.2% Martin D. Conboy (Republican) 21.4% Lawrence C. Mackin (Independent) 6.2% Robert W. Horan (Independent) 3.2% |
| Brian J. Donnelly Redistricted from the 11th district |
Democratic | 1978 | Incumbent retired. New member elected. Democratic loss. | ||
| Massachusetts 10 | Gerry Studds | Democratic | 1972 | Incumbent re-elected. | √ Gerry Studds (Democratic) 60.8% Daniel W. Daly (Republican) 24.4% Jon L. Bryan (Independent) 12.6% Michael P. Umina (Independent Voters) 1.9% Robert W. Knapp (FFL) 0.4% |
Michigan
Michigan lost two seats to reapportionment.
| District | Incumbent | Party | Elected | Status | Opponent |
|---|---|---|---|---|---|
| Michigan 1 | Robert William Davis Redistricted from the 11th district |
Republican | 1978 | Incumbent retired. New member elected. Democratic gain. |
√ Bart Stupak (Democratic) 53.9% Philip E. Ruppe (Republican) 43.6% Gerald Aylott (Libertarian) 1.5% Lyman Clark (Natural Law) 1.0% |
| Michigan 2 | Guy Vander Jagt Redistricted from the 9th district |
Republican | 1966 | Incumbent lost renomination. New member elected. Republican hold. |
√ Peter Hoekstra (Republican) 63.0% John H. Miltner (Democratic) 35.0% Dick Jacobs (Libertarian) 2.0% |
| Michigan 3 | Paul B. Henry Redistricted from the 5th district |
Republican | 1984 | Incumbent re-elected. | √ Paul B. Henry (Republican) 61.3% Carol S. Kooistra (Democratic) 38.2% Richard Whitelock (Libertarian) 1.2% Susan Normandin (Natural Law) 1.2% |
| Michigan 4 | David Lee Camp Redistricted from the 10th district |
Republican | 1990 | Incumbent re-elected. | √ David Lee Camp (Republican) 62.5% Lisa A. Donaldson (Democratic) 34.8% Joan Dennison (TIC) 1.3% Gary R. Bradley (Libertarian) 0.8% Thomas E. List (Natural Law) 0.5% |
| Michigan 5 | J. Bob Traxler Redistricted from the 8th district |
Democratic | 1974 | Incumbent retired. New member elected. Democratic hold. |
√ James A. Barcia (Democratic) 60.3% Keith Muxlow (Republican) 38.0% Lloyd Clarke (Workers World) 1.7% |
| Michigan 6 | Fred Upton Redistricted from the 4th district |
Republican | 1986 | Incumbent re-elected. | √ Fred Upton (Republican) 61.8% Andy Davis (Democratic) 38.2% |
| Michigan 7 | Carl Pursell Redistricted from the 2nd district |
Republican | 1976 | Incumbent retired. New member elected. Republican hold. |
√ Nick Smith (Republican) 87.6% Kenneth L. Proctor (Libertarian) 12.3% |
| Michigan 8 | Bob Carr Redistricted from the 6th district |
Democratic | 1982 | Incumbent re-elected. | √ Bob Carr (Democratic) 47.6% Dick Chrysler (Republican) 46.3% Frank D. McAlpine (NPA) 4.3% Michael E. Marotta (Libertarian) 1.8% |
| Howard Wolpe Redistricted from the 3rd district |
Democratic | 1978 | Incumbent retired. New member elected. Democratic loss. | ||
| Michigan 9 | Dale E. Kildee Redistricted from the 7th district |
Democratic | 1976 | Incumbent re-elected. | √ Dale E. Kildee (Democratic) 53.7% Megan O'Neill (Republican) 44.8% Key Halverson (Natural Law) 0.8% Jerome White (WL) 0.8% |
| Michigan 10 | David E. Bonior Redistricted from the 12th district |
Democratic | 1976 | Incumbent re-elected. | √ David E. Bonior (Democratic) 53.1% Douglas Carl (Republican) 44.2% David A. Weidner (Libertarian) 2.7% |
| Michigan 11 | William Broomfield Redistricted from the 18th district |
Republican | 1956 | Incumbent retired. New member elected. Republican hold. |
√ Joe Knollenberg (Republican) 57.6% Walter Briggs (Democratic) 40.2% Brian Richard Wright (Libertarian) 1.4% Henry Ogden Clark (Natural Law) 0.8% |
| Michigan 12 | Sander M. Levin Redistricted from the 17th district |
Democratic | 1982 | Incumbent re-elected. | Sander M. Levin (Democratic) 52.6% John Pappageorge (Republican) 45.7% Charles Hahn (Libertarian) 1.1% R.W. Montgomery (Natural Law) 0.8% |
| Dennis M. Hertel Redistricted from the 14th district |
Democratic | 1980 | Incumbent retired. New member elected. Democratic loss. | ||
| Michigan 13 | William D. Ford Redistricted from the 15th district |
Democratic | 1964 | Incumbent re-elected. | √ William D. Ford (Democratic) 51.9% R. Robert Geake (Republican) 42.8% Randall F. Roe (NPA) 3.5% Paul Steven Jensen (TIC) 1.3% Larry Roberts (WL) 0.5% |
| Michigan 14 | John Conyers Redistricted from the 1st district |
Democratic | 1964 | Incumbent re-elected. | √ John Conyers (Democratic) 82.4% John W. Gordon (Republican) 15.9% Richard R. Miller (Natural Law) 1.0% Dartagnan Collier (WL) 0.6% |
| Michigan 15 | Barbara-Rose Collins Redistricted from the 13th district |
Democratic | 1990 | Incumbent re-elected. | √ Barbara-Rose Collins (Democratic) 80.5% Charles C. Vincent (Republican) 17.2% James E. Harris, Jr. (NPA) 1.5% Jane Walker Meade (Libertarian) 0.8% |
| Michigan 16 | John Dingell | Democratic | 1955 | Incumbent re-elected. | √ John Dingell (Democratic) 65.1% Frank Beaumont (Republican) 31.4% Max J. Siegel (TIC) 1.7% Jeff Hampton (Libertarian) 1.0% Martin P. McLaughlin (WL) 0.8% |
Minnesota
| District | Incumbent | Party | Elected | Status | Opponent |
|---|---|---|---|---|---|
| Minnesota 1 | Tim Penny | Democratic | 1982 | Incumbent re-elected. | √ Tim Penny (Democratic) 73.9% Tim Droogsma (Republican) 25.9% |
| Minnesota 2 | Vin Weber | Republican | 1980 | Incumbent retired. New member elected. Democratic gain. |
√ David Minge (Democratic) 47.9% Cal Ludeman (Republican) 47.4% Stan Bentz (Independent) 4.4% |
| Minnesota 3 | Jim Ramstad | Republican | 1990 | Incumbent re-elected. | √ Jim Ramstad (Republican) 63.8% Paul Mandell (Democratic) 33.3% Dwight Fellman (GR) 2.9% |
| Minnesota 4 | Bruce Vento | Democratic | 1976 | Incumbent re-elected. | √ Bruce Vento (Democratic) 57.6% Ian Maitland (Republican) 37.6% James Willess (Independent) 2.4% Dan Vacek (GR) 1.6% Lynn Marvin Johnson (Natural Law) 1.3% Jo Rothenberg (SW) 0.4% |
| Minnesota 5 | Martin Olav Sabo | Democratic | 1978 | Incumbent re-elected. | √ Martin Olav Sabo (Democratic) 63.0% Stephen A. Moriarty(Republican) 27.9% Russell Bentley (GR) 2.5% Sandra Coleman (NA) 2.1% Mary Mellen (Natural Law) 2.0% Glenn Mesaros (Independent) 1.7% Jo Rothenberg (SW) 0.7% |
| Minnesota 6 | Gerry Sikorski | Democratic | 1982 | Incumbent lost re-election. New member elected. Republican gain. |
√ Rod Grams (Republican) 44.4% Gerry Sikorski (Democratic) 33.2% Dean Barkley (Independent) 16.1% James H. Peterson (IFP) 5.5% Tom Firnstahl (Natural Law) 0.8% |
| Minnesota 7 | Collin Peterson | Democratic | 1990 | Incumbent re-elected. | √ Collin Peterson (Democratic) 50.4% Bernie Omann (Republican) 49.1% |
| Minnesota 8 | Jim Oberstar | Democratic | 1974 | Incumbent re-elected. | √ Jim Oberstar (Democratic) 59.0% Phil Herwig (Republican) 29.6% Harry Robb Weltry (PC) 8.0% Floyd Henspeter (TLC) 3.0% |
Mississippi
| District | Incumbent | Party | Elected | Status | Opponent |
|---|---|---|---|---|---|
| Mississippi 1 | Jamie L. Whitten | Democratic | 1941 | Incumbent re-elected. | √ Jamie L. Whitten (Democratic) 59.5% Clyde E. Whitaker (Republican) 40.5% |
| Mississippi 2 | Mike Espy | Democratic | 1986 | Incumbent re-elected. | √ Mike Espy (Democratic) 76.4% Dorothy Benford (Republican) 23.6% |
| Mississippi 3 | Sonny Montgomery | Democratic | 1966 | Incumbent re-elected. | √ Sonny Montgomery (Democratic) 81.2% Michael E. Williams (Republican) 18.8% |
| Mississippi 4 | Michael Parker | Democratic | 1988 | Incumbent re-elected. | √ Michael Parker (Democratic) 67.0% Jack L. McMillan (Republican) 22.4% Liz Gilchrist (Independent) 5.4% James H. Meredith (Independent) 4.8% |
| Mississippi 5 | Gene Taylor | Democratic | 1989 | Incumbent re-elected. | √ Gene Taylor (Democratic) 67.0% Paul Harvey (Republican) 35.4% Shawn O'Hara (Independent) 1.4% |
Missouri
| District | Incumbent | Party | First Elected | Result | Candidates |
|---|---|---|---|---|---|
| Missouri 1 | Bill Clay | Democratic | 1968 | Incumbent re-elected. | √ Bill Clay (Democratic) 68.1% Arthur S. Montgomery (Republican) 31.9% |
| Missouri 2 | Joan Kelly Horn | Democratic | 1990 | Incumbent lost re-election. New member elected. Republican gain. |
√ Jim Talent (Republican) 50.4% Joan Kelly Horn (Democratic) 47.6% Jim Higgins (Libertarian) 2.0% |
| Missouri 3 | Dick Gephardt | Democratic | 1976 | Incumbent re-elected. | √ Dick Gephardt (Democratic) 64.1% Mack Holekamp (Republican) 33.1% Robert Stockhausen (Libertarian) 2.8% |
| Missouri 4 | Ike Skelton | Democratic | 1976 | Incumbent re-elected. | √ Ike Skelton (Democratic) 70.3% John Carley (Republican) 29.6% |
| Missouri 5 | Alan Wheat | Democratic | 1982 | Incumbent re-elected. | √ Alan Wheat (Democratic) 59.1% Edward (Gomer) Moody(Republican) 36.6% Tom Danaher (Nat. Law) 2.4% Grant Stauffer (Libertarian) 1.8% |
| Missouri 6 | Earl Thomas Coleman | Republican | 1976 | Incumbent lost re-election. New member elected. Democratic gain. |
√ Pat Danner (Democratic) 55.4% Tom Coleman (Republican) 44.6% |
| Missouri 7 | Mel Hancock | Republican | 1988 | Incumbent re-elected. | √ Mel Hancock (Republican) 61.6% Pat Deaton (Democratic) 38.4% |
| Missouri 8 | Bill Emerson | Republican | 1982 | Incumbent re-elected. | √ Bill Emerson (Republican) 62.9% Thad Bullock (Democratic) 37.1% |
| Missouri 9 | Harold Volkmer | Democratic | 1976 | Incumbent re-elected. | √ Harold Volkmer (Democratic) 47.7% Rick Hardy (Republican) 45.4% Jeff Barrow (Green) 4% Duane Neil Burghard 2.8% (Independent) |
Montana
One seat was lost in reapportionment.
| District | Incumbent | Party | First elected |
Result | Candidates |
|---|---|---|---|---|---|
| Montana at-large | Pat Williams Redistricted from the 1st district |
Democratic | 1978 | Democrat elected Republican loss. |
√ Pat Williams (Democratic) 50.4% Ron Marlenee (Republican) 47.0% Jerome Wilverding (Libertarian) 2.6% |
| Ron Marlenee Redistricted from the 2nd district |
Republican | 1976 |
Nebraska
| District | Incumbent | Party | First Elected | Result | Candidates |
|---|---|---|---|---|---|
| Nebraska 1 | Doug Bereuter | Republican | 1978 | Incumbent re-elected. | √ Doug Bereuter (Republican) 59.7% Gerry Finnegan (Democratic) 40.3% |
| Nebraska 2 | Peter Hoagland | Democratic | 1988 | Incumbent re-elected. | √ Peter Hoagland (Democratic) 51.2% Ronald L. Staskiewicz (Republican) 48.8% |
| Nebraska 3 | Bill Barrett | Republican | 1990 | Incumbent re-elected. | √ Bill Barrett (Republican) 71.7% Lowell Fisher (Democratic) 28.3% |
Nevada
| District | Incumbent | Party | First Elected | Result | Candidates |
|---|---|---|---|---|---|
| Nevada 1 | James Bilbray | Democratic | 1986 | Incumbent re-elected. | √ James Bilbray (Democratic) 57.9% Coy Pettyjohn (Republican) 38% Scott A. Kjar (Libertarian) 4% |
| Nevada 2 | Barbara Vucanovich | Republican | 1982 | Incumbent re-elected. | √ Barbara Vucanovich (Republican) 47.9% Pete Sferrazza (Democratic) 43.3% Daniel M. Hansen (Amer. Indep.) 4.9% Dan Becan (Libertarian) 2.8% Don Golden (Pop.) 1% |
New Hampshire
| District | Incumbent | Party | First Elected | Result | Candidates |
|---|---|---|---|---|---|
| New Hampshire 1 | Bill Zeliff | Republican | 1990 | Incumbent re-elected. | √ Bill Zeliff (Republican) 53.2% Bob Preston (Democratic) 42.5% Knox Bickford (Libertarian) 2.2% Richard P. Bosa (Independent) 1.4% |
| New Hampshire 2 | Richard Swett | Democratic | 1990 | Incumbent re-elected. | √ Richard Swett (Democratic) 61.7% Bill Hatch (Republican) 35.7% John A. Lewicke (Libertarian) 2.3% James J. Bingham (Nat. Law) 0.3% |
New Jersey
| District | Incumbent | Party | First Elected | Result | Candidates |
|---|---|---|---|---|---|
| New Jersey 1 | Robert E. Andrews | Democratic | 1990 | Incumbent re-elected. | √ Robert E. Andrews (Democratic) 67.3% Lee A. Solomon (Republican) 28.6% James E. Smith (Pro Life) 1.6% Jerry Zeldin (Libertarian) 1.2% Kenneth L. Lowndes (Ind. Con.) 0.9% Nicholas Pastuch (AFP) 0.4% |
| New Jersey 2 | William J. Hughes | Democratic | 1990 | Incumbent re-elected. | √ William J. Hughes (Democratic) 56% Frank LoBiondo (Republican) 41% Roger W. Bacon (Libertarian) 1% |
| New Jersey 3 | H. James Saxton Redistricted from the 13th district |
Republican | 1984 | Incumbent re-elected. | √ H. James Saxton (Republican) 61.7 Timothy E. Ryan (Democratic) 38.3% |
| New Jersey 4 | Chris Smith | Republican | 1980 | Incumbent re-elected. | √ Chris Smith (Republican) 63.8% Brian M. Hughes (Democratic) 36.2% |
| New Jersey 5 | Marge Roukema | Republican | 1980 | Incumbent re-elected. | √ Marge Roukema (Republican) 74.4% Frank R. Lucas (Democratic) 25.6% |
| New Jersey 6 | Frank Pallone, Jr. Redistricted from the 3rd district |
Democratic | 1988 | Incumbent re-elected. | √ Frank Pallone, Jr. (Democratic) 53.9% Joseph M. Kyrillos (Republican) 46.1% |
| Bernard J. Dwyer | Democratic | 1980 | Incumbent retired. New member elected. Democratic loss. | ||
| New Jersey 7 | Matthew J. Rinaldo | Republican | 1990 | Incumbent retired. New member elected. Republican hold. |
√ Bob Franks (Republican) 55.6% Leonard R. Sendelsky (Democratic) 44.4% |
| New Jersey 8 | Robert A. Roe | Democratic | 1990 | Incumbent retired. New member elected. Democratic hold. |
√ Herbert Klein (Democratic) 53.3% Joseph Bubba (Republican) 46.7% |
| New Jersey 9 | Robert G. Torricelli | Democratic | 1982 | Incumbent re-elected. | √ Robert G. Torricelli (Democratic) 61.2% Patrick J. Roma (Republican) 38.8% |
| New Jersey 10 | Donald M. Payne | Democratic | 1988 | Incumbent re-elected. | √ Donald M. Payne (Democratic) 79.5% Alfred D. Palermo (Republican) 20.5% |
| New Jersey 11 | Dean A. Gallo | Republican | 1984 | Incumbent re-elected. | √ Dean A. Gallo (Republican) 73.2% Ona Spiridellis (Democratic) 26.8% |
| New Jersey 12 | Dick Zimmer | Republican | 1990 | Incumbent re-elected. | √ Dick Zimmer (Republican) 67.7% Frank G. Abate (Democratic) 32.3% |
| New Jersey 13 | Frank Joseph Guarini Redistricted from the 14th district |
Democratic | 1978 | Incumbent retired. New member elected. Democratic hold. |
√ Bob Menendez (Democratic) 67.8% Fred J. Theemling, Jr. (Republican) 32.2% |
New Mexico
| District | Incumbent | Party | First Elected | Result | Candidates |
|---|---|---|---|---|---|
| New Mexico 1 | Steven Schiff | Republican | 1988 | Incumbent re-elected. | √ Steven Schiff (Republican) 62.6% Robert J. Aragon (Democratic) 37.3% |
| New Mexico 2 | Joe Skeen | Republican | 1980 | Incumbent re-elected. | √ Joe Skeen (Republican) 56.4% Dan Sosa, Jr. (Democratic) 43.5% |
| New Mexico 3 | Bill Richardson | Democratic | 1982 | Incumbent re-elected. | √ Bill Richardson (Democratic) 67.4% F. Gregg Bemis, Jr. (Republican) 30.0% Ed Nagel (Libertarian) 2.6% |
New York
New York lost three seats in reapportionment.
| District | Incumbent | Party | First elected |
Result | Candidates |
|---|---|---|---|---|---|
| New York 1 | George J. Hochbrueckner | Democratic | 1978 | Incumbent re-elected. | √ George J. Hochbrueckner (Democratic) 56.2% Edward P. Romaine (Republican) 43.8% |
| New York 2 | Thomas Downey | Democratic | 1974 | Incumbent lost re-election. New member elected. Republican gain. |
√ Rick Lazio (Republican) 50.8% Thomas Downey (Democratic) 49.2% |
| New York 3 | Norman F. Lent Redistricted from the 4th district |
Republican | 1970 | Incumbent retired. New member elected. Republican hold. |
√ Peter T. King (Republican) 49.6% Steve Orlins (Democratic) 46.5% |
| New York 4 | Raymond J. McGrath Redistricted from the 5th district |
Republican | 1980 | Incumbent retired. New member elected. Republican hold. |
√ David A. Levy (Republican) 50.4% Philip Schiliro (Democratic) 49.6% |
| New York 5 | Robert J. Mrazek Redistricted from the 3rd district |
Democratic | 1982 | Incumbent retired to run for U.S. Senator. | √ Gary Ackerman (Democratic) 56.1% Allan E. Binder (Republican) 43.9% |
| Gary Ackerman Redistricted from the 7th district |
Democratic | 1982 | Incumbent re-elected. | ||
| James H. Scheuer Redistricted from the 8th district |
Democratic | 1964, 1974 |
Incumbent retired. | ||
| New York 6 | Floyd H. Flake | Democratic | 1986 | Incumbent re-elected. | √ Floyd H. Flake (Democratic) 83.8% Dianand D. Bhagwandin (Republican) 16.2% |
| New York 7 | Thomas J. Manton Redistricted from the 9th district |
Democratic | 1984 | Incumbent re-elected. | √ Thomas J. Manton (Democratic) 61.0% Dennis C. Shea (Republican) 39.0% |
| New York 8 | Theodore S. Weiss Redistricted from the 17th district |
Democratic | 1976 | Incumbent died. New member elected. Democratic hold. |
√ Jerrold Nadler (Democratic) 83.8% David L. Askren (Republican) 16.2% |
| New York 9 | Charles E. Schumer Redistricted from the 10th district |
Democratic | 1980 | Incumbent re-elected. | √ Charles E. Schumer (Democratic) 88.1% Alice G. Gaffney (Constitution) 11.9% |
| New York 10 | Edolphus Towns Redistricted from the 11th district |
Democratic | 1982 | Incumbent re-elected. | √ Edolphus Towns (Democratic) 95.6 Owen Augustin (Constitution) 4.4% |
| New York 11 | Major Owens Redistricted from the 12th district |
Democratic | 1982 | Incumbent re-elected. | √ Major Owens (Democratic) 94.7% Michael Gaffney (Constitution) 5.3% |
| New York 12 | Stephen J. Solarz Redistricted from the 13th district |
Democratic | 1974 | Incumbent lost renomination. New member elected. Democratic hold. |
√ Nydia Velazquez (Democratic) 82.0% Angel Diaz (Republican) 18.0% |
| New York 13 | Susan Molinari Redistricted from the 14th district |
Republican | 1990 | Incumbent re-elected. | √ Susan Molinari (Republican) 57.3% Sal Albanese (Democratic) 42.7% |
| New York 14 | S. William Green Redistricted from the 15th district |
Republican | 1982 | Incumbent lost re-election. New member elected. Democratic gain. |
√ Carolyn B. Maloney (Democratic) 51.3% Bill Green (Republican) 48.7% |
| New York 15 | Charles B. Rangel Redistricted from the 16th district |
Democratic | 1970 | Incumbent re-elected. | √ Charles B. Rangel (Democratic) 96.7% Jose A. Suero (Constitution) 3.3% |
| New York 16 | Jose E. Serrano Redistricted from the 18th district |
Democratic | 1990 | Incumbent re-elected. | √ Jose E. Serrano (Democratic) 92.3% Michael Walters (Republican) 7.7% |
| New York 17 | Eliot L. Engel Redistricted from the 19th district |
Democratic | 1988 | Incumbent re-elected. | √ Eliot L. Engel (Democratic) 85.2% Martin Richman (Republican) 14.8% |
| New York 18 | Nita M. Lowey Redistricted from the 20th district |
Democratic | 1988 | Incumbent re-elected. | √ Nita M. Lowey (Democratic) 61.0% Joseph DioGuardi (Republican) 39.0% |
| New York 19 | Hamilton Fish IV Redistricted from the 21st district |
Republican | 1968 | Incumbent re-elected. | √ Hamilton Fish IV (Republican) 56.2% Neil P. McCarthy (Democratic) 43.8% |
| New York 20 | Benjamin A. Gilman Redistricted from the 22nd district |
Republican | 1972 | Incumbent re-elected. | √ Benjamin A. Gilman (Republican) 69.2% Jonathan L. Levine (Democratic) 30.8% |
| New York 21 | Michael R. McNulty Redistricted from the 23rd district |
Democratic | 1988 | Incumbent re-elected. | √ Michael R. McNulty (Democratic) 64.0% Nancy Norman (Republican) 36.0% |
| New York 22 | Gerald B.H. Solomon Redistricted from the 24th district |
Republican | 1978 | Incumbent re-elected. | √ Gerald B.H. Solomon (Republican) 61.2% David Roberts (Democratic) 38.8% |
| New York 23 | Sherwood Boehlert Redistricted from the 25th district |
Republican | 1982 | Incumbent re-elected. | √ Sherwood Boehlert (Republican) 69.3% Paula DiPerna (Democratic) 30.7% |
| New York 24 | David O'Brien Martin Redistricted from the 26th district |
Republican | 1980 | Incumbent retired. New member elected. Republican hold. |
√ John M. McHugh (Republican) 70.4% Margaret M. Ravenscroft (Democratic) 29.6% |
| New York 25 | James T. Walsh Redistricted from the 27th district |
Republican | 1988 | Incumbent re-elected. | √ James T. Walsh (Republican) 54.0% Rhea Jezer (Democratic) 46.0% |
| New York 26 | Matthew F. McHugh Redistricted from the 28th district |
Democratic | 1974 | Incumbent retired. New member elected. Democratic hold. |
√ Maurice Hinchey (Democratic) 53.4% Bob Moppert (Republican) 46.6% |
| New York 27 | L. William Paxon Redistricted from the 31st district |
Republican | 1988 | Incumbent re-elected. | √ L. William Paxon (Republican) 58.6% W. Douglas Call (Democratic) 41.4% |
| New York 28 | Frank Horton Redistricted from the 29th district |
Republican | 1962 | Incumbent retired. | √ Louise Slaughter (Democratic) 60.0% William P. Polito (Republican) 40.0% |
| Louise Slaughter Redistricted from the 30th district |
Democratic | 1986 | Incumbent re-elected. | ||
| New York 29 | John J. LaFalce Redistricted from the 32nd district |
Democratic | 1974 | Incumbent re-elected. | √ John J. LaFalce (Democratic) 58.6% William E. Miller, Jr. (Republican) 41.4% |
| New York 30 | Henry J. Nowak Redistricted from the 33rd district |
Democratic | 1974 | Incumbent retired. New member elected. Republican gain. |
√ Jack Quinn (Republican) 52.8% Dennis T. Gorski (Democratic) 47.2% |
| New York 31 | Amo Houghton Redistricted from the 34th district |
Republican | 1986 | Incumbent re-elected. | √ Amo Houghton (Republican) 72.0% Joseph P. Leahey (Democratic) 28.0% |
North Carolina
| District | Incumbent | Party | First Elected | Result | Candidates |
|---|---|---|---|---|---|
| North Carolina 1 Special |
Vacant since the September 15, 1992, death of Walter B. Jones, Sr. (Democratic) | Winner elected to finish term | √ Eva Clayton (Democratic) 67.0% Ted Tyler (Republican) 31.4% C. Barry Williams (Libertarian) 1.6% | ||
| North Carolina 1 General |
Winner elected to next term | √ Eva Clayton (Democratic) 67.0% Ted Tyler (Republican) 31.4% C. Barry Williams (Libertarian) 1.6% | |||
| North Carolina 2 | Tim Valentine | Democratic | 1982 | Incumbent re-elected. | √ Tim Valentine (Democratic) 53.7% Don Davis (Republican) 44.4% Dennis Bryant Lubahn (Libertarian) 1.9% |
| North Carolina 3 | Martin Lancaster | Democratic | 1986 | Incumbent re-elected. | √ Martin Lancaster (Democratic) 54.4% Tommy Pollard (Republican) 43.2% Mark Jackson (Libertarian) 2.4% |
| North Carolina 4 | David Price | Democratic | 1986 | Incumbent re-elected. | √ David Price (Democratic) 64.6% Vicky Rothrock Goudie (Republican) 33.7% Eugene Paczelt (Libertarian) 1.7% |
| North Carolina 5 | Stephen L. Neal | Democratic | 1974 | Incumbent re-elected. | √ Stephen L. Neal (Democratic) 52.7% Richard M. Burr (Republican) 45.6% Gary Albrecht (Libertarian) 1.7% |
| North Carolina 6 | Howard Coble | Republican | 1984 | Incumbent re-elected. | √ Howard Coble (Republican) 70.8% Robin Hood (Democratic) 29.2% |
| North Carolina 7 | Charlie Rose | Democratic | 1972 | Incumbent re-elected. | √ Charlie Rose (Democratic) 56.7% Robert C. Anderson (Republican) 40.8% Marc Kelley (Libertarian) 2.5% |
| North Carolina 8 | Bill Hefner | Democratic | 1974 | Incumbent re-elected. | √ Bill Hefner (Democratic) 57.9% Coy Privette (Republican) 36.8% J. Wendell Drye (Libertarian) 5.3% |
| North Carolina 9 | Alex McMillan | Republican | 1984 | Incumbent re-elected. | √ Alex McMillan (Republican) 67.3% Rory Blake (Democratic) 32.7% |
| North Carolina 10 | Cass Ballenger | Republican | 1986 | Incumbent re-elected. | √ Cass Ballenger (Republican) 63.4% Ben Neill (Democratic) 33.7% Jeffrey Clayton Brown (Libertarian) 2.9% |
| North Carolina 11 | Charles H. Taylor | Republican | 1990 | Incumbent re-elected. | √ Charles H. Taylor (Republican) 54.7% John S. Stevens (Democratic) 45.3% |
| North Carolina 12 | New seat | New seat. New member elected. Democratic gain. |
√ Melvin L. Watt (Democratic) 70.4% Barbara Gore Washington (Republican) 27.3% Curtis Wade Krumel (Libertarian) 2.3% | ||
North Dakota
| District | Incumbent | Party | First Elected | Result | Candidates |
|---|---|---|---|---|---|
| North Dakota at-large | vacant* | √ Earl Pomeroy (Democratic) 59.0% John T. Korsmo (Republican) 41.0% | |||
- North Dakota's house race occurred concurrently with both an ordinary senate race and a special election to the senate to replace appointee Jocelyn Burdick. The incumbent in the first senate race, Kent Conrad, ran in the special election and won; he switched seats in the senate on December 15. Democratic representative Byron Dorgan, therefore, who had won the first senate race, resigned from the house on December 15 to fill the newly vacated senate seat; as such, North Dakota's house seat remained vacant for 19 days, until Earl Pomeroy was sworn in on January 3.
Ohio
| District | Incumbent | Party | First Elected | Result | Candidates |
|---|---|---|---|---|---|
| Ohio 1 | Charlie Luken | Democratic | 1990 | Incumbent retired. New member elected. Democratic hold. |
√ David S. Mann (Democratic) 51.3% Stephen Grote (Republican) 43.3% Jim Berns (Independent) 5.4% |
| Ohio 2 | Bill Gradison | Republican | 1974 | Incumbent re-elected. | √ Bill Gradison (Republican) 70.1% Thomas R. Chandler (Democratic) 29.9% |
| Ohio 3 | Tony P. Hall | Democratic | 1978 | Incumbent re-elected. | √ Tony P. Hall (Democratic) 59.7% Stephen W. Davis (Republican) 40.3% |
| Ohio 4 | Mike Oxley | Republican | 1981 | Incumbent re-elected. | √ Mike Oxley (Republican) 61.4% Raymond M. Ball (Democratic) 38.6% |
| Ohio 5 | Paul Gillmor | Republican | 1988 | Incumbent re-elected. | √ Paul Gillmor (Republican) Unopposed |
| Ohio 6 | Bob McEwen | Republican | 1980 | Incumbent lost re-election. New member elected. Democratic gain. |
√ Ted Strickland (Democratic) 50.7% Bob McEwen (Republican) 49.3% |
| Clarence E. Miller Redistricted from the 10th Congressional District |
Republican | 1966 | Incumbent lost renomination. New member elected. Republican Loss | ||
| Ohio 7 | Dave Hobson | Republican | 1990 | Incumbent re-elected. | √ Dave Hobson (Republican) 71.3% Clifford S. Heskett (Democratic) 28.7% |
| Ohio 8 | John Boehner | Republican | 1990 | Incumbent re-elected. | √ John Boehner (Republican) 74.0% Fred Sennet (Democratic) 26.0% |
| Ohio 9 | Marcy Kaptur | Democratic | 1982 | Incumbent re-elected. | √ Marcy Kaptur (Democratic) 73.6% Ken D. Brown (Republican) 21.8% Edward Howard (Independent) 4.6% |
| Ohio 10 | Mary Rose Oakar Redistricted from the 20th district |
Democratic | 1976 | Incumbent lost re-election. New member elected. Republican gain. |
√ Martin R. Hoke (Republican) 56.8% Mary Rose Oakar (Democratic) 43.2% |
| Ohio 11 | Louis Stokes Redistricted from the 21st district |
Democratic | 1968 | Incumbent re-elected. | √ Louis Stokes (Democratic) 70.9% Beryl E. Rothschild (Republican) 20.1% Edward Gudenas (Independent) 9.0% |
| Ohio 12 | John Kasich | Republican | 1982 | Incumbent re-elected. | √ John Kasich (Republican) 71.2% Bob Fitrakis (Democratic) 28.8% |
| Ohio 13 | Don Pease | Democratic | 1976 | Incumbent retired. New member elected. Democratic hold. |
√ Sherrod Brown (Democratic) 55.2% Margaret R. Mueller (Republican) 36.5% Mark Miller (Independent) 8.3% |
| Dennis E. Eckart Redistricted from the 11th district |
Democratic | 1980 | Incumbent retired. New member elected. Democratic loss. | ||
| Ohio 14 | Thomas C. Sawyer | Democratic | 1986 | Incumbent re-elected. | √ Thomas C. Sawyer (Democratic) 67.8% Robert Morgan (Republican) 32.2% |
| Ohio 15 | Chalmers P. Wylie | Republican | 1966 | Incumbent retired. New member elected. Republican hold. |
√ Deborah Pryce (Republican) 44.1% Richard Cordray (Democratic) 37.9% Linda Reidelbach (Independent) 18.0% |
| Ohio 16 | Ralph Regula | Republican | 1972 | Incumbent re-elected. | √ Ralph Regula (Republican) 63.7% Warner D. Mendenhall (Democratic) 36.3% |
| Ohio 17 | James Traficant | Democratic | 1984 | Incumbent re-elected. | √ James Traficant (Democratic) 84.2% Salvatore Pansino (Republican) 15.8% |
| Ohio 18 | Douglas Applegate | Democratic | 1976 | Incumbent re-elected. | √ Douglas Applegate (Democratic) 68.3% Bill Ress (Republican) 31.7% |
| Ohio 19 | Ed Feighan | Democratic | 1982 | Incumbent retired. New member elected. Democratic hold. |
√ Eric Fingerhut (Democratic) 52.6% Robert A. Gardner (Republican) 47.4% |
Oklahoma
| District | Incumbent | Party | First Elected | Result | Candidates |
|---|---|---|---|---|---|
| Oklahoma 1 | Jim Inhofe | Republican | 1986 | Incumbent re-elected. | √ Jim Inhofe (Republican) 52.8% John Selph (Democratic) 47.2% |
| Oklahoma 2 | Mike Synar | Democratic | 1978 | Incumbent re-elected. | √ Mike Synar (Democratic) 55.5% Jerry Hill (Republican) 41.1% William S. Vardeman (Independent) 3.4% |
| Oklahoma 3 | Bill Brewster | Democratic | 1990 | Incumbent re-elected. | √ Bill Brewster (Democratic) 75.1% Robert W. Stokes (Republican) 24.9% |
| Oklahoma 4 | Dave McCurdy | Democratic | 1980 | Incumbent re-elected. | √ Dave McCurdy (Democratic) 70.7% Howard Bell (Republican) 29.3% |
| Oklahoma 5 | Mickey Edwards | Republican | 1976 | Incumbent lost renomination. New member elected. Republican hold. |
√ Ernest Istook (Republican) 53.4% Laurie Williams (Democratic) 46.6% |
| Oklahoma 6 | Glenn English | Democratic | 1974 | Incumbent re-elected. | √ Glenn English (Democratic) 67.8% Bob Anthony (Republican) 32.2% |
Oregon
| District | Incumbent | Party | Elected | Status | Opponent |
|---|---|---|---|---|---|
| Oregon 1 | Les AuCoin | Democratic | 1974 | Retired to run for U.S. Senator. New member elected. Democratic hold. |
√ Elizabeth Furse (Democratic) 52.5% Tony Meeker (Republican) 48.4% |
| Oregon 2 | Robert Freeman Smith | Republican | 1982 | Incumbent re-elected. | Robert Freeman Smith (Republican) 67.1% Denzel Ferguson (Democratic) 32.8% |
| Oregon 3 | Ron Wyden | Democratic | 1980 | Incumbent re-elected. | Ron Wyden (Democratic) 77.1% Al Ritter (Republican) 18.6% Blair Bobier (Libertarian) 4.2% |
| Oregon 4 | Peter DeFazio | Democratic | 1986 | Incumbent re-elected. | Peter DeFazio (Democratic) 71.4% Richard L. Schulz (Republican) 14.0% |
| Oregon 5 | Michael J. Kopetski | Democratic | 1990 | Incumbent re-elected. | √ Michael J. Kopetski (Democratic) 63.9% Jim Seagraves (Republican) 35.9% |
Pennsylvania
| District | Incumbent | Party | First Elected | Result | Candidates |
|---|---|---|---|---|---|
| Pennsylvania 1 | Thomas M. Foglietta | Democratic | 1980 | Incumbent re-elected. | √ Thomas M. Foglietta (Democratic) 80.9% Craig Snyder (Republican) 19.1% |
| Pennsylvania 2 | Lucien E. Blackwell | Democratic | 1991 | Incumbent re-elected. | √ Lucien E. Blackwell (Democratic) 76.8% Larry Hollin (Republican) 22.4% Mark Wyatt (Soc. Workers) 0.8% |
| Pennsylvania 3 | Robert A. Borski, Jr. | Democratic | 1982 | Incumbent re-elected. | √ Robert A. Borski, Jr. (Democratic) 58.9% Charles F. Dougherty (Republican) 39.1% John J. Hughes (Independent) 2.0% |
| Pennsylvania 4 | Joseph P. Kolter | Democratic | 1982 | Incumbent lost renomination. New member elected. Democratic hold. |
√ Ron Klink (Democratic) 79.4% Gordon R. Johnston (Republican) 20.6% |
| Pennsylvania 5 | William F. Clinger, Jr. Redistricted from the 23rd district (now obsolete) |
Republican | 1978 | Incumbent re-elected. Republican hold. |
√ William F. Clinger, Jr. (Republican) Unopposed |
| Pennsylvania 6 | Gus Yatron | Democratic | 1968 | Incumbent retired. New member elected. Democratic hold. |
√ Tim Holden (Democratic) 52.1% John E. Jones (Republican) 47.9% |
| Pennsylvania 7 | Richard T. Schulze Redistricted from the 5th district |
Republican | 1974 | Incumbent retired. Republican Loss |
√ Curt Weldon (Republican) 66.0% Frank Daly (Democratic) 33.5% William Alan Hickman (Nat. Law) 0.5% |
| Curt Weldon | Republican | 1986 | Incumbent re-elected. | ||
| Pennsylvania 8 | Peter H. Kostmayer | Democratic | 1982 | Incumbent lost re-election. New member elected. Republican gain. |
√ James C. Greenwood (Republican) 53.2% Peter H. Kostmayer (Democratic) 46.8% |
| Pennsylvania 9 | Bud Shuster | Republican | 1972 | Incumbent re-elected. | √ Bud Shuster (Republican) Unopposed |
| Pennsylvania 10 | Joseph M. McDade | Republican | 1962 | Incumbent re-elected. | √ Joseph M. McDade (Republican) 90.4% Albert A. Smith (Libertarian) 9.6% |
| Pennsylvania 11 | Paul E. Kanjorski | Democratic | 1984 | Incumbent re-elected. | √ Paul E. Kanjorski (Democratic) 67.1% Michael A. Fescina (Republican) 32.9% |
| Pennsylvania 12 | John Murtha | Democratic | 1974 | Incumbent re-elected. | √ John Murtha (Democratic) Unopposed |
| Pennsylvania 13 | R. Lawrence Coughlin | Republican | 1968 | Incumbent retired. New member elected. Democratic gain. |
√ Marjorie Margolies-Mezvinsky (Democratic) 50.3% Jon D. Fox (Republican) 49.7% |
| Pennsylvania 14 | William J. Coyne | Democratic | 1980 | Incumbent re-elected. | √ William J. Coyne (Democratic) 72.3% Byron W. King (Republican) 26.8% Joanne S. Kuniansky (Soc. Workers) 0.6% Paul Scherrer (Workers League) 0.3% |
| Pennsylvania 15 | Donald L. Ritter | Republican | 1978 | Incumbent lost re-election. New member elected. Democratic gain. |
√ Paul F. McHale, Jr. (Democratic) 52.2% Don Ritter (Republican) 46.7% Eugene A. Nau (Nat. Law) 1.1% |
| Pennsylvania 16 | Robert S. Walker | Republican | 1976 | Incumbent re-elected. | √ Robert S. Walker (Republican) 64.8% Robert Peters (Democratic) 35.2% |
| Pennsylvania 17 | George Gekas | Republican | 1982 | Incumbent re-elected. | √ George Gekas (Republican) 69.5% Bill Sturges (Democratic) 30.5% |
| Pennsylvania 18 | Rick Santorum | Republican | 1990 | Incumbent re-elected. | √ Rick Santorum (Republican) 60.1% Frank Pecora (Democratic) 38.0% Denise Winebrenner Edwards (New Ind.) 1.9% |
| Pennsylvania 19 | William F. Goodling | Republican | 1974 | Incumbent re-elected. | √ William F. Goodling (Republican) 45.3% Paul V. Kilker (Democratic) 34.4% Thomas M. Humbert (Independent) 20.3% |
| Pennsylvania 20 | Joseph M. Gaydos | Democratic | 1968 | Incumbent retired. Democratic loss. |
√ Austin J. Murphy (Democratic) 50.7% Bill Townsend (Republican) 49.3% |
| Austin J. Murphy Redistricted from the 22nd district (now obsolete) |
Democratic | 1976 | Incumbent re-elected. Democratic hold. | ||
| Pennsylvania 21 | Tom Ridge | Republican | 1982 | Incumbent re-elected. | √ Tom Ridge (Republican) 68.0% John C. Harkins (Democratic) 32.0% |
Rhode Island
| District | Incumbent | Party | First elected |
Result | Candidates |
|---|---|---|---|---|---|
| Rhode Island 1 | Ronald Machtley | Republican | 1988 | Incumbent re-elected. | √ Ronald Machtley (Republican) 70.0% David Carlin (Democratic) 24.8% Frederick Dick (RPI) 3.1% Norman Jacques (Independent) 2.1% |
| Rhode Island 2 | Jack Reed | Democratic | 1990 | Incumbent re-elected. | √ Jack Reed (Democratic) 70.7% James Bell (Republican) 24.4% Thomas Ricci (Independent) 3.3% John Turnbull (IT) 1.6% |
South Carolina
| District | Incumbent | Party | First Elected | Result | Candidates |
|---|---|---|---|---|---|
| South Carolina 1 | Arthur Ravenel, Jr. | Republican | 1986 | Incumbent re-elected. | √ Arthur Ravenel, Jr. (Republican) 66.1% Bill Oberst, Jr. (Democratic) 32.5% John R. Peeples (American) 1.4% |
| South Carolina 2 | Floyd Spence | Republican | 1970 | Incumbent re-elected. | √ Floyd Spence (Republican) 87.7% Geb Sommer (Libertarian) 12.3% |
| South Carolina 3 | Butler Derrick | Democratic | 1974 | Incumbent re-elected. | √ Butler Derrick (Democratic) 61.2% Jim Bland (Republican) 38.8% |
| South Carolina 4 | Liz J. Patterson | Democratic | 1986 | Incumbent lost re-election. New member elected. Republican gain. |
√ Bob Inglis (Republican) 50.4% Elizabeth J. Patterson (Democratic) 47.5% Jo Jorgensen (Libertarian) 2.1% |
| South Carolina 5 | John M. Spratt, Jr. | Democratic | 1982 | Incumbent re-elected. | √ John M. Spratt, Jr. (Democratic) 61.3% Bill Horne (Republican) 38.7% |
| South Carolina 6 | Robin Tallon | Democratic | 1982 | Incumbent retired. New member elected. Democratic hold. |
√ Jim Clyburn (Democratic) 65.3% John Chase (Republican) 34.7% |
South Dakota
| District | Incumbent | Party | First elected |
Result | Candidates |
|---|---|---|---|---|---|
| South Dakota at-large | Tim Johnson | Democratic | 1986 | Incumbent re-elected. | √ Tim Johnson (Democratic) 69.1% John Timmer (Republican) 26.9% Ronald Wieczorek (Independent) 2.0% Robert Newland (Libertarian) 1.2% Ann Balakier (Independent) 0.8% |
Tennessee
| District | Incumbent | Party | First Elected | Result | Candidates |
|---|---|---|---|---|---|
| Tennessee 1 | Jimmy Quillen | Republican | 1962 | Incumbent re-elected. | √ Jimmy Quillen (Republican) 68.9% Jack Christian (Democratic) 28.7% Don Fox (Independent) 2.4% |
| Tennessee 2 | John J. Duncan, Jr. | Republican | 1988 | Incumbent re-elected. | √ John J. Duncan, Jr. (Republican) 72.2% Troy Goodale (Democratic) 25.7% Randon J. Krieg (Independent) 2.1% |
| Tennessee 3 | Marilyn Lloyd | Democratic | 1974 | Incumbent re-elected. | √ Marilyn Lloyd (Democratic) 49.6% Zach Wamp (Republican) 48.3% Carl Hagan (Independent) 2.1% |
| Tennessee 4 | Jim Cooper | Democratic | 1982 | Incumbent re-elected. | √ Jim Cooper (Democratic) 64.6% Dale Johnson (Republican) 32.9% Ginnia C. Fox (Independent) 2.5% |
| Tennessee 5 | Bob Clement | Democratic | 1988 | Incumbent re-elected. | √ Bob Clement (Democratic) 69.0% Tom Stone (Republican) 27.2% Steven L. Edmondson (Independent) 3.8% |
| Tennessee 6 | Bart Gordon | Democratic | 1984 | Incumbent re-elected. | √ Bart Gordon (Democratic) 56.6% Marsha Blackburn (Republican) 40.6% H. Scott Benson (Independent) 2.8% |
| Tennessee 7 | Don Sundquist | Republican | 1982 | Incumbent re-elected. | √ Don Sundquist (Republican) 62.7% David R. Davis (Democratic) 36.1% Rickey Boyette (Independent) 1.2% |
| Tennessee 8 | John S. Tanner | Democratic | 1988 | Incumbent re-elected. | √ John S. Tanner (Democratic) 93.4% Lawrence J. Barnes (Independent) 6.6% |
| Tennessee 9 | Harold Ford, Sr. | Democratic | 1982 | Incumbent re-elected. | √ Harold Ford, Sr. (Democratic) 62.3% Charles L. Black (Republican) 30.6% Richard Liptock (Independent) 7.1% |
Texas
| District | Incumbent | Party | First Elected | Result | Candidates |
|---|---|---|---|---|---|
| Texas 1 | Jim Chapman | Democratic | 1985 | Incumbent re-elected. | √ Jim Chapman (Democratic) Unopposed |
| Texas 2 | Charles Wilson | Democratic | 1972 | Incumbent re-elected. | √ Charles Wilson (Democratic) 56.3% Donna Peterson (Republican) 43.7% |
| Texas 3 | Sam Johnson | Republican | 1991 | Incumbent re-elected. | √ Sam Johnson (Republican) 86.1% Noel Kopala (Libertarian) 13.9% |
| Texas 4 | Ralph Hall | Democratic | 1980 | Incumbent re-elected. | √ Ralph Hall (Democratic) 58.1% David L. Bridges (Republican) 38.1% Steven Rothacker (Libertarian) 3.8% |
| Texas 5 | John W. Bryant | Democratic | 1982 | Incumbent re-elected. | √ John W. Bryant (Democratic) 58.9% Richard Stokley (Republican) 37.3% William H. Walker (Libertarian) 3.8% |
| Texas 6 | Joe Barton | Republican | 1984 | Incumbent re-elected. | √ Joe Barton (Republican) 71.9% John Dietrich (Democratic) 28.1% |
| Texas 7 | Bill Archer | Republican | 1970 | Incumbent re-elected. | √ Bill Archer (Republican) Unopposed |
| Texas 8 | Jack Fields | Republican | 1980 | Incumbent re-elected. | √ Jack Fields (Republican) 77.0% Chas Robinson (Democratic) 23.0% |
| Texas 9 | Jack Brooks | Democratic | 1966 | Incumbent re-elected. | √ Jack Brooks (Democratic) 53.6% Steve Stockman (Republican) 43.5% Billy Joe Crawford (Libertarian) 2.9% |
| Texas 10 | J.J. Pickle | Democratic | 1963 | Incumbent re-elected. | √ J.J. Pickle (Democratic) 68.6% Herbert Spiro (Republican) 26.6% Terry Blum (Libertarian) 2.5% Jeff Davis (Independent) 2.3% |
| Texas 11 | Chet Edwards | Democratic | 1990 | Incumbent re-elected. | √ Chet Edwards (Democratic) 67.4% James W. Broyles (Republican) 32.6% |
| Texas 12 | Pete Geren | Democratic | 1989 | Incumbent re-elected. | √ Pete Geren (Democratic) 62.8% David Hobbs (Republican) 37.2% |
| Texas 13 | Bill Sarpalius | Democratic | 1988 | Incumbent re-elected. | √ Bill Sarpalius (Democratic) 60.3% Beau Boulter (Republican) 39.7% |
| Texas 14 | Greg Laughlin | Democratic | 1988 | Incumbent re-elected. | √ Greg Laughlin (Democratic) 68.1% Humberto J. Garza (Republican) 27.3% Vic Vreeland (Independent) 4.6% |
| Texas 15 | Kika de la Garza | Democratic | 1964 | Incumbent re-elected. | √ Kika de la Garza (Democratic) 60.4% Tom Haughey (Republican) 39.6% |
| Texas 16 | Ronald D. Coleman | Democratic | 1982 | Incumbent re-elected. | √ Ronald D. Coleman (Democratic) 51.9% Chip Taberski (Republican) 48.1% |
| Texas 17 | Charles Stenholm | Democratic | 1978 | Incumbent re-elected. | √ Charles Stenholm (Democratic) 66.1% Jeannie Sadowski (Republican) 33.9% |
| Texas 18 | Craig Washington | Democratic | 1989 | Incumbent re-elected. | √ Craig Washington (Democratic) 64.7% Edward Blum (Republican) 32.6% Gregg Lassen (Libertarian) 2.7% |
| Texas 19 | Larry Combest | Republican | 1984 | Incumbent re-elected. | √ Larry Combest (Republican) 77.4% Terry Lee Moser (Democratic) 22.6% |
| Texas 20 | Henry B. Gonzalez | Democratic | 1961 | Incumbent re-elected. | √ Henry B. Gonzalez (Democratic) Unopposed |
| Texas 21 | Lamar S. Smith | Republican | 1986 | Incumbent re-elected. | √ Lamar S. Smith (Republican) 72.2% James M. Gaddy (Democratic) 23.7% William E. Grisham (Libertarian) 4.1% |
| Texas 22 | Tom DeLay | Republican | 1984 | Incumbent re-elected. | √ Tom DeLay (Republican) 68.9% Richard Konrad (Democratic) 31.1% |
| Texas 23 | Albert G. Bustamante | Democratic | 1984 | Incumbent lost re-election. New member elected. Republican gain. |
√ Henry Bonilla (Republican) 59.1% Albert G. Bustamante (Democratic) 38.4% David Alter (Libertarian) 2.5% |
| Texas 24 | Martin Frost | Democratic | 1978 | Incumbent re-elected. | √ Martin Frost (Democratic) 59.8% Steve Masterson (Republican) 40.2% |
| Texas 25 | Michael A. Andrews | Democratic | 1982 | Incumbent re-elected. | √ Michael A. Andrews (Democratic) 56.0% Dolly Madison McKenna (Republican) 41.4% Richard Mauk (Libertarian) 2.6% |
| Texas 26 | Dick Armey | Republican | 1984 | Incumbent re-elected. | √ Dick Armey (Republican) 73.1% John Wayne Caton (Democratic) 26.9% |
| Texas 27 | Solomon P. Ortiz | Democratic | 1982 | Incumbent re-elected. | √ Solomon P. Ortiz (Democratic) 55.5% Jay Kimbrough (Republican) 42.6% Charles Henry Schoonover (Libertarian) 1.9% |
| Texas 28 | None (District created) | New seat. New member elected. Democratic gain. |
√ Frank Tejeda (Democratic) 87.1% David C. Slatter (Libertarian) 12.9% | ||
| Texas 29 | None (District created) | New seat. New member elected. Democratic gain. |
√ Gene Green (Democratic) 64.9% Clark Kent Ervin (Republican) 35.1% | ||
| Texas 30 | None (District created) | New seat. New member elected. Democratic gain. |
√ Eddie Bernice Johnson (Democratic) 71.5% Lucy Cain (Republican) 25.1% Ken Ashby (Libertarian) 3.4% | ||
Utah
| District | Incumbent | Party | First elected |
Result | Candidates |
|---|---|---|---|---|---|
| Utah 1 | James V. Hansen | Republican | 1980 | Incumbent re-elected. | √ James V. Hansen (Republican) 65.0% Ron Holt (Democratic) 28.0% William Lawrence (Independent) 7.0% |
| Utah 2 | Wayne Owens | Democratic | 1972; 1986 | Retired to run for U.S. Senator. New member elected. Democratic hold. |
√ Karen Shepherd (Democratic) 50.5% Enid Greene (Republican) 46.8% Peter Crane (Independent) 2.5% Eileen Koschak (SW) 0.2% |
| Utah 3 | Bill Orton | Democratic | 1990 | Incumbent re-elected. | √ Bill Orton (Democratic) 58.9% Richard Harrington (Republican) 36.7% Wayne Hill (Independent) 2.5% Charles M. Wilson (Independent) 0.9% Doug Jones (Libertarian) 0.8% Nels J'Anthony (SW) 0.2% |
Vermont
| District | Incumbent | Party | First elected |
Result | Candidates |
|---|---|---|---|---|---|
| Vermont at-large | Bernie Sanders | Independent | 1990 | Incumbent re-elected. | √ Bernie Sanders (Independent) 57.8% Tim Philbin (Republican) 30.9% Lewis Young (Democratic) 7.9% Peter Diamondstone (LU) 1.3% John Dewey (Natural Law) 1.3% Douglas Miller (LaRouche) 0.7% |
Virginia
One seat gained in reapportionment.
| District | Incumbent | Party | First elected |
Result | Candidates |
|---|---|---|---|---|---|
| Virginia 1 | Herbert H. Bateman | Republican | 1982 | Incumbent re-elected. | √ Herbert H. Bateman (Republican) 57.6% Andrew Fox (Democratic) 38.7% Donald Macleay (Independent) 3.7% |
| Virginia 2 | Owen B. Pickett | Democratic | 1986 | Incumbent re-elected. | √ Owen B. Pickett (Democratic) 56.0% J. L. Chapman (Republican) 43.9% |
| Virginia 3 | None (District created) | New seat. New member elected. Democratic gain. |
√ Bobby Scott (Democratic) 78.7% Daniel Jenkins (Republican) 21.2% | ||
| Virginia 4 | Norman Sisisky | Democratic | 1982 | Incumbent re-elected. | √ Norman Sisisky (Democratic) 68.4% Anthony Zevgolis (Republican) 31.6% |
| Virginia 5 | Lewis Payne | Democratic | 1988 | Incumbent re-elected. | √ Lewis Payne (Democratic) 68.9% W. A. Hurlburt (Republican) 31.1% |
| Virginia 6 | Jim Olin | Democratic | 1982 | Incumbent retired. New member elected. Republican gain. |
√ Bob Goodlatte (Republican) 60.0% Stephen Musselwhite (Democratic) 39.9% |
| Virginia 7 | Thomas J. Bliley, Jr. Redistricted from the 3rd district |
Republican | 1980 | Incumbent re-elected. | √ Thomas J. Bliley, Jr. (Republican) 82.8% Gerald E. Berg (Independent) 16.9% |
| George Allen | Republican | 1991 | Retired to run for Governor of Virginia. New member elected. Republican loss. | ||
| Virginia 8 | Jim Moran | Democratic | 1990 | Incumbent re-elected. | √ Jim Moran (Democratic) 56.1% Kyle E. McSlarrow (Republican) 41.6% Alvin West (Independent) 2.3% |
| Virginia 9 | Rick Boucher | Democratic | 1982 | Incumbent re-elected. | √ Rick Boucher (Democratic) 63.1% L. Garrett Weddle (Republican) 36.9% |
| Virginia 10 | Frank Wolf | Republican | 1980 | Incumbent re-elected. | √ Frank Wolf (Republican) 69.3% Raymond Vickery (Democratic) 33.4% Alan Ogden (Independent) 3.0% |
| Virginia 11 | None (District created) | New seat. New member elected. Democratic gain. |
√ Leslie Byrne (Democratic) 50.0% Henry Butler (Republican) 45.2% A. T. Narro (Independent) 2.9% Perry J. Mitchell (Independent) 1.8% | ||
Washington
| District | Incumbent | Party | First Elected | Result | Candidates |
|---|---|---|---|---|---|
| Washington 1 | John R. Miller | Republican | 1984 | Incumbent retired. New member elected. Democratic gain. |
√ Maria E. Cantwell (Democratic) 54.9% Gary Nelson (Republican) 42.0% Patrick L. Ruckert (Independent) 1.6% Anne Fleming (Nat. Law) 1.5% |
| Washington 2 | Allan B. Swift | Democratic | 1978 | Incumbent re-elected. | √ Allan B. Swift (Democratic) 52.2% Jack Metcalf (Republican) 42.1% Robin Dexter (Independent) 3.4% Karen Leibrant (Nat. Law) 2.3% |
| Washington 3 | Jolene Unsoeld | Democratic | 1988 | Incumbent re-elected. | √ Jolene Unsoeld (Democratic) 56.0% Pat Fiske (Republican) 44.0% |
| Washington 4 | Sid Morrison | Republican | 1980 | Retired to run for Governor of Washington. New member elected. Democratic gain. |
√ Jay Inslee (Democratic) 50.8% Doc Hastings (Republican) 49.2% |
| Washington 5 | Tom Foley | Democratic | 1964 | Incumbent re-elected. | √ Tom Foley (Democratic) 55.2% John Sonneland (Republican) 44.8% |
| Washington 6 | Norm Dicks | Democratic | 1976 | Incumbent re-elected. | √ Norm Dicks (Democratic) 64.2% Lauri J. Phillips (Republican) 28.0% Tom Donnelly (Independent) 6.1% Jim Horrigan (Libertarian) 1.7% |
| Washington 7 | Jim McDermott | Democratic | 1988 | Incumbent re-elected. | √ Jim McDermott (Democratic) 78.4% Glenn C. Hampson (Republican) 19.1% Paul Glumaz (Independent) 2.5% |
| Washington 8 | Rod Chandler | Republican | 1982 | Retired to run for U.S. Senator. New member elected. Republican hold. |
√ Jennifer Dunn (Republican) 60.4% George O. Tamblyn (Democratic) 33.9% Bob Adams (Independent) 5.7% |
| Washington 9 | None (District created) | New seat. New member elected. Democratic gain. |
√ Mike Kreidler (Democratic) 53.0% Pete von Reichbauer (Republican) 43.9% Brian Wilson (Independent) 3.1% | ||
West Virginia
| District | Incumbent | Party | First Elected | Result | Candidates |
|---|---|---|---|---|---|
| West Virginia 1 | Alan Mollohan | Democratic | 1982 | Incumbent re-elected. | √ Alan Mollohan (Democratic) Unopposed |
| Harley Staggers Jr. Redistricted from the 2nd district |
Democratic | 1982 | Redistricting contest Democratic loss. | ||
| West Virginia 2 | Bob Wise Redistricted from the 3rd district |
Democratic | 1982 | Incumbent re-elected. | √ Bob Wise (Democratic) 70.9% Samuel A. Cravotta (Republican) 29.1% |
| West Virginia 3 | Nick Rahall Redistricted from the 4th district |
Democratic | 1976 | Incumbent re-elected. | √ Nick Rahall (Democratic) 65.6% Ben Waldman (Republican) 34.4% |
Wisconsin
| District | Incumbent | Party | First Elected | Result | Candidates |
|---|---|---|---|---|---|
| Wisconsin 1 | Les Aspin | Democratic | 1970 | Incumbent re-elected. | √ Les Aspin (Democratic) 57.6% Mark Neumann (Republican) 40.7% John Graf (Independent) 1.7% |
| Wisconsin 2 | Scott L. Klug | Republican | 1990 | Incumbent re-elected. | √ Scott L. Klug (Republican) 62.6% Ada Deer (Democratic) 37.0% Joseph E. Schumacher (Independent) 0.4% |
| Wisconsin 3 | Steve Gunderson | Republican | 1980 | Incumbent re-elected. | √ Steve Gunderson (Republican) 56.4% Paul Sacia (Democratic) 41.7% Jay B. Evenson (Independent) 1.9% |
| Wisconsin 4 | Jerry Kleczka | Democratic | 1984 | Incumbent re-elected. | √ Jerry Kleczka (Democratic) 65.8% Joseph L. Cook (Republican) 32.2% Daniel Slak (Independent) 1.1% John Washburn (Libertarian) 0.9% |
| Wisconsin 5 | Jim Moody | Democratic | 1982 | Retired to run for U.S. Senator. New member elected. Democratic hold. |
√ Tom Barrett (Democratic) 69.5% Donalda Ann Hammersmith (Republican) 30.5% |
| Wisconsin 6 | Thomas E. Petri | Republican | 1979 | Incumbent re-elected. | √ Thomas E. Petri (Republican) 52.9% Peg Lautenschlager (Democratic) 47.1% |
| Wisconsin 7 | Dave Obey | Democratic | 1969 | Incumbent re-elected. | √ Dave Obey (Democratic) 64.4% Dale R. Vannes (Republican) 35.6% |
| Wisconsin 8 | Toby Roth | Republican | 1978 | Incumbent re-elected. | √ Toby Roth (Republican) 70.1% Catherine L. Helms (Democratic) 29.9% |
| Wisconsin 9 | Jim Sensenbrenner | Republican | 1978 | Incumbent re-elected. | √ Jim Sensenbrenner (Republican) 69.7% Ingrid K. Buxton (Democratic) 28.0% David E. Marlow (Independent) 1.7% Jeffrey Holt Millikin (Libertarian) 0.6% |
Wyoming
| District | Incumbent | Party | First elected |
Result | Candidates |
|---|---|---|---|---|---|
| Wyoming at-large | Craig L. Thomas | Republican | 1989 | Incumbent re-elected. | √ Craig L. Thomas (Republican) 57.8% Jon Herschler (Democratic) 39.3% Craig Alan McCune (Libertarian) 2.3% |
See also
References
- ↑ Pear, Robert (August 3, 1992). "THE 1992 CAMPAIGN: Congressional Districts; Redistricting Expected to Bring Surge in Minority Lawmakers". The New York Times. Retrieved September 4, 2018.