Muskegon County, Michigan
| Muskegon County, Michigan | ||
|---|---|---|
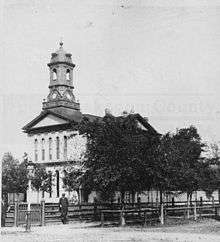 Muskegon County Courthouse | ||
| ||
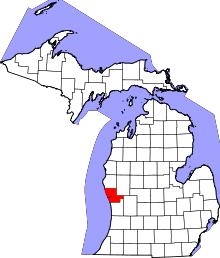 Location in the U.S. state of Michigan | ||
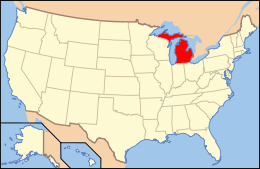 Michigan's location in the U.S. | ||
| Founded | 1859[1] | |
| Named for | Muskegon River | |
| Seat | Muskegon | |
| Largest city | Norton Shores (area), Muskegon (population) | |
| Area | ||
| • Total | 1,460 sq mi (3,781 km2) | |
| • Land | 499 sq mi (1,292 km2) | |
| • Water | 961 sq mi (2,489 km2), 66% | |
| Population | ||
| • Total | 172,344 | |
| • Density | 345/sq mi (133/km2) | |
| Congressional district | 2nd | |
| Time zone | Eastern: UTC−5/−4 | |
| Website |
www | |

Muskegon County is a county located in the U.S. state of Michigan. As of 2014, the population was 172,344.[2] The county seat is Muskegon.[3]
Muskegon County comprises the Muskegon, MI Metropolitan Statistical Area, which is part of the larger Grand Rapids-Wyoming-Muskegon, MI Combined Statistical Area. The White River flows through the county to its mouth at Lake Michigan.
History
Around 1812, Jean Baptiste Recollect and Pierre Constant set up trading posts in the area. By the Treaty of Washington (1836), Native Americans ceded parts of Michigan, including future Muskegon County, to the United States. This opened up the area to greater settlement by European Americans, who developed farms.[4]
Muskegon County was organized in 1859. Its name is from the Muskegon River, which runs through it and empties into Muskegon Lake and subsequently flows into Lake Michigan. The word "Muskegon" comes from the Ojibwa/Chippewa word mashkig, meaning "marsh" or "swamp".[1][5] See List of Michigan county name etymologies.
Geography
According to the U.S. Census Bureau, the county has a total area of 1,460 square miles (3,800 km2), of which 499 square miles (1,290 km2) is land and 961 square miles (2,490 km2) (66%) is water.[6]
Bodies of water
- White Lake
- White River
- Muskegon Lake
- Muskegon River
- Mona Lake
- Little Black Lake
- Wolf Lake
- Fox Lake
- Big Blue Lake
- Bear Lake
- Duck Lake
National protected area
- Manistee National Forest (part)
Major highways
Adjacent counties
- Oceana County, Michigan - north
- Newaygo County, Michigan - northeast
- Kent County, Michigan - east
- Ottawa County, Michigan - east
- Ottawa County, Michigan - south
- Milwaukee County, Wisconsin - southwest
- Ozaukee County, Wisconsin - west
Demographics
| Historical population | |||
|---|---|---|---|
| Census | Pop. | %± | |
| 1860 | 3,947 | — | |
| 1870 | 14,894 | 277.3% | |
| 1880 | 26,586 | 78.5% | |
| 1890 | 40,013 | 50.5% | |
| 1900 | 37,036 | −7.4% | |
| 1910 | 40,577 | 9.6% | |
| 1920 | 62,362 | 53.7% | |
| 1930 | 84,630 | 35.7% | |
| 1940 | 94,501 | 11.7% | |
| 1950 | 121,545 | 28.6% | |
| 1960 | 129,943 | 6.9% | |
| 1970 | 157,426 | 21.2% | |
| 1980 | 157,589 | 0.1% | |
| 1990 | 158,983 | 0.9% | |
| 2000 | 170,200 | 7.1% | |
| 2010 | 172,188 | 1.2% | |
| Est. 2016 | 173,408 | [7] | 0.7% |
| U.S. Decennial Census[8] 1790-1960[9] 1900-1990[10] 1990-2000[11] 2010-2013[12] | |||
As of the 2010 United States Census,[13] there were 172,188 people residing in the county. 77.4% were non-Hispanic White, 14.6% Black or African American, 0.6% Asian, 0.9% Native American, and 2.5% of two or more races. 4.8% were Hispanic or Latino (of any race).
As of the census[14] of 2000, there were 170,200 people, 63,330 households, and 44,267 families residing in the county. The population density was 334 people per square mile (129/km²). There were 68,556 housing units at an average density of 135 per square mile (52/km²). The racial makeup of the county was 81.25% White, 14.20% Black or African American, 0.82% Native American, 0.42% Asian, 0.01% Pacific Islander, 1.28% from other races, and 2.01% from two or more races 3.53% of the population were Hispanic or Latino of any race. 17.2% were of German, 9.8% Dutch, 7.3% American, 7.2% English, 6.8% Irish and 5.5% Polish ancestry according to Census 2000. 95.9% spoke English and 2.6% Spanish as their first language.
There were 63,330 households out of which 34.60% had children under the age of 18 living with them, 51.60% were married couples living together, 13.90% had a female householder with no husband present, and 30.10% were non-families. 25.20% of all households were made up of individuals and 10.40% had someone living alone who was 65 years of age or older. The average household size was 2.59 and the average family size was 3.10.
In the county, the population was spread out with 27.50% under the age of 18, 8.70% from 18 to 24, 29.00% from 25 to 44, 21.90% from 45 to 64, and 12.90% who were 65 years of age or older. The median age was 36 years. For every 100 females, there were 98.30 males. For every 100 females age 18 and over, there were 95.40 males.
The median income for a household in the county was $38,008, and the median income for a family was $45,710. Males had a median income of $35,952 versus $25,430 for females. The per capita income for the county was $17,967. About 8.80% of families and 11.40% of the population were below the poverty line, including 16.00% of those under age 18 and 8.20% of those age 65 or over.
Government
| Year | Republican | Democratic | Third Parties |
|---|---|---|---|
| 2016 | 45.9% 36,127 | 47.4% 37,304 | 6.7% 5,292 |
| 2012 | 40.4% 30,884 | 58.2% 44,436 | 1.4% 1,077 |
| 2008 | 34.5% 29,145 | 63.7% 53,821 | 1.8% 1,490 |
| 2004 | 44.0% 35,302 | 55.1% 44,282 | 0.9% 729 |
| 2000 | 43.4% 30,028 | 54.7% 37,865 | 2.0% 1,377 |
| 1996 | 34.5% 21,873 | 55.7% 35,328 | 9.8% 6,237 |
| 1992 | 33.0% 23,769 | 45.2% 32,515 | 21.8% 15,664 |
| 1988 | 53.4% 33,567 | 46.1% 28,977 | 0.6% 363 |
| 1984 | 60.7% 39,355 | 38.9% 25,247 | 0.4% 261 |
| 1980 | 53.7% 36,512 | 39.2% 26,645 | 7.1% 4,797 |
| 1976 | 56.1% 35,548 | 42.6% 27,013 | 1.3% 846 |
| 1972 | 59.6% 36,428 | 37.3% 22,804 | 3.1% 1,893 |
| 1968 | 48.1% 28,233 | 41.7% 24,492 | 10.2% 5,958 |
| 1964 | 37.5% 22,146 | 62.3% 36,769 | 0.2% 119 |
| 1960 | 53.0% 32,667 | 46.6% 28,755 | 0.4% 239 |
| 1956 | 54.0% 30,395 | 45.7% 25,679 | 0.3% 172 |
| 1952 | 51.5% 25,967 | 47.2% 23,826 | 1.3% 653 |
| 1948 | 41.5% 15,382 | 55.6% 20,631 | 3.0% 1,094 |
| 1944 | 45.0% 16,536 | 54.3% 19,963 | 0.8% 287 |
| 1940 | 43.5% 14,957 | 55.9% 19,257 | 0.6% 210 |
| 1936 | 34.5% 9,366 | 63.6% 17,252 | 1.9% 515 |
| 1932 | 45.6% 11,971 | 51.4% 13,497 | 3.0% 797 |
| 1928 | 76.3% 16,997 | 23.2% 5,158 | 0.6% 126 |
| 1924 | 79.2% 14,422 | 8.0% 1,462 | 12.8% 2,322 |
| 1920 | 73.7% 11,702 | 21.8% 3,468 | 4.5% 707 |
| 1916 | 52.2% 5,692 | 40.9% 4,465 | 6.9% 756 |
| 1912 | 18.5% 1,523 | 20.4% 1,678 | 61.2% 5,045 |
| 1908 | 69.3% 5,070 | 24.5% 1,794 | 6.2% 457 |
| 1904 | 76.5% 5,453 | 16.6% 1,181 | 7.0% 498 |
| 1900 | 63.6% 5,250 | 33.9% 2,796 | 2.5% 209 |
| 1896 | 58.8% 4,682 | 39.1% 3,110 | 2.2% 172 |
| 1892 | 49.8% 3,830 | 42.9% 3,301 | 7.4% 566 |
| 1888 | 52.4% 4,521 | 40.8% 3,514 | 6.8% 587 |
| 1884 | 49.8% 3,483 | 45.3% 3,171 | 4.9% 342 |
County government
The county government operates the jail, maintains rural roads, operates the major local courts, keeps files of deeds and mortgages, maintains vital records, administers public health regulations, and participates with the state in the provision of welfare and other social services. The county board of commissioners controls the budget but has only limited authority to make laws or ordinances. In Michigan, most local government functions — police and fire, building and zoning, tax assessment, street maintenance, etc. — are the responsibility of individual cities and townships.
Elected officials
- Prosecuting Attorney: D.J. Hilson
- Sheriff: Michael J. Poulin
- County Clerk: Nancy A. Waters
- County Treasurer: Tony Moulatsiotis
- Register of Deeds: Mark F. Fairchild
- Drain Commissioner: Brenda M Moore
- County Surveyor: Stephen Vallier
(information as of May 2017)
State representation
The Michigan Department of Corrections operates the Muskegon Correctional Facility in southeastern Muskegon. The prison first opened in 1974.[16]
Education
Public School Districts in Muskegon County:
- Fruitport Community Schools
- Holton Public Schools
- Mona Shores Public Schools
- Montague Area Public Schools
- Muskegon Public Schools
- Muskegon Heights Public Schools
- North Muskegon Public Schools
- Orchard View Schools
- Oakridge Public Schools
- Ravenna Public Schools
- Reeths-Puffer School District
- White Lake Area Community Ed.
- Whitehall District Schools
Private School Districts in Muskegon County:
- Broadway Baptist School
- Fruitport Calvary Christian
- Muskegon Catholic Central
- West Michigan Christian
Colleges and Universities:
Historical markers
There are twenty-three recognized historical markers in the county:[17] They are:
- Bluffton Actors' Colony / Buster Keaton
- Central United Methodist Church [Muskegon]
- Evergreen Cemetery
- Fruitland District No.6 School
- Hackley House
- Hackley Public Library
- Hackley-Holt House
- Hume House
- Jean Baptiste Recollect Trading Post
- Lakeside
- Lebanon Lutheran Church
- Lumbering on White Lake / Staples & Covell Mill
- Marsh Field
- Mouth Cemetery
- Muskegon Business College
- Muskegon Log Booming Company
- Muskegon Woman's Club
- Old Indian Cemetery
- Pinchtown
- Ruth Thompson
- Torrent House
- Union Depot (Muskegon)
- White Lake Yacht Club
Communities
Cities
Villages
Census-designated places
Unincorporated communities
Townships
- Blue Lake Township
- Casnovia Township
- Cedar Creek Township
- Dalton Township
- Egelston Township
- Fruitland Township
- Fruitport Charter Township
- Holton Township
- Laketon Township
- Montague Township
- Moorland Township
- Muskegon Charter Township
- Ravenna Township
- Sullivan Township
- White River Township
- Whitehall Township
See also
References
- 1 2 "Bibliography on Muskegon County". Clarke Historical Library, Central Michigan University. Retrieved January 20, 2013.
- ↑ "Archived copy". Archived from the original on 2011-07-15. Retrieved 2011-07-06.
- ↑ "Find a County". National Association of Counties. Retrieved 2011-06-07.
- ↑ Hoogterp, Edward (2006). West Michigan Almanac, p. 105. The University of Michigan Press.
- ↑ Michigan History, Arts and Libraries on sources of County names.
- ↑ "2010 Census Gazetteer Files". United States Census Bureau. August 22, 2012. Archived from the original on November 13, 2013. Retrieved September 27, 2014.
- ↑ "Population and Housing Unit Estimates". Retrieved June 9, 2017.
- ↑ "U.S. Decennial Census". United States Census Bureau. Retrieved September 27, 2014.
- ↑ "Historical Census Browser". University of Virginia Library. Retrieved September 27, 2014.
- ↑ "Population of Counties by Decennial Census: 1900 to 1990". United States Census Bureau. Retrieved September 27, 2014.
- ↑ "Census 2000 PHC-T-4. Ranking Tables for Counties: 1990 and 2000" (PDF). United States Census Bureau. Retrieved September 27, 2014.
- ↑ "State & County QuickFacts". United States Census Bureau. Archived from the original on July 15, 2011. Retrieved August 28, 2013.
- ↑ http://factfinder.census.gov/faces/tableservices/jsf/pages/productview.xhtml?src=bkmk
- ↑ "American FactFinder". United States Census Bureau. Retrieved 2008-01-31.
- ↑ http://uselectionatlas.org/RESULTS
- ↑ "Muskegon Correctional Facility (MCF). Michigan Department of Corrections. Retrieved on June 3, 2011.
- ↑ "Michigan Historical Markers". michmarkers.com.
Further reading
- "Bibliography on Muskegon County". Clarke Historical Library, Central Michigan University. Retrieved January 20, 2013.
External links
- Michigan Historical Markers.
- Muskegon County web site
- Muskegon Area First - County-wide Economic Development agency
- Bluffton Church - Muskegon Independent Church
Places adjacent to Muskegon County, Michigan | ||||||||||
|---|---|---|---|---|---|---|---|---|---|---|
| ||||||||||
Municipalities and communities of Muskegon County, Michigan, United States | ||
|---|---|---|
| Cities | | |
| Villages | ||
| Charter townships | ||
| General law townships | ||
| CDPs | ||
| Other unincorporated community | ||
| Footnotes | ‡This populated place also has portions in an adjacent county or counties | |
| Central cities | |||
|---|---|---|---|
| Counties |
| ||
| Geography | |||
| Transportation | |||
| Economy | |||