Estill County, Kentucky
| Estill County, Kentucky | |
|---|---|
 Estill County courthouse in Irvine | |
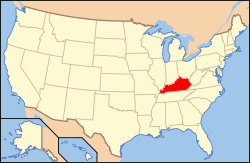
 Location in the U.S. state of Kentucky | |
 Kentucky's location in the U.S. | |
| Founded | 1808 |
| Named for | James Estill |
| Seat | Irvine |
| Largest city | Irvine |
| Area | |
| • Total | 256 sq mi (663 km2) |
| • Land | 253 sq mi (655 km2) |
| • Water | 2.5 sq mi (6 km2), 1.0% |
| Population | |
| • (2010) | 14,672 |
| • Density | 58/sq mi (22/km2) |
| Congressional district | 6th |
| Time zone | Eastern: UTC−5/−4 |
| Website |
www |
Estill County is a county located in the U.S. state of Kentucky. As of the 2010 census, the population was 14,672.[1] Its county seat is Irvine[2] The county was formed in 1808 and named for Captain James Estill, a Kentucky militia officer who was killed in the Battle of Little Mountain during the American Revolutionary War.[3] Estill County is a moist county meaning that the county seat, the city of Irvine, allows the sale of alcohol after the October 9, 2013 vote, but not the rest of Estill County outside the Irvine city limits.
In 2008, Estill County welcomed the Estill County Bicentennial that included a yearlong celebration of themed months showcasing 200 years of history, importance and the viability of Estill County and its Twin Cities of Irvine and Ravenna. Both cities sit along the Kentucky River. Ravenna is home to CSX Transportation and the historic Fitchburg & Cottage Furnaces and conducted the Ravenna Railroad Festival in August 2008. Irvine is home to the manufacturing headquarters of Carhartt, Inc. and annually hosts the Mountain Mushroom Festival over the last weekend of April.
History
Estill County was formed in 1808 from land given by Clark and Madison counties.[4] A courthouse built in 1941 replaced a structure dating from the 1860s.[5]
Geography
According to the U.S. Census Bureau, the county has a total area of 256 square miles (660 km2), of which 253 square miles (660 km2) is land and 2.5 square miles (6.5 km2) (1.0%) is water.[6]
Adjacent counties
- Clark County (north)
- Powell County (northeast)
- Lee County (southeast)
- Jackson County (south)
- Madison County (west)
National protected area
- Daniel Boone National Forest (part)
Demographics
| Historical population | |||
|---|---|---|---|
| Census | Pop. | %± | |
| 1810 | 2,082 | — | |
| 1820 | 3,507 | 68.4% | |
| 1830 | 4,618 | 31.7% | |
| 1840 | 5,535 | 19.9% | |
| 1850 | 5,985 | 8.1% | |
| 1860 | 6,886 | 15.1% | |
| 1870 | 9,198 | 33.6% | |
| 1880 | 9,860 | 7.2% | |
| 1890 | 10,836 | 9.9% | |
| 1900 | 11,669 | 7.7% | |
| 1910 | 12,273 | 5.2% | |
| 1920 | 15,569 | 26.9% | |
| 1930 | 17,079 | 9.7% | |
| 1940 | 17,978 | 5.3% | |
| 1950 | 14,677 | −18.4% | |
| 1960 | 12,466 | −15.1% | |
| 1970 | 12,752 | 2.3% | |
| 1980 | 14,495 | 13.7% | |
| 1990 | 14,614 | 0.8% | |
| 2000 | 15,307 | 4.7% | |
| 2010 | 14,672 | −4.1% | |
| Est. 2016 | 14,307 | [7] | −2.5% |
| U.S. Decennial Census[8] 1790-1960[9] 1900-1990[10] 1990-2000[11] 2010-2013[1] | |||
As of the census[12] of 2000, there were 15,307 people, 6,108 households, and 4,434 families residing in the county. The population density was 60 per square mile (23/km2). There were 6,824 housing units at an average density of 27 per square mile (10/km2). The racial makeup of the county was 99.07% White, 0.11% Black or African American, 0.24% Native American, 0.03% Asian, 0.06% from other races, and 0.49% from two or more races. 0.53% of the population were Hispanic or Latino of any race.
There were 6,108 households out of which 32.30% had children under the age of 18 living with them, 55.40% were married couples living together, 12.90% had a female householder with no husband present, and 27.40% were non-families. 24.60% of all households were made up of individuals and 10.70% had someone living alone who was 65 years of age or older. The average household size was 2.48 and the average family size was 2.94.
In the county, the population was spread out with 24.20% under the age of 18, 9.10% from 18 to 24, 29.20% from 25 to 44, 24.20% from 45 to 64, and 13.50% who were 65 years of age or older. The median age was 37 years. For every 100 females there were 93.80 males. For every 100 females age 18 and over, there were 91.20 males.
The median income for a household in the county was $23,318, and the median income for a family was $27,284. Males had a median income of $29,254 versus $18,849 for females. The per capita income for the county was $12,285. About 22.50% of families and 26.40% of the population were below the poverty line, including 32.30% of those under age 18 and 21.50% of those age 65 or over.
Politics
Although it lies in the Bluegrass and Knobs regions, Estill County was more akin to the eastern Pennyroyal Plateau to its southwest in being strongly pro-Union during the Civil War. Indeed, a larger proportion of Estill County’s population volunteered for the Union Army than the population of any free state,[13] or of any Kentucky county except the famous Republican bastion of Owsley County.[14] Consequently, Estill County has been strongly Republican ever since the end of Reconstruction – since 1888 the county has voted Democratic only for Woodrow Wilson in 1912, Franklin D. Roosevelt in 1932 and Lyndon Johnson in 1964, with the biggest of these three victories in 1932 being FDR’s by a mere one hundred and eighty-seven votes out of over six thousand one hundred.
| Year | Republican | Democratic | Third parties |
|---|---|---|---|
| 2016 | 76.4% 4,236 | 20.0% 1,108 | 3.6% 201 |
| 2012 | 72.3% 3,749 | 26.2% 1,356 | 1.5% 79 |
| 2008 | 69.4% 3,685 | 29.3% 1,555 | 1.4% 74 |
| 2004 | 65.2% 3,633 | 34.2% 1,907 | 0.6% 35 |
| 2000 | 64.4% 3,033 | 33.8% 1,591 | 1.8% 86 |
| 1996 | 49.9% 2,220 | 38.7% 1,724 | 11.4% 506 |
| 1992 | 48.7% 2,453 | 36.5% 1,837 | 14.9% 749 |
| 1988 | 64.2% 3,077 | 35.3% 1,692 | 0.5% 25 |
| 1984 | 68.6% 3,512 | 31.1% 1,593 | 0.3% 17 |
| 1980 | 58.0% 2,818 | 40.4% 1,965 | 1.6% 78 |
| 1976 | 52.2% 2,250 | 47.2% 2,034 | 0.7% 30 |
| 1972 | 69.4% 3,054 | 30.1% 1,322 | 0.5% 23 |
| 1968 | 53.6% 2,236 | 30.2% 1,261 | 16.2% 677 |
| 1964 | 48.7% 1,996 | 51.3% 2,105 | 0.0% 1 |
| 1960 | 64.9% 3,238 | 35.2% 1,755 | |
| 1956 | 60.5% 2,946 | 39.3% 1,912 | 0.2% 10 |
| 1952 | 57.8% 2,630 | 41.8% 1,900 | 0.4% 20 |
| 1948 | 50.2% 2,056 | 47.3% 1,937 | 2.5% 104 |
| 1944 | 55.2% 2,493 | 44.3% 2,000 | 0.5% 24 |
| 1940 | 52.7% 2,889 | 47.2% 2,587 | 0.2% 10 |
| 1936 | 52.4% 2,931 | 47.3% 2,646 | 0.2% 13 |
| 1932 | 48.3% 2,963 | 51.3% 3,150 | 0.4% 23 |
| 1928 | 65.8% 3,641 | 34.1% 1,886 | 0.1% 5 |
| 1924 | 48.6% 2,152 | 46.4% 2,052 | 5.0% 220 |
| 1920 | 58.2% 2,552 | 41.6% 1,823 | 0.3% 12 |
| 1916 | 55.9% 1,524 | 43.3% 1,180 | 0.8% 21 |
| 1912 | 41.1% 869 | 41.4% 875 | 17.5% 371 |
Communities
See also
References
- 1 2 "State & County QuickFacts". United States Census Bureau. Archived from the original on July 10, 2011. Retrieved March 6, 2014.
- ↑ "Find a County". National Association of Counties. Archived from the original on May 31, 2011. Retrieved 2011-06-07.
- ↑ Rennick, Robert M. (1987). Kentucky Place Names. University Press of Kentucky. p. 95. Retrieved 2013-04-28.
- ↑ Collins, Lewis (1877). History of Kentucky. p. 166.
- ↑ Hogan, Roseann Reinemuth (1992). Kentucky Ancestry: A Guide to Genealogical and Historical Research. Ancestry Publishing. p. 226. Retrieved 26 July 2013.
- ↑ "2010 Census Gazetteer Files". United States Census Bureau. August 22, 2012. Archived from the original on August 12, 2014. Retrieved August 14, 2014.
- ↑ "Population and Housing Unit Estimates". Retrieved June 9, 2017.
- ↑ "U.S. Decennial Census". United States Census Bureau. Archived from the original on May 12, 2015. Retrieved August 14, 2014.
- ↑ "Historical Census Browser". University of Virginia Library. Retrieved August 14, 2014.
- ↑ "Population of Counties by Decennial Census: 1900 to 1990". United States Census Bureau. Retrieved August 14, 2014.
- ↑ "Census 2000 PHC-T-4. Ranking Tables for Counties: 1990 and 2000" (PDF). United States Census Bureau. Retrieved August 14, 2014.
- ↑ "American FactFinder". United States Census Bureau. Archived from the original on September 11, 2013. Retrieved 2008-01-31.
- ↑ Marshall, Anne E.; Creating a Confederate Kentucky: The Lost Cause and Civil War Memory in a Border State, pp. 114-115 ISBN 1469609835
- ↑ Copeland, James E.; ‘Where Were the Kentucky Unionists and Secessionists’; The Register of the Kentucky Historical Society, volume 71, no. 4 (October, 1973), pp. 344-363
- ↑ Leip, David. "Dave Leip's Atlas of U.S. Presidential Elections". uselectionatlas.org. Retrieved 2018-07-01.
