Bon Homme County, South Dakota
| Bon Homme County, South Dakota | |
|---|---|
 | |
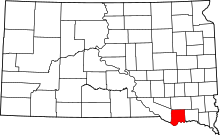 Location in the U.S. state of South Dakota | |
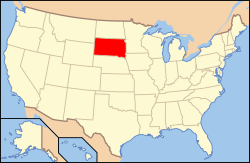 South Dakota's location in the U.S. | |
| Founded | April 5, 1862 |
| Named for | Bon Homme Island |
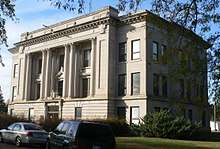
| Seat | Tyndall |
| Largest city | Springfield |
| Area | |
| • Total | 582 sq mi (1,507 km2) |
| • Land | 564 sq mi (1,461 km2) |
| • Water | 18 sq mi (47 km2), 3.1% |
| Population (est.) | |
| • (2016) | 6,984 |
| • Density | 13/sq mi (5/km2) |
| Congressional district | At-large |
| Time zone | Central: UTC−6/−5 |
| Website |
bonhomme |
Bon Homme County (pronounced BAHN'-uhm[1]) is a county located in the U.S. state of South Dakota. As of the 2010 census, the population was 7,070.[2] Its county seat is Tyndall.[3]
History
Bon Homme County was created in 1862. The name "Bon Homme" was first used by Lewis and Clerk in 1804 as the name for a 2,000 acre island in the Missouri River. When settlers arrived in the late 1850s they borrowed the name, and when the county was created it was named after the village of Bon Homme. A proposal to change the county name to "Jefferson" in 1865 was rejected. The French word "bonhomme" means "good man." [4][5] The original island is now submerged under Lewis and Clark Lake.[6] The village of Bon Homme was the original county seat until 1885, when it moved to Tyndall.[7]
Bon Homme County is the point of origin for the Siberian alien, Kali tragus, a type of tumbleweed, first reported here in 1877, probably introduced in a shipment of flax seed from Ukraine. [8]
Geography

According to the U.S. Census Bureau, the county has a total area of 582 square miles (1,510 km2), of which 564 square miles (1,460 km2) is land and 18 square miles (47 km2) (3.1%) is water.[9]
Lewis and Clark Lake, a 31,400-acre reservoir that impounds the Missouri River, is located in the southern part of the county, and is a popular tourist and recreation destination.[10]
Major highways
Adjacent counties
- Hutchinson County - north
- Yankton County - east
- Knox County, Nebraska - south
- Charles Mix County - west
National protected area
Demographics
| Historical population | |||
|---|---|---|---|
| Census | Pop. | %± | |
| 1870 | 608 | — | |
| 1880 | 5,468 | 799.3% | |
| 1890 | 9,057 | 65.6% | |
| 1900 | 10,379 | 14.6% | |
| 1910 | 11,061 | 6.6% | |
| 1920 | 11,940 | 7.9% | |
| 1930 | 11,737 | −1.7% | |
| 1940 | 10,241 | −12.7% | |
| 1950 | 9,440 | −7.8% | |
| 1960 | 9,229 | −2.2% | |
| 1970 | 8,577 | −7.1% | |
| 1980 | 8,059 | −6.0% | |
| 1990 | 7,089 | −12.0% | |
| 2000 | 7,260 | 2.4% | |
| 2010 | 7,070 | −2.6% | |
| Est. 2017 | 6,984 | [11] | −1.2% |
| U.S. Decennial Census[12] 1790-1960[13] 1900-1990[14] 1990-2000[15] 2010-2016[2] | |||
2000 census
As of the census[16] of 2000, there were 7,260 people, 2,635 households, and 1,786 families residing in the county. The population density was 13 people per square mile (5/km²). There were 3,007 housing units at an average density of 5 per square mile (2/km²). The racial makeup of the county was 95.51% White, 0.62% Black or African American, 2.99% Native American, 0.08% Asian, 0.18% from other races, and 0.62% from two or more races. 0.58% of the population were Hispanic or Latino of any race. 41.3% were of German, 19.8% Czech and 9.9% Dutch ancestry.
There were 2,635 households out of which 28.70% had children under the age of 18 living with them, 59.80% were married couples living together, 5.10% had a female householder with no husband present, and 32.20% were non-families. 29.50% of all households were made up of individuals and 16.50% had someone living alone who was 65 years of age or older. The average household size was 2.38 and the average family size was 2.95.
In the county, the population was spread out with 23.10% under the age of 18, 7.60% from 18 to 24, 26.80% from 25 to 44, 21.70% from 45 to 64, and 20.80% who were 65 years of age or older. The median age was 40 years. For every 100 females there were 123.00 males. For every 100 females age 18 and over, there were 126.40 males.
The median income for a household in the county was $30,644, and the median income for a family was $36,924. Males had a median income of $24,303 versus $20,307 for females. The per capita income for the county was $13,892. About 9.40% of families and 12.90% of the population were below the poverty line, including 16.20% of those under age 18 and 13.80% of those age 65 or over.
2010 census
As of the 2010 United States Census, there were 7,070 people, 2,457 households, and 1,572 families residing in the county.[17] The population density was 12.5 inhabitants per square mile (4.8/km2). There were 2,931 housing units at an average density of 5.2 per square mile (2.0/km2).[18] The racial makeup of the county was 89.8% white, 7.1% American Indian, 1.0% black or African American, 0.1% Asian, 0.6% from other races, and 1.4% from two or more races. Those of Hispanic or Latino origin made up 1.8% of the population.[17] In terms of ancestry, 48.6% were German, 20.6% were Czech, 11.7% were Dutch, 7.8% were Irish, 6.1% were Norwegian, and 1.7% were American.[19]
Of the 2,457 households, 25.6% had children under the age of 18 living with them, 55.7% were married couples living together, 5.5% had a female householder with no husband present, 36.0% were non-families, and 32.8% of all households were made up of individuals. The average household size was 2.24 and the average family size was 2.84. The median age was 43.1 years.[17]
The median income for a household in the county was $41,107 and the median income for a family was $51,910. Males had a median income of $34,478 versus $28,464 for females. The per capita income for the county was $20,074. About 10.1% of families and 12.4% of the population were below the poverty line, including 16.7% of those under age 18 and 12.6% of those age 65 or over.[20]
Communities
Cities
- Avon
- Scotland
- Springfield
- Tyndall (county seat)
Town
Census-designated place
Unincorporated communities
- Kingsburg
- Perkins
Townships
The county is divided into four areas of unorganized territory: Northeast Bon Homme, Northwest Bon Homme, Southeast Bon Homme, Southwest Bon Homme.
Politics
| Year | Republican | Democratic | Third parties |
|---|---|---|---|
| 2016 | 70.8% 2,105 | 23.7% 704 | 5.6% 165 |
| 2012 | 59.5% 1,830 | 38.0% 1,167 | 2.5% 77 |
| 2008 | 53.9% 1,712 | 43.1% 1,367 | 3.0% 96 |
| 2004 | 60.5% 2,063 | 37.9% 1,293 | 1.5% 52 |
| 2000 | 60.6% 1,901 | 37.0% 1,162 | 2.4% 76 |
| 1996 | 41.6% 1,428 | 45.7% 1,569 | 12.8% 439 |
| 1992 | 36.0% 1,212 | 38.4% 1,294 | 25.6% 861 |
| 1988 | 53.4% 1,826 | 46.1% 1,574 | 0.5% 17 |
| 1984 | 63.4% 2,478 | 36.1% 1,408 | 0.5% 20 |
| 1980 | 65.9% 2,794 | 28.1% 1,191 | 6.0% 254 |
| 1976 | 46.6% 1,897 | 52.9% 2,154 | 0.5% 22 |
| 1972 | 47.1% 2,116 | 52.7% 2,368 | 0.2% 9 |
| 1968 | 55.0% 2,411 | 40.5% 1,773 | 4.5% 199 |
| 1964 | 41.7% 1,784 | 58.3% 2,494 | |
| 1960 | 57.1% 2,730 | 42.9% 2,052 | |
| 1956 | 55.7% 2,696 | 44.3% 2,144 | |
| 1952 | 65.6% 3,157 | 34.4% 1,658 | |
| 1948 | 51.8% 2,283 | 47.1% 2,077 | 1.1% 48 |
| 1944 | 56.3% 2,553 | 43.7% 1,981 | |
| 1940 | 55.3% 3,046 | 44.7% 2,463 | |
| 1936 | 42.2% 2,236 | 55.8% 2,959 | 2.0% 104 |
| 1932 | 27.7% 1,354 | 71.7% 3,504 | 0.6% 28 |
| 1928 | 50.9% 2,262 | 48.8% 2,166 | 0.3% 13 |
| 1924 | 41.8% 1,420 | 25.3% 860 | 32.9% 1,118 |
| 1920 | 53.2% 1,872 | 27.3% 960 | 19.5% 685 |
| 1916 | 47.9% 1,231 | 49.8% 1,278 | 2.3% 60 |
| 1912 | 0.0% 0 | 44.7% 1,059 | 55.4% 1,313 |
| 1908 | 55.3% 1,324 | 42.3% 1,014 | 2.4% 58 |
| 1904 | 62.3% 1,547 | 35.7% 886 | 2.0% 50 |
| 1900 | 54.9% 1,271 | 44.4% 1,028 | 0.7% 15 |
| 1896 | 56.4% 1,163 | 43.3% 893 | 0.3% 7 |
| 1892 | 49.5% 879 | 14.7% 260 | 35.8% 636 |
See also
| Wikimedia Commons has media related to Bon Homme County, South Dakota. |
References
- ↑ "Broadcast Pronunciation Guide and South Dakota Pronunciations". Associated Press. Archived from the original on 2011-06-14. Retrieved 2009-11-10.
- 1 2 "State & County QuickFacts". United States Census Bureau. Retrieved November 26, 2013.
- ↑ "Find a County". National Association of Counties. Archived from the original on 2011-05-31. Retrieved 2011-06-07.
- ↑ South Dakota place-names (1941), pp. 16-17.
- ↑ Kingsbury, George W. History of Dakota Territory, Volume 1, pp. 121-25 (1915)
- ↑ Journals of the Lewis & Clark Expedition (September 1, 1804), and note 3 ("Bon Homme Island was still on maps in the 1890s, between Bon Homme County, South Dakota, and Knox County, Nebraska. It is now inundated by Lewis and Clark Lake.")
- ↑ (11 October 1999). A River Settlement West Of Yankton Challenged The Mother City For The Government Of Dakota, Yankton Daily Press & Dakotan
- ↑ Ayres, Debra; Ryan, Frederick; Eva, Grotkopp; John, Bailey; Gaskin, John (May 5, 2009). "Tumbleweed (Salsola, section Kali) species and speciation in California". Biological Invasions. 11 (5): 1176. doi:10.1007/s10530-008-9380-5. Retrieved September 26, 2018.
- ↑ "2010 Census Gazetteer Files". United States Census Bureau. August 22, 2012. Retrieved March 22, 2015.
- ↑ http://www.nwo.usace.army.mil/Missions/Dam-and-Lake-Projects/Missouri-River-Dams/Gavins-Point/
- ↑ "Population and Housing Unit Estimates". Retrieved April 16, 2018.
- ↑ "U.S. Decennial Census". United States Census Bureau. Archived from the original on May 12, 2015. Retrieved March 22, 2015.
- ↑ "Historical Census Browser". University of Virginia Library. Retrieved March 22, 2015.
- ↑ Forstall, Richard L., ed. (March 27, 1995). "Population of Counties by Decennial Census: 1900 to 1990". United States Census Bureau. Retrieved March 22, 2015.
- ↑ "Census 2000 PHC-T-4. Ranking Tables for Counties: 1990 and 2000" (PDF). United States Census Bureau. April 2, 2001. Retrieved March 22, 2015.
- ↑ "American FactFinder". United States Census Bureau. Archived from the original on 2013-09-11. Retrieved 2011-05-14.
- 1 2 3 "DP-1 Profile of General Population and Housing Characteristics: 2010 Demographic Profile Data". United States Census Bureau. Retrieved 2016-03-11.
- ↑ "Population, Housing Units, Area, and Density: 2010 - County". United States Census Bureau. Retrieved 2016-03-11.
- ↑ "DP02 SELECTED SOCIAL CHARACTERISTICS IN THE UNITED STATES – 2006-2010 American Community Survey 5-Year Estimates". United States Census Bureau. Retrieved 2016-03-11.
- ↑ "DP03 SELECTED ECONOMIC CHARACTERISTICS – 2006-2010 American Community Survey 5-Year Estimates". United States Census Bureau. Retrieved 2016-03-11.
- ↑ Leip, David. "Dave Leip's Atlas of U.S. Presidential Elections". uselectionatlas.org. Retrieved 2018-04-13.
Places adjacent to Bon Homme County, South Dakota | ||||||||||
|---|---|---|---|---|---|---|---|---|---|---|
| ||||||||||
Municipalities and communities of Bon Homme County, South Dakota, United States | ||
|---|---|---|
| Cities | | |
| Town | ||
| CDP | ||
| Unincorporated community | ||