Jerauld County, South Dakota
| Jerauld County, South Dakota | |
|---|---|
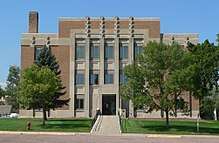 Jerauld County Courthouse in Wessington Springs | |
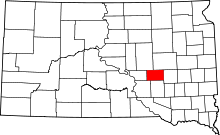 Location in the U.S. state of South Dakota | |
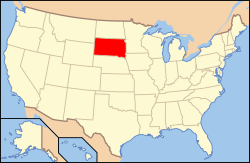 South Dakota's location in the U.S. | |
| Founded | 1883 |
| Named for | H. J. Jerauld |
| Seat | Wessington Springs |
| Largest city | Wessington Springs |
| Area | |
| • Total | 533 sq mi (1,380 km2) |
| • Land | 526 sq mi (1,362 km2) |
| • Water | 6.4 sq mi (17 km2), 1.2% |
| Population (est.) | |
| • (2016) | 2,004 |
| • Density | 3.9/sq mi (1.5/km2) |
| Congressional district | At-large |
| Time zone | Central: UTC−6/−5 |
Jerauld County is a county located in the U.S. state of South Dakota. As of the 2010 census, the population was 2,071.[1] Its county seat is Wessington Springs.[2]
History
In 1873, the area occupied by the present Jerauld county was organized into Wetmore County. In 1881, Wetmore and its neighbor county to the south, Cragin County, were combined to form Aurora County. In 1883, the area of the former Wetmore County was reincorporated as present-day Jerauld County.
It was named for H. J. Jerauld, a legislator.[3]
Geography
According to the U.S. Census Bureau, the county has a total area of 533 square miles (1,380 km2), of which 526 square miles (1,360 km2) is land and 6.4 square miles (17 km2) (1.2%) is water.[4]
Major Highways
Adjacent Counties
- Beadle County, South Dakota - northeast
- Sanborn County, South Dakota - east
- Aurora County, South Dakota - south
- Brule County, South Dakota - southwest
- Buffalo County, South Dakota - west
- Hand County, South Dakota - northwest
Demographics
| Historical population | |||
|---|---|---|---|
| Census | Pop. | %± | |
| 1890 | 3,605 | — | |
| 1900 | 2,798 | −22.4% | |
| 1910 | 5,120 | 83.0% | |
| 1920 | 6,338 | 23.8% | |
| 1930 | 5,816 | −8.2% | |
| 1940 | 4,752 | −18.3% | |
| 1950 | 4,476 | −5.8% | |
| 1960 | 4,048 | −9.6% | |
| 1970 | 3,310 | −18.2% | |
| 1980 | 2,929 | −11.5% | |
| 1990 | 2,425 | −17.2% | |
| 2000 | 2,295 | −5.4% | |
| 2010 | 2,071 | −9.8% | |
| Est. 2017 | 2,028 | [5] | −2.1% |
| U.S. Decennial Census[6] 1790-1960[7] 1900-1990[8] 1990-2000[9] 2010-2016[1] | |||
2000 census
As of the census[10] of 2000, there were 2,295 people, 987 households, and 651 families residing in the county. The population density was 4 people per square mile (2/km²). There were 1,167 housing units at an average density of 2 per square mile (1/km²). The racial makeup of the county was 99.00% White, 0.57% Native American, 0.13% Asian, and 0.31% from two or more races. 0.31% of the population were Hispanic or Latino of any race.
There were 987 households out of which 24.30% had children under the age of 18 living with them, 56.40% were married couples living together, 6.30% had a female householder with no husband present, and 34.00% were non-families. 31.30% of all households were made up of individuals and 17.70% had someone living alone who was 65 years of age or older. The average household size was 2.28 and the average family size was 2.85.
In the county, the population was spread out with 21.40% under the age of 18, 6.90% from 18 to 24, 19.80% from 25 to 44, 26.20% from 45 to 64, and 25.60% who were 65 years of age or older. The median age was 46 years. For every 100 females there were 98.40 males. For every 100 females age 18 and over, there were 96.00 males.
The median income for a household in the county was $30,690, and the median income for a family was $36,076. Males had a median income of $24,583 versus $17,500 for females. The per capita income for the county was $16,856. About 15.20% of families and 20.60% of the population were below the poverty line, including 30.90% of those under age 18 and 8.30% of those age 65 or over.
2010 census
As of the 2010 United States Census, there were 2,071 people, 870 households, and 564 families residing in the county.[11] The population density was 3.9 inhabitants per square mile (1.5/km2). There were 1,070 housing units at an average density of 2.0 per square mile (0.77/km2).[12] The racial makeup of the county was 97.0% white, 0.2% Asian, 0.2% American Indian, 0.1% Pacific islander, 1.6% from other races, and 0.7% from two or more races. Those of Hispanic or Latino origin made up 4.1% of the population.[11] In terms of ancestry, 50.6% were German, 17.7% were Norwegian, 11.6% were English, 6.8% were Irish, 5.3% were Swedish, and 2.2% were American.[13]
Of the 870 households, 20.2% had children under the age of 18 living with them, 55.1% were married couples living together, 6.2% had a female householder with no husband present, 35.2% were non-families, and 30.9% of all households were made up of individuals. The average household size was 2.18 and the average family size was 2.70. The median age was 48.6 years.[11]
The median income for a household in the county was $40,607 and the median income for a family was $44,717. Males had a median income of $32,017 versus $20,505 for females. The per capita income for the county was $24,942. About 10.2% of families and 10.9% of the population were below the poverty line, including 13.3% of those under age 18 and 12.9% of those age 65 or over.[14]
Politics
In the 2008 US presidential election, Republican John McCain won Jerauld County over Democrat Barack Obama by 4 votes.[15] It was the closest county result in the country in the 2008 election.
| Year | Republican | Democratic | Third parties |
|---|---|---|---|
| 2016 | 67.0% 648 | 27.3% 264 | 5.7% 55 |
| 2012 | 53.5% 538 | 44.9% 452 | 1.6% 16 |
| 2008 | 49.4% 546 | 49.1% 542 | 1.5% 17 |
| 2004 | 59.6% 736 | 39.0% 482 | 1.5% 18 |
| 2000 | 55.6% 624 | 41.7% 468 | 2.7% 30 |
| 1996 | 38.9% 530 | 48.1% 656 | 13.1% 178 |
| 1992 | 35.3% 518 | 40.9% 600 | 23.8% 349 |
| 1988 | 50.7% 777 | 49.0% 751 | 0.4% 6 |
| 1984 | 64.8% 1,012 | 34.7% 542 | 0.5% 8 |
| 1980 | 58.9% 1,018 | 34.4% 595 | 6.7% 116 |
| 1976 | 49.2% 821 | 50.6% 845 | 0.2% 3 |
| 1972 | 54.3% 988 | 45.6% 829 | 0.2% 3 |
| 1968 | 55.6% 1,002 | 41.3% 745 | 3.1% 56 |
| 1964 | 46.2% 857 | 53.8% 999 | |
| 1960 | 57.5% 1,165 | 42.6% 863 | |
| 1956 | 53.9% 1,175 | 46.1% 1,005 | |
| 1952 | 69.2% 1,520 | 30.8% 677 | |
| 1948 | 54.6% 1,085 | 44.1% 876 | 1.3% 26 |
| 1944 | 62.5% 1,217 | 37.5% 731 | |
| 1940 | 63.2% 1,576 | 36.8% 919 | |
| 1936 | 42.9% 1,075 | 53.6% 1,343 | 3.4% 86 |
| 1932 | 31.3% 836 | 66.3% 1,773 | 2.4% 64 |
| 1928 | 62.7% 1,517 | 36.2% 875 | 1.2% 28 |
| 1924 | 52.9% 1,054 | 11.4% 228 | 35.7% 711 |
| 1920 | 57.0% 1,038 | 19.6% 357 | 23.4% 425 |
| 1916 | 48.4% 612 | 46.6% 589 | 5.0% 63 |
| 1912 | 0.0% 0 | 38.0% 436 | 62.0% 711 |
| 1908 | 53.3% 582 | 36.9% 403 | 9.8% 107 |
| 1904 | 68.9% 586 | 16.3% 139 | 14.8% 126 |
| 1900 | 48.6% 374 | 46.4% 357 | 5.1% 39 |
| 1896 | 44.5% 274 | 54.6% 336 | 1.0% 6 |
| 1892 | 47.1% 327 | 6.5% 45 | 46.5% 323 |
Media
The county is served by the True Dakotan weekly newspaper.[17]
Communities
City
- Wessington Springs (county seat)
Towns
Townships
The county is divided into fourteen townships:
- Alpena
- Anina
- Blaine
- Chery
- Crow
- Crow Lake
- Franklin
- Harmony
- Logan
- Marlar
- Media
- Pleasant
- Viola
- Wessington Springs
Unorganized territory
The county contains one area of unorganized territory: Dale.
See also
References
- 1 2 "State & County QuickFacts". United States Census Bureau. Archived from the original on July 12, 2011. Retrieved November 25, 2013.
- ↑ "Find a County". National Association of Counties. Archived from the original on 2015-05-10. Retrieved 2011-06-07.
- ↑ Gannett, Henry (1905). The Origin of Certain Place Names in the United States. Govt. Print. Off. p. 169.
- ↑ "2010 Census Gazetteer Files". United States Census Bureau. August 22, 2012. Retrieved March 26, 2015.
- ↑ "Population and Housing Unit Estimates". Retrieved April 16, 2018.
- ↑ "U.S. Decennial Census". United States Census Bureau. Archived from the original on May 12, 2015. Retrieved March 26, 2015.
- ↑ "Historical Census Browser". University of Virginia Library. Retrieved March 26, 2015.
- ↑ Forstall, Richard L., ed. (March 27, 1995). "Population of Counties by Decennial Census: 1900 to 1990". United States Census Bureau. Retrieved March 26, 2015.
- ↑ "Census 2000 PHC-T-4. Ranking Tables for Counties: 1990 and 2000" (PDF). United States Census Bureau. April 2, 2001. Retrieved March 26, 2015.
- ↑ "American FactFinder". United States Census Bureau. Retrieved 2011-05-14.
- 1 2 3 "DP-1 Profile of General Population and Housing Characteristics: 2010 Demographic Profile Data". United States Census Bureau. Retrieved 2016-03-12.
- ↑ "Population, Housing Units, Area, and Density: 2010 - County". United States Census Bureau. Retrieved 2016-03-12.
- ↑ "DP02 SELECTED SOCIAL CHARACTERISTICS IN THE UNITED STATES – 2006-2010 American Community Survey 5-Year Estimates". United States Census Bureau. Retrieved 2016-03-12.
- ↑ "DP03 SELECTED ECONOMIC CHARACTERISTICS – 2006-2010 American Community Survey 5-Year Estimates". United States Census Bureau. Retrieved 2016-03-12.
- ↑ Leip, David. "2008 Presidential General Election Results - Jerauld County, SD". uselectionatlas.org. Retrieved 2018-04-15.
- ↑ Leip, David. "Dave Leip's Atlas of U.S. Presidential Elections". uselectionatlas.org. Retrieved 2018-04-15.
- ↑ "True Dakotan". South Dakota Press Association. Archived from the original on October 2, 2010. Retrieved October 29, 2010.
External links
- NACO Jerauld County - County government information from NACO
Coordinates: 44°04′N 98°37′W / 44.06°N 98.62°W
Places adjacent to Jerauld County, South Dakota | ||||||||||
|---|---|---|---|---|---|---|---|---|---|---|
| ||||||||||
Municipalities and communities of Jerauld County, South Dakota, United States | ||
|---|---|---|
| City | | |
| Towns | ||
| Unincorporated communities |
| |
| Townships |
| |
| Places | ||