Davison County, South Dakota
| Davison County, South Dakota | |
|---|---|
.jpg) City Hall, Mitchell, South Dakota | |
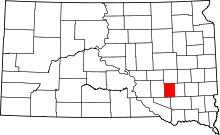 Location in the U.S. state of South Dakota | |
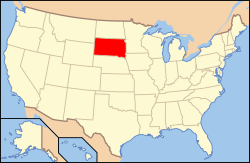 South Dakota's location in the U.S. | |
| Founded | 1874 |
| Seat | Mitchell |
| Largest city | Mitchell |
| Area | |
| • Total | 437 sq mi (1,132 km2) |
| • Land | 436 sq mi (1,129 km2) |
| • Water | 1.4 sq mi (4 km2), 0.3% |
| Population (est.) | |
| • (2016) | 19,903 |
| • Density | 45/sq mi (17/km2) |
| Congressional district | At-large |
| Time zone | Central: UTC−6/−5 |
| Website |
www |
Davison County is a county located in the U.S. state of South Dakota. As of the 2010 census, the population was 19,504.[1] Its county seat is Mitchell.[2] The county was created in 1873 and organized in 1874.[3] It was named for Henry C. Davison, the first settler in the county.[4]
Davison County is part of the Mitchell, SD Micropolitan Statistical Area.
Geography
According to the U.S. Census Bureau, the county has a total area of 437 square miles (1,130 km2), of which 436 square miles (1,130 km2) is land and 1.4 square miles (3.6 km2) (0.3%) is water.[5] It is the fourth-smallest county in South Dakota by area.
Major highways
Adjacent counties
- Sanborn County - north
- Hanson County - east
- Hutchinson County - southeast
- Douglas County - southwest
- Aurora County - west
Demographics
| Historical population | |||
|---|---|---|---|
| Census | Pop. | %± | |
| 1880 | 1,256 | — | |
| 1890 | 5,449 | 333.8% | |
| 1900 | 7,483 | 37.3% | |
| 1910 | 11,625 | 55.4% | |
| 1920 | 14,139 | 21.6% | |
| 1930 | 16,821 | 19.0% | |
| 1940 | 15,336 | −8.8% | |
| 1950 | 16,522 | 7.7% | |
| 1960 | 16,681 | 1.0% | |
| 1970 | 17,319 | 3.8% | |
| 1980 | 17,820 | 2.9% | |
| 1990 | 17,503 | −1.8% | |
| 2000 | 18,741 | 7.1% | |
| 2010 | 19,504 | 4.1% | |
| Est. 2017 | 19,704 | [6] | 1.0% |
| U.S. Decennial Census[7] 1790-1960[8] 1900-1990[9] 1990-2000[10] 2010-2016[1] | |||
2000 census
As of the census[11] of 2000, there were 18,741 people, 7,585 households, and 4,770 families residing in the county. The population density was 43 people per square mile (17/km²). There were 8,093 housing units at an average density of 19 per square mile (7/km²). The racial makeup of the county was 96.23% White, 0.27% Black or African American, 1.98% Native American, 0.43% Asian, 0.02% Pacific Islander, 0.30% from other races, and 0.77% from two or more races. 0.69% of the population were Hispanic or Latino of any race. 50.8% were of German, 10.1% Norwegian, 5.5% Irish and 5.4% American ancestry.
There were 7,585 households out of which 31.10% had children under the age of 18 living with them, 51.40% were married couples living together, 8.20% had a female householder with no husband present, and 37.10% were non-families. 30.80% of all households were made up of individuals and 13.40% had someone living alone who was 65 years of age or older. The average household size was 2.38 and the average family size was 3.00.
In the county, the population was spread out with 25.40% under the age of 18, 12.00% from 18 to 24, 25.90% from 25 to 44, 20.40% from 45 to 64, and 16.20% who were 65 years of age or older. The median age was 36 years. For every 100 females, there were 94.10 males. For every 100 females age 18 and over, there were 91.80 males.
The median income for a household in the county was $33,476, and the median income for a family was $44,357. Males had a median income of $30,825 versus $20,940 for females. The per capita income for the county was $17,879. About 8.20% of families and 11.50% of the population were below the poverty line, including 11.30% of those under age 18 and 10.40% of those age 65 or over.
2010 census
As of the 2010 United States Census, there were 19,504 people, 8,296 households, and 4,892 families residing in the county.[12] The population density was 44.8 inhabitants per square mile (17.3/km2). There were 8,852 housing units at an average density of 20.3 per square mile (7.8/km2).[13] The racial makeup of the county was 94.4% white, 2.5% American Indian, 0.5% Asian, 0.4% black or African American, 0.1% Pacific islander, 0.5% from other races, and 1.6% from two or more races. Those of Hispanic or Latino origin made up 1.5% of the population.[12] In terms of ancestry, 51.8% were German, 10.6% were Norwegian, 10.1% were Irish, 7.4% were English, 6.0% were Dutch, and 4.5% were American.[14]
Of the 8,296 households, 28.1% had children under the age of 18 living with them, 46.6% were married couples living together, 8.5% had a female householder with no husband present, 41.0% were non-families, and 34.3% of all households were made up of individuals. The average household size was 2.26 and the average family size was 2.91. The median age was 37.8 years.[12]
The median income for a household in the county was $41,867 and the median income for a family was $54,677. Males had a median income of $37,688 versus $26,223 for females. The per capita income for the county was $22,794. About 6.9% of families and 13.8% of the population were below the poverty line, including 12.1% of those under age 18 and 10.4% of those age 65 or over.[15]
Communities
Cities
- Mitchell (county seat)
- Mount Vernon
Town
Census-designated place
Townships
The county is divided into twelve townships:
- Badger Township
- Baker Township
- Beulah Township
- Blenden Township
- Tobin Township
- Lisbon Township
- Mitchell Township
- Mount Vernon Township
- Perry Township
- Prosper Township
- Rome Township
- Union Township
Politics
| Year | Republican | Democratic | Third parties |
|---|---|---|---|
| 2016 | 64.9% 5,157 | 29.6% 2,355 | 5.5% 440 |
| 2012 | 59.7% 4,757 | 38.2% 3,042 | 2.2% 172 |
| 2008 | 56.0% 4,731 | 42.0% 3,554 | 2.0% 170 |
| 2004 | 62.1% 5,561 | 36.5% 3,263 | 1.4% 128 |
| 2000 | 59.1% 4,445 | 39.0% 2,936 | 2.0% 147 |
| 1996 | 44.8% 3,371 | 44.7% 3,364 | 10.5% 793 |
| 1992 | 38.2% 3,111 | 40.3% 3,285 | 21.5% 1,750 |
| 1988 | 51.7% 4,024 | 47.6% 3,705 | 0.7% 57 |
| 1984 | 59.4% 4,783 | 40.4% 3,248 | 0.2% 17 |
| 1980 | 55.7% 4,743 | 36.5% 3,107 | 7.8% 662 |
| 1976 | 44.7% 3,688 | 54.7% 4,510 | 0.6% 50 |
| 1972 | 44.5% 3,796 | 55.2% 4,710 | 0.3% 25 |
| 1968 | 50.1% 3,869 | 46.4% 3,585 | 3.4% 265 |
| 1964 | 36.5% 2,789 | 63.5% 4,861 | |
| 1960 | 50.0% 4,105 | 50.0% 4,108 | |
| 1956 | 51.6% 4,056 | 48.4% 3,809 | |
| 1952 | 59.7% 4,774 | 40.3% 3,227 | |
| 1948 | 42.0% 2,996 | 57.0% 4,064 | 1.0% 68 |
| 1944 | 47.6% 2,929 | 52.4% 3,222 | |
| 1940 | 46.4% 3,659 | 53.6% 4,230 | |
| 1936 | 32.2% 2,510 | 63.8% 4,983 | 4.0% 312 |
| 1932 | 28.7% 2,147 | 70.0% 5,233 | 1.3% 100 |
| 1928 | 58.2% 3,821 | 41.5% 2,729 | 0.3% 21 |
| 1924 | 51.7% 2,801 | 10.7% 578 | 37.6% 2,038 |
| 1920 | 54.2% 2,605 | 23.0% 1,105 | 22.9% 1,100 |
| 1916 | 50.5% 1,516 | 45.8% 1,374 | 3.8% 113 |
| 1912 | 0.0% 0 | 45.3% 1,266 | 54.7% 1,530 |
| 1908 | 50.9% 1,276 | 43.1% 1,081 | 6.0% 149 |
| 1904 | 68.8% 1,626 | 21.4% 506 | 9.7% 230 |
| 1900 | 50.3% 853 | 46.1% 782 | 3.7% 62 |
| 1896 | 45.1% 616 | 53.7% 733 | 1.2% 16 |
| 1892 | 42.8% 569 | 9.0% 120 | 48.2% 640 |
See also
References
- 1 2 "State & County QuickFacts". United States Census Bureau. Archived from the original on July 9, 2011. Retrieved November 25, 2013.
- ↑ "Find a County". National Association of Counties. Archived from the original on 2011-05-31. Retrieved 2011-06-07.
- ↑ "Dakota Territory, South Dakota, and North Dakota: Individual County Chronologies". Dakota Territory Atlas of Historical County Boundaries. The Newberry Library. 2006. Retrieved March 29, 2015.
- ↑ Gannett, Henry (1905). The Origin of Certain Place Names in the United States. Govt. Print. Off. p. 101.
- ↑ "2010 Census Gazetteer Files". United States Census Bureau. August 22, 2012. Retrieved March 24, 2015.
- ↑ "Population and Housing Unit Estimates". Retrieved April 16, 2018.
- ↑ "U.S. Decennial Census". United States Census Bureau. Archived from the original on May 12, 2015. Retrieved March 24, 2015.
- ↑ "Historical Census Browser". University of Virginia Library. Retrieved March 24, 2015.
- ↑ Forstall, Richard L., ed. (March 27, 1995). "Population of Counties by Decennial Census: 1900 to 1990". United States Census Bureau. Retrieved March 24, 2015.
- ↑ "Census 2000 PHC-T-4. Ranking Tables for Counties: 1990 and 2000" (PDF). United States Census Bureau. April 2, 2001. Retrieved March 24, 2015.
- ↑ "American FactFinder". United States Census Bureau. Archived from the original on 2013-09-11. Retrieved 2011-05-14.
- 1 2 3 "DP-1 Profile of General Population and Housing Characteristics: 2010 Demographic Profile Data". United States Census Bureau. Retrieved 2016-03-11.
- ↑ "Population, Housing Units, Area, and Density: 2010 - County". United States Census Bureau. Retrieved 2016-03-11.
- ↑ "DP02 SELECTED SOCIAL CHARACTERISTICS IN THE UNITED STATES – 2006-2010 American Community Survey 5-Year Estimates". United States Census Bureau. Retrieved 2016-03-11.
- ↑ "DP03 SELECTED ECONOMIC CHARACTERISTICS – 2006-2010 American Community Survey 5-Year Estimates". United States Census Bureau. Retrieved 2016-03-11.
- ↑ Leip, David. "Dave Leip's Atlas of U.S. Presidential Elections". uselectionatlas.org. Retrieved 2018-04-15.
External links
Places adjacent to Davison County, South Dakota | ||||||||||
|---|---|---|---|---|---|---|---|---|---|---|
| ||||||||||
Municipalities and communities of Davison County, South Dakota, United States | ||
|---|---|---|
| City | | |
| Town | ||
| CDP | ||