Dewey County, South Dakota
| Dewey County, South Dakota | |
|---|---|
 | |
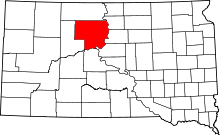 Location in the U.S. state of South Dakota | |
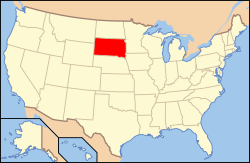 South Dakota's location in the U.S. | |
| Founded | 1910 |
| Named for | William P. Dewey |
| Seat | Timber Lake |
| Largest community | North Eagle Butte |
| Area | |
| • Total | 2,445 sq mi (6,333 km2) |
| • Land | 2,302 sq mi (5,962 km2) |
| • Water | 143 sq mi (370 km2), 5.8% |
| Population (est.) | |
| • (2016) | 5,742 |
| • Density | 2.3/sq mi (0.9/km2) |
| Congressional district | At-large |
| Time zone | Mountain: UTC−7/−6 |
Dewey County is a county located in the U.S. state of South Dakota. As of the 2010 census, the population was 5,301.[1] Its county seat is Timber Lake.[2] The county was created in 1883 and organized in 1910.[3] It was named for William P. Dewey,[4] Territorial surveyor-general from 1873 to 1877.
Almost the entire county lies in the Cheyenne River Indian Reservation. The balance of the county, along its extreme northern county line, lies in the Standing Rock Indian Reservation. It is one of five South Dakota counties that are contained within Indian reservations.
Geography
According to the U.S. Census Bureau, the county has a total area of 2,445 square miles (6,330 km2), of which 2,302 square miles (5,960 km2) is land and 143 square miles (370 km2) (5.8%) is water.[5]
Major highways
Adjacent counties
- Corson County - north
- Walworth County - northeast
- Potter County - east
- Sully County - southeast
- Stanley County - south
- Ziebach County - west
Demographics
| Historical population | |||
|---|---|---|---|
| Census | Pop. | %± | |
| 1910 | 1,145 | — | |
| 1920 | 4,802 | 319.4% | |
| 1930 | 6,476 | 34.9% | |
| 1940 | 5,709 | −11.8% | |
| 1950 | 4,916 | −13.9% | |
| 1960 | 5,257 | 6.9% | |
| 1970 | 5,170 | −1.7% | |
| 1980 | 5,366 | 3.8% | |
| 1990 | 5,523 | 2.9% | |
| 2000 | 5,972 | 8.1% | |
| 2010 | 5,301 | −11.2% | |
| Est. 2017 | 5,835 | [6] | 10.1% |
| U.S. Decennial Census[7] 1790-1960[8] 1900-1990[9] 1990-2000[10] 2010-2016[1] | |||
2000 census
As of the census[11] of 2000, there were 5,972 people, 1,863 households, and 1,386 families residing in the county. The population density was 3 people per square mile (1/km²). There were 2,133 housing units at an average density of 1 per square mile (0/km²). The racial makeup of the county was 74.16% Native American, 24.15% White, 0.03% Black or African American, 0.12% Asian, 0.05% Pacific Islander, 0.07% from other races, and 1.42% from two or more races. 0.85% of the population were Hispanic or Latino of any race. 14.2% were of German ancestry according to Census 2000. 84.6% spoke English and 14.4% Dakota as their first language.
There were 1,863 households out of which 43.70% had children under the age of 18 living with them, 42.90% were married couples living together, 22.30% had a female householder with no husband present, and 25.60% were non-families. 22.10% of all households were made up of individuals and 8.90% had someone living alone who was 65 years of age or older. The average household size was 3.15 and the average family size was 3.66.
In the county, the population was spread out with 38.90% under the age of 18, 9.00% from 18 to 24, 27.20% from 25 to 44, 16.60% from 45 to 64, and 8.30% who were 65 years of age or older. The median age was 26 years. For every 100 females there were 95.90 males. For every 100 females age 18 and over, there were 95.00 males.
The median income for a household in the county was $23,272, and the median income for a family was $24,917. Males had a median income of $21,522 versus $18,777 for females. The per capita income for the county was $9,251. About 29.80% of families and 33.60% of the population were below the poverty line, including 37.70% of those under age 18 and 28.50% of those age 65 or over. The county's per-capita income makes it one of the poorest counties in the United States.
2010 census
As of the 2010 United States Census, there were 5,301 people, 1,730 households, and 1,239 families residing in the county.[12] The population density was 2.3 inhabitants per square mile (0.89/km2). There were 2,002 housing units at an average density of 0.9 per square mile (0.35/km2).[13] The racial makeup of the county was 74.9% American Indian, 21.0% white, 0.2% Asian, 0.1% black or African American, 0.2% from other races, and 3.6% from two or more races. Those of Hispanic or Latino origin made up 1.8% of the population.[12] In terms of ancestry, 13.2% were German, 6.5% were Irish, and 0.6% were American.[14]
Of the 1,730 households, 45.9% had children under the age of 18 living with them, 37.6% were married couples living together, 24.2% had a female householder with no husband present, 28.4% were non-families, and 24.6% of all households were made up of individuals. The average household size was 3.05 and the average family size was 3.60. The median age was 30.0 years.[12]
The median income for a household in the county was $33,255 and the median income for a family was $40,500. Males had a median income of $33,942 versus $28,594 for females. The per capita income for the county was $15,632. About 20.5% of families and 30.5% of the population were below the poverty line, including 39.5% of those under age 18 and 13.5% of those age 65 or over.[15]
Communities
Cities
- Eagle Butte (partial)
- Timber Lake (county seat)
Town
Census-designated places
Unincorporated communities
Unorganized territories
The county is divided into two areas of unorganized territory: North Dewey and South Dewey.
Politics
Owing to its Native American majority population, Dewey has since the 1990s been a strongly Democratic county in solidly Republican South Dakota. The last Republican to carry the county was Ronald Reagan in his 1984 landslide when he came within 3,819 votes of claiming all fifty states. Before this period, by contrast, Dewey was a Republican-leaning county even for South Dakota. Between its formation and 1984 Dewey had voted Democratic only in the three landslide Democratic wins of 1964, 1936 and 1932, plus for Woodrow Wilson in 1916 when his anti-war policies had strong appeal in the West.
| Year | Republican | Democratic | Third parties |
|---|---|---|---|
| 2016 | 42.3% 723 | 52.0% 888 | 5.7% 97 |
| 2012 | 35.0% 663 | 63.7% 1,207 | 1.3% 25 |
| 2008 | 32.6% 659 | 65.8% 1,328 | 1.6% 32 |
| 2004 | 35.9% 921 | 62.6% 1,606 | 1.4% 37 |
| 2000 | 45.3% 761 | 52.4% 880 | 2.4% 40 |
| 1996 | 33.2% 657 | 56.3% 1,114 | 10.5% 208 |
| 1992 | 36.6% 642 | 43.7% 766 | 19.6% 344 |
| 1988 | 42.8% 765 | 56.3% 1,007 | 1.0% 17 |
| 1984 | 54.5% 941 | 44.7% 772 | 0.8% 14 |
| 1980 | 59.1% 1,045 | 34.0% 600 | 6.9% 122 |
| 1976 | 53.5% 820 | 46.0% 706 | 0.5% 8 |
| 1972 | 58.9% 1,008 | 40.8% 699 | 0.3% 5 |
| 1968 | 52.7% 941 | 40.4% 721 | 6.9% 123 |
| 1964 | 43.8% 981 | 56.2% 1,259 | |
| 1960 | 52.8% 1,168 | 47.2% 1,044 | |
| 1956 | 56.8% 1,197 | 43.2% 912 | |
| 1952 | 66.3% 1,301 | 33.7% 660 | |
| 1948 | 53.8% 864 | 45.3% 727 | 0.9% 15 |
| 1944 | 64.1% 913 | 35.9% 511 | |
| 1940 | 56.4% 1,396 | 43.6% 1,081 | |
| 1936 | 44.3% 1,012 | 53.2% 1,216 | 2.6% 59 |
| 1932 | 30.5% 710 | 68.4% 1,591 | 1.1% 26 |
| 1928 | 56.4% 1,293 | 43.4% 996 | 0.2% 4 |
| 1924 | 53.1% 956 | 12.3% 222 | 34.6% 624 |
| 1920 | 63.3% 880 | 24.1% 335 | 12.6% 175 |
| 1916 | 47.0% 352 | 50.6% 379 | 2.4% 18 |
| 1912 | 42.2% 411 | 57.8% 563 |
See also
References
- 1 2 "State & County QuickFacts". United States Census Bureau. Retrieved November 25, 2013.
- ↑ "Find a County". National Association of Counties. Archived from the original on 2011-05-31. Retrieved 2011-06-07.
- ↑ "Dakota Territory, South Dakota, and North Dakota: Individual County Chronologies". Dakota Territory Atlas of Historical County Boundaries. The Newberry Library. 2006. Retrieved March 29, 2015.
- ↑ Gannett, Henry (1905). The Origin of Certain Place Names in the United States. Govt. Print. Off. p. 105.
- ↑ "2010 Census Gazetteer Files". United States Census Bureau. August 22, 2012. Retrieved March 24, 2015.
- ↑ "Population and Housing Unit Estimates". Retrieved April 16, 2018.
- ↑ "U.S. Decennial Census". United States Census Bureau. Archived from the original on May 12, 2015. Retrieved March 24, 2015.
- ↑ "Historical Census Browser". University of Virginia Library. Retrieved March 24, 2015.
- ↑ Forstall, Richard L., ed. (March 27, 1995). "Population of Counties by Decennial Census: 1900 to 1990". United States Census Bureau. Retrieved March 24, 2015.
- ↑ "Census 2000 PHC-T-4. Ranking Tables for Counties: 1990 and 2000" (PDF). United States Census Bureau. April 2, 2001. Retrieved March 24, 2015.
- ↑ "American FactFinder". United States Census Bureau. Archived from the original on 2013-09-11. Retrieved 2011-05-14.
- 1 2 3 "DP-1 Profile of General Population and Housing Characteristics: 2010 Demographic Profile Data". United States Census Bureau. Retrieved 2016-03-11.
- ↑ "Population, Housing Units, Area, and Density: 2010 - County". United States Census Bureau. Retrieved 2016-03-11.
- ↑ "DP02 SELECTED SOCIAL CHARACTERISTICS IN THE UNITED STATES – 2006-2010 American Community Survey 5-Year Estimates". United States Census Bureau. Retrieved 2016-03-11.
- ↑ "DP03 SELECTED ECONOMIC CHARACTERISTICS – 2006-2010 American Community Survey 5-Year Estimates". United States Census Bureau. Retrieved 2016-03-11.
- ↑ Leip, David. "Dave Leip's Atlas of U.S. Presidential Elections". uselectionatlas.org. Retrieved 2018-04-15.
Places adjacent to Dewey County, South Dakota | ||||||||||
|---|---|---|---|---|---|---|---|---|---|---|
| ||||||||||
Municipalities and communities of Dewey County, South Dakota, United States | ||
|---|---|---|
| Cities | | |
| Town | ||
| CDPs | ||
| Unincorporated communities | ||
| Indian reservations | ||
| Footnotes | ‡This populated place also has portions in an adjacent county or counties | |