Lyman County, South Dakota
| Lyman County, South Dakota | |
|---|---|
 | |
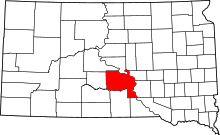 Location in the U.S. state of South Dakota | |
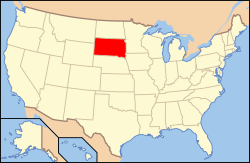 South Dakota's location in the U.S. | |
| Founded | 1893 |
| Named for | W. P. Lyman, a politician[1] |
| Seat | Kennebec |
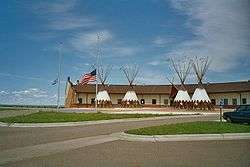
| Largest community | Lower Brule |
| Area | |
| • Total | 1,707 sq mi (4,421 km2) |
| • Land | 1,642 sq mi (4,253 km2) |
| • Water | 65 sq mi (168 km2), 3.8% |
| Population (est.) | |
| • (2016) | 3,894 |
| • Density | 2.3/sq mi (0.9/km2) |
| Congressional district | At-large |
| Time zone | Central: UTC−6/−5 |
| Website |
www |
Lyman County is a county located in the U.S. state of South Dakota. As of the 2010 census, the population was 3,755.[2] Its county seat is Kennebec.[3]
History
Lyman County was created in 1873 and organized in 1893.[4] Oacoma served as its first county seat in 1891; in 1922 the seat was transferred to Kennebec.[5]
Geography
According to the U.S. Census Bureau, the county has a total area of 1,707 square miles (4,420 km2), of which 1,642 square miles (4,250 km2) is land and 65 square miles (170 km2) (3.8%) is water.[6]
Major highways


Adjacent counties
- Hughes County, South Dakota - north
- Hyde County, South Dakota - northeast
- Buffalo County, South Dakota - northeast
- Brule County, South Dakota - east
- Charles Mix County, South Dakota - southeast
- Gregory County, South Dakota - south
- Tripp County, South Dakota - south
- Mellette County, South Dakota - southwest
- Jones County, South Dakota - west
- Stanley County, South Dakota - northwest
National protected area
Demographics
| Historical population | |||
|---|---|---|---|
| Census | Pop. | %± | |
| 1880 | 124 | — | |
| 1890 | 233 | 87.9% | |
| 1900 | 2,632 | 1,029.6% | |
| 1910 | 10,848 | 312.2% | |
| 1920 | 6,591 | −39.2% | |
| 1930 | 6,335 | −3.9% | |
| 1940 | 5,045 | −20.4% | |
| 1950 | 4,572 | −9.4% | |
| 1960 | 4,428 | −3.1% | |
| 1970 | 4,060 | −8.3% | |
| 1980 | 3,864 | −4.8% | |
| 1990 | 3,638 | −5.8% | |
| 2000 | 3,895 | 7.1% | |
| 2010 | 3,755 | −3.6% | |
| Est. 2017 | 3,904 | [7] | 4.0% |
| U.S. Decennial Census[8] 1790-1960[9] 1900-1990[10] 1990-2000[11] 2010-2016[2] | |||
2000 census
As of the census[12] of 2000, there were 3,895 people, 1,400 households, and 1,009 families residing in the county. The population density was 2 people per square mile (1/km²). There were 1,636 housing units at an average density of 1 per square mile (0/km²). The racial makeup of the county was 64.75% White, 0.08% Black or African American, 33.27% Native American, 0.23% Asian, 0.05% from other races, and 1.62% from two or more races. 0.46% of the population were Hispanic or Latino of any race.
There were 1,400 households out of which 36.10% had children under the age of 18 living with them, 51.40% were married couples living together, 13.80% had a female householder with no husband present, and 27.90% were non-families. 24.60% of all households were made up of individuals and 10.50% had someone living alone who was 65 years of age or older. The average household size was 2.77 and the average family size was 3.29.
In the county, the population was spread out with 32.10% under the age of 18, 7.60% from 18 to 24, 25.90% from 25 to 44, 20.90% from 45 to 64, and 13.60% who were 65 years of age or older. The median age was 34 years. For every 100 females there were 104.60 males. For every 100 females age 18 and over, there were 102.10 males.
The median income for a household in the county was $28,509, and the median income for a family was $32,028. Males had a median income of $22,628 versus $18,672 for females. The per capita income for the county was $13,862. About 19.40% of families and 24.30% of the population were below the poverty line, including 24.00% of those under age 18 and 12.90% of those age 65 or over.
2010 census
As of the 2010 United States Census, there were 3,755 people, 1,392 households, and 967 families residing in the county.[13] The population density was 2.3 inhabitants per square mile (0.89/km2). There were 1,704 housing units at an average density of 1.0 per square mile (0.39/km2).[14] The racial makeup of the county was 58.3% white, 38.2% American Indian, 0.3% Asian, 0.1% black or African American, 0.1% from other races, and 2.9% from two or more races. Those of Hispanic or Latino origin made up 1.1% of the population.[13] In terms of ancestry, 27.3% were German, 9.2% were Irish, 9.1% were Norwegian, and 1.0% were American.[15]
Of the 1,392 households, 35.6% had children under the age of 18 living with them, 47.1% were married couples living together, 15.2% had a female householder with no husband present, 30.5% were non-families, and 27.2% of all households were made up of individuals. The average household size was 2.67 and the average family size was 3.19. The median age was 36.1 years.[13]
The median income for a household in the county was $36,323 and the median income for a family was $45,045. Males had a median income of $32,760 versus $25,512 for females. The per capita income for the county was $16,930. About 17.4% of families and 18.8% of the population were below the poverty line, including 25.4% of those under age 18 and 5.8% of those age 65 or over.[16]
Communities
City
Towns
Census-designated places
Unincorporated community
Townships
The county is divided into sixteen townships:
- Bailey
- Butte
- Dorman
- Fairland
- Iona
- Morningside
- Oacoma
- Pleasant
- Pratt
- Reliance
- Rex
- Rose
- Rowe
- Sioux
- Stony Butte
- Vivian
Unorganized territories
The county contains six areas of unincorporated territory:
- Black Dog
- Lafayette
- Lower Brule
- McClure
- Northwest Lyman
- South Lyman
Politics
Like all of South Dakota outside Native American counties, Lyman County is strongly Republican. No Democratic Presidential candidate has carried Lyman County since Lyndon Johnson’s landslide of 1964, although Jimmy Carter, Michael Dukakis, Bill Clinton and Barack Obama have all managed to exceed forty percent. Nonetheless, when Bill’s wife Hilary ran on the Democratic ticket in 2016, she won just 26 percent of the county’s ballots, for the worst Democratic result since Alton B. Parker in 1904 won only 22 percent.
| Year | Republican | Democratic | Third parties |
|---|---|---|---|
| 2016 | 68.8% 977 | 26.0% 369 | 5.3% 75 |
| 2012 | 59.5% 933 | 38.6% 605 | 2.0% 31 |
| 2008 | 54.5% 894 | 43.3% 710 | 2.3% 37 |
| 2004 | 53.0% 1,029 | 45.0% 872 | 2.0% 39 |
| 2000 | 63.1% 875 | 34.8% 482 | 2.1% 29 |
| 1996 | 47.7% 726 | 42.4% 646 | 9.9% 151 |
| 1992 | 45.2% 669 | 32.8% 486 | 22.0% 325 |
| 1988 | 57.0% 843 | 42.6% 631 | 0.4% 6 |
| 1984 | 69.8% 1,120 | 29.8% 478 | 0.4% 7 |
| 1980 | 66.9% 1,256 | 25.9% 486 | 7.2% 136 |
| 1976 | 51.3% 892 | 47.8% 831 | 0.9% 16 |
| 1972 | 60.0% 1,166 | 39.8% 774 | 0.2% 4 |
| 1968 | 57.9% 1,063 | 35.0% 643 | 7.1% 131 |
| 1964 | 44.9% 862 | 55.1% 1,057 | |
| 1960 | 57.8% 1,166 | 42.2% 852 | |
| 1956 | 56.9% 1,151 | 43.1% 873 | |
| 1952 | 70.1% 1,561 | 29.9% 666 | |
| 1948 | 51.9% 993 | 47.3% 904 | 0.8% 15 |
| 1944 | 57.9% 867 | 42.1% 630 | |
| 1940 | 56.1% 1,409 | 44.0% 1,105 | |
| 1936 | 44.7% 1,090 | 54.1% 1,321 | 1.2% 29 |
| 1932 | 29.7% 811 | 68.8% 1,879 | 1.5% 40 |
| 1928 | 54.8% 1,488 | 45.0% 1,222 | 0.3% 8 |
| 1924 | 44.3% 1,061 | 16.2% 387 | 39.5% 947 |
| 1920 | 59.6% 1,050 | 26.3% 463 | 14.1% 248 |
| 1916 | 45.7% 981 | 49.0% 1,052 | 5.4% 116 |
| 1912 | 39.8% 766 | 60.2% 1,159 | |
| 1908 | 53.1% 1,524 | 41.2% 1,183 | 5.7% 162 |
| 1904 | 73.5% 986 | 22.8% 306 | 3.7% 49 |
| 1900 | 66.6% 429 | 32.6% 210 | 0.8% 5 |
| 1896 | 59.1% 114 | 40.4% 78 | 0.5% 1 |
See also
| Wikimedia Commons has media related to Lyman County, South Dakota. |
References
- ↑ Gannett, Henry (1905). The Origin of Certain Place Names in the United States. U.S. Government Printing Office. p. 192.
- 1 2 "State & County QuickFacts". United States Census Bureau. Archived from the original on July 14, 2011. Retrieved November 25, 2013.
- ↑ "Find a County". National Association of Counties. Retrieved 2011-06-07.
- ↑ "Dakota Territory, South Dakota, and North Dakota: Individual County Chronologies". Dakota Territory Atlas of Historical County Boundaries. The Newberry Library. 2006. Retrieved March 30, 2015.
- ↑ Hellmann, Paul T. (May 13, 2013). Historical Gazetteer of the United States. Routledge. p. 994. Retrieved 30 November 2013.
- ↑ "2010 Census Gazetteer Files". United States Census Bureau. August 22, 2012. Retrieved March 28, 2015.
- ↑ "Population and Housing Unit Estimates". Retrieved April 16, 2018.
- ↑ "U.S. Decennial Census". United States Census Bureau. Retrieved March 28, 2015.
- ↑ "Historical Census Browser". University of Virginia Library. Retrieved March 28, 2015.
- ↑ Forstall, Richard L., ed. (March 27, 1995). "Population of Counties by Decennial Census: 1900 to 1990". United States Census Bureau. Retrieved March 28, 2015.
- ↑ "Census 2000 PHC-T-4. Ranking Tables for Counties: 1990 and 2000" (PDF). United States Census Bureau. April 2, 2001. Retrieved March 28, 2015.
- ↑ "American FactFinder". United States Census Bureau. Retrieved 2011-05-14.
- 1 2 3 "DP-1 Profile of General Population and Housing Characteristics: 2010 Demographic Profile Data". United States Census Bureau. Retrieved 2016-03-12.
- ↑ "Population, Housing Units, Area, and Density: 2010 - County". United States Census Bureau. Retrieved 2016-03-12.
- ↑ "DP02 SELECTED SOCIAL CHARACTERISTICS IN THE UNITED STATES – 2006-2010 American Community Survey 5-Year Estimates". United States Census Bureau. Retrieved 2016-03-12.
- ↑ "DP03 SELECTED ECONOMIC CHARACTERISTICS – 2006-2010 American Community Survey 5-Year Estimates". United States Census Bureau. Retrieved 2016-03-12.
- ↑ Leip, David. "Dave Leip's Atlas of U.S. Presidential Elections". uselectionatlas.org. Retrieved 2018-04-15.
External links
Places adjacent to Lyman County, South Dakota | ||||||||||
|---|---|---|---|---|---|---|---|---|---|---|
| ||||||||||
Municipalities and communities of Lyman County, South Dakota, United States | ||
|---|---|---|
| City | | |
| Towns | ||
| CDPs | ||
| Unincorporated communities | ||
| Indian reservations | ||
| Ghost town | ||
| Footnotes | ‡This populated place also has portions in an adjacent county or counties | |