Stanley County, South Dakota
| Stanley County, South Dakota | |
|---|---|
 Watercolor drawing of Fort Pierre Chouteau. Dated 1854. | |
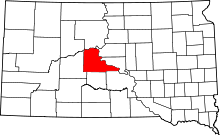 Location in the U.S. state of South Dakota | |
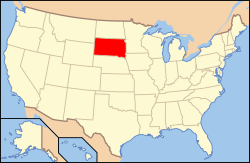 South Dakota's location in the U.S. | |
| Founded | 1890 |
| Named for | David S. Stanley |
| Seat | Fort Pierre |
| Largest city | Fort Pierre |
| Area | |
| • Total | 1,517 sq mi (3,929 km2) |
| • Land | 1,444 sq mi (3,740 km2) |
| • Water | 73 sq mi (189 km2), 4.8% |
| Population (est.) | |
| • (2016) | 2,993 |
| • Density | 2.1/sq mi (0.8/km2) |
| Congressional district | At-large |
| Time zones |
Mountain: UTC−7/−6 western portion |
|
Central: UTC−6/−5 eastern portion | |
| Website |
www |
Stanley County is a county located in the U.S. state of South Dakota. As of the 2010 census, the population was 2,966.[1] Its county seat is Fort Pierre.[2] The county was created in 1873 and organized in 1890.[3]
Stanley County is included in the Pierre, SD Micropolitan Statistical Area.
Geography
According to the U.S. Census Bureau, the county has a total area of 1,517 square miles (3,930 km2), of which 1,444 square miles (3,740 km2) is land and 73 square miles (190 km2) (4.8%) is water.[4]
Although the county seat Fort Pierre is located in the Mountain Time Zone, most residents of the city use Central Time because of close social and economic ties with Pierre, which is located in the Central Time Zone.
Major highways


Adjacent counties
- Dewey County - north
- Sully County - northeast
- Hughes County - east
- Lyman County - southeast
- Jones County - south
- Haakon County - west
National protected area
Demographics
| Historical population | |||
|---|---|---|---|
| Census | Pop. | %± | |
| 1880 | 793 | — | |
| 1890 | 1,028 | 29.6% | |
| 1900 | 1,341 | 30.4% | |
| 1910 | 14,975 | 1,016.7% | |
| 1920 | 2,908 | −80.6% | |
| 1930 | 2,381 | −18.1% | |
| 1940 | 1,959 | −17.7% | |
| 1950 | 2,055 | 4.9% | |
| 1960 | 4,085 | 98.8% | |
| 1970 | 2,457 | −39.9% | |
| 1980 | 2,533 | 3.1% | |
| 1990 | 2,453 | −3.2% | |
| 2000 | 2,772 | 13.0% | |
| 2010 | 2,966 | 7.0% | |
| Est. 2017 | 3,011 | [5] | 1.5% |
| U.S. Decennial Census[6] 1790-1960[7] 1900-1990[8] 1990-2000[9] 2010-2016[1] | |||
2000 census
As of the census[10] of 2000, there were 2,772 people, 1,111 households, and 775 families residing in the county. The population density was 2 people per square mile (1/km²). There were 1,277 housing units at an average density of 1 per square mile (0/km²). The racial makeup of the county was 93.04% White, 0.18% Black or African American, 4.91% Native American, 0.29% Asian, 0.14% from other races, and 1.44% from two or more races. 0.43% of the population were Hispanic or Latino of any race.
There were 1,111 households out of which 33.60% had children under the age of 18 living with them, 55.60% were married couples living together, 10.10% had a female householder with no husband present, and 30.20% were non-families. 25.20% of all households were made up of individuals and 7.90% had someone living alone who was 65 years of age or older. The average household size was 2.49 and the average family size was 2.98.
In the county, the population was spread out with 27.10% under the age of 18, 7.10% from 18 to 24, 28.20% from 25 to 44, 26.60% from 45 to 64, and 11.00% who were 65 years of age or older. The median age was 38 years. For every 100 females, there were 101.60 males. For every 100 females age 18 and over, there were 98.00 males.
The median income for a household in the county was $41,170, and the median income for a family was $47,197. Males had a median income of $29,911 versus $20,898 for females. The per capita income for the county was $20,300. About 6.60% of families and 8.70% of the population were below the poverty line, including 10.80% of those under age 18 and 12.80% of those age 65 or over.
2010 census
As of the 2010 United States Census, there were 2,966 people, 1,228 households, and 857 families residing in the county.[11] The population density was 2.1 inhabitants per square mile (0.81/km2). There were 1,387 housing units at an average density of 1.0 per square mile (0.39/km2).[12] The racial makeup of the county was 90.0% white, 6.6% American Indian, 0.3% black or African American, 0.1% Asian, 0.2% from other races, and 2.8% from two or more races. Those of Hispanic or Latino origin made up 0.7% of the population.[11] In terms of ancestry, 46.4% were German, 12.5% were Irish, 10.8% were English, 10.7% were Norwegian, 8.4% were Czech, 5.0% were Swedish, and 2.5% were American.[13]
Of the 1,228 households, 30.8% had children under the age of 18 living with them, 56.7% were married couples living together, 8.5% had a female householder with no husband present, 30.2% were non-families, and 26.2% of all households were made up of individuals. The average household size was 2.42 and the average family size was 2.87. The median age was 41.9 years.[11]
The median income for a household in the county was $51,875 and the median income for a family was $54,722. Males had a median income of $33,929 versus $25,574 for females. The per capita income for the county was $27,435. About 8.8% of families and 11.9% of the population were below the poverty line, including 18.1% of those under age 18 and 17.3% of those age 65 or over.[14]
Communities
City
- Fort Pierre (county seat)
Unincorporated communities
Townships
The county is divided into three areas of unorganized territory: Lower Brule, North Stanley, and South Stanley.
In popular culture
The Triple U Buffalo Ranch in northern Stanley County was used in filming the 1990 movie Dances with Wolves.
Notable residents
- Casey Tibbs[15] (1929–1990): cowboy, rodeo performer, and actor
Politics
Like almost all of South Dakota outside Native American counties, Stanley County is powerfully Republican. No Democratic Presidential candidate has won Stanley County since Lyndon Johnson in 1964, whilst Michael Dukakis during the drought-affected 1988 election is the last Democrat to top forty percent.
| Year | Republican | Democratic | Third parties |
|---|---|---|---|
| 2016 | 73.3% 1,148 | 21.0% 329 | 5.7% 90 |
| 2012 | 69.0% 1,063 | 28.3% 435 | 2.7% 42 |
| 2008 | 65.5% 1,017 | 32.8% 510 | 1.7% 26 |
| 2004 | 69.6% 1,129 | 28.6% 464 | 1.9% 30 |
| 2000 | 69.2% 955 | 29.1% 402 | 1.7% 24 |
| 1996 | 57.5% 795 | 32.9% 454 | 9.6% 133 |
| 1992 | 51.4% 719 | 30.5% 427 | 18.1% 253 |
| 1988 | 57.3% 698 | 41.9% 511 | 0.8% 10 |
| 1984 | 72.5% 942 | 27.0% 351 | 0.5% 6 |
| 1980 | 68.7% 892 | 26.1% 339 | 5.2% 68 |
| 1976 | 53.6% 637 | 46.1% 548 | 0.3% 4 |
| 1972 | 61.0% 779 | 38.5% 492 | 0.6% 7 |
| 1968 | 51.6% 572 | 39.6% 439 | 8.8% 98 |
| 1964 | 42.3% 549 | 57.7% 750 | |
| 1960 | 48.2% 678 | 51.9% 730 | |
| 1956 | 50.9% 587 | 49.1% 567 | |
| 1952 | 70.6% 695 | 29.4% 289 | |
| 1948 | 58.9% 522 | 40.5% 359 | 0.7% 6 |
| 1944 | 62.1% 384 | 37.9% 234 | |
| 1940 | 55.7% 679 | 44.3% 541 | |
| 1936 | 42.1% 495 | 53.5% 629 | 4.4% 52 |
| 1932 | 41.4% 553 | 56.7% 757 | 2.0% 26 |
| 1928 | 62.4% 739 | 36.9% 437 | 0.7% 8 |
| 1924 | 43.8% 531 | 20.5% 249 | 35.6% 432 |
| 1920 | 56.8% 598 | 37.4% 394 | 5.8% 61 |
| 1916 | 38.3% 254 | 57.4% 381 | 4.4% 29 |
| 1912 | 47.5% 1,051 | 52.6% 1,164 | |
| 1908 | 56.5% 2,313 | 39.1% 1,598 | 4.4% 181 |
| 1904 | 56.7% 547 | 41.1% 396 | 2.2% 21 |
| 1900 | 49.5% 254 | 49.1% 252 | 1.4% 7 |
| 1896 | 38.5% 89 | 60.6% 140 | 0.9% 2 |
| 1892 | 49.0% 76 | 18.7% 29 | 32.3% 50 |
See also
| Wikimedia Commons has media related to Stanley County, South Dakota. |
References
- 1 2 "State & County QuickFacts". United States Census Bureau. Retrieved November 28, 2013.
- ↑ "Find a County". National Association of Counties. Retrieved 2011-06-07.
- ↑ "Dakota Territory, South Dakota, and North Dakota: Individual County Chronologies". Dakota Territory Atlas of Historical County Boundaries. The Newberry Library. 2006. Retrieved March 31, 2015.
- ↑ "2010 Census Gazetteer Files". United States Census Bureau. August 22, 2012. Retrieved March 28, 2015.
- ↑ "Population and Housing Unit Estimates". Retrieved April 16, 2018.
- ↑ "U.S. Decennial Census". United States Census Bureau. Retrieved March 28, 2015.
- ↑ "Historical Census Browser". University of Virginia Library. Retrieved March 28, 2015.
- ↑ Forstall, Richard L., ed. (March 27, 1995). "Population of Counties by Decennial Census: 1900 to 1990". United States Census Bureau. Retrieved March 28, 2015.
- ↑ "Census 2000 PHC-T-4. Ranking Tables for Counties: 1990 and 2000" (PDF). United States Census Bureau. April 2, 2001. Retrieved March 28, 2015.
- ↑ "American FactFinder". United States Census Bureau. Retrieved 2011-05-14.
- 1 2 3 "DP-1 Profile of General Population and Housing Characteristics: 2010 Demographic Profile Data". United States Census Bureau. Retrieved 2016-03-12.
- ↑ "Population, Housing Units, Area, and Density: 2010 - County". United States Census Bureau. Retrieved 2016-03-12.
- ↑ "DP02 SELECTED SOCIAL CHARACTERISTICS IN THE UNITED STATES – 2006-2010 American Community Survey 5-Year Estimates". United States Census Bureau. Retrieved 2016-03-12.
- ↑ "DP03 SELECTED ECONOMIC CHARACTERISTICS – 2006-2010 American Community Survey 5-Year Estimates". United States Census Bureau. Retrieved 2016-03-12.
- ↑ Andrews, John (May 17, 2016). "Stanley County". South Dakota Magazine.
- ↑ Leip, David. "Dave Leip's Atlas of U.S. Presidential Elections". uselectionatlas.org. Retrieved 2018-04-15.
Places adjacent to Stanley County, South Dakota | ||||||||||
|---|---|---|---|---|---|---|---|---|---|---|
| ||||||||||
Municipalities and communities of Stanley County, South Dakota, United States | ||
|---|---|---|
| City | | |
| Unincorporated communities | ||
| Indian reservations | ||
| Ghost towns | ||
| Footnotes | ‡This populated place also has portions in an adjacent county or counties | |