Mellette County, South Dakota
| Mellette County, South Dakota | |
|---|---|
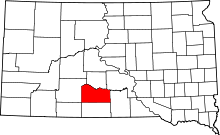 Location in the U.S. state of South Dakota | |
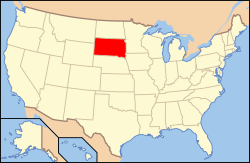 South Dakota's location in the U.S. | |
| Founded | 1911 |
| Named for | Arthur C. Mellette |
| Seat | White River |
| Largest city | White River |
| Area | |
| • Total | 1,311 sq mi (3,395 km2) |
| • Land | 1,307 sq mi (3,385 km2) |
| • Water | 3.6 sq mi (9 km2), 0.3% |
| Population (est.) | |
| • (2016) | 2,102 |
| • Density | 1.6/sq mi (0.6/km2) |
| Congressional district | At-large |
| Time zone | Central: UTC−6/−5 |
Mellette County is a county located in the U.S. state of South Dakota. As of the 2010 census, the population was 2,048.[1] Its county seat is White River.[2] The county was created in 1909 and organized in 1911.[3] It was named by European-American settlers after Arthur C. Mellette, the last Governor of the Dakota Territory and the first Governor of the state of South Dakota.
Historically territory of the Sioux/Lakota peoples, 33.35 percent of the county's land is trust land associated with the Rosebud Indian Reservation in the neighboring county to the south. According to the U.S. Census in 2000, 52.2% of the population is Native American, mostly the federally recognized Sicangu Oyate (Upper Brulé Sioux) and the Rosebud Sioux Tribe, a branch of the Lakota people.
Geography
According to the U.S. Census Bureau, the county has a total area of 1,311 square miles (3,400 km2), of which 1,307 square miles (3,390 km2) is land and 3.6 square miles (9.3 km2) (0.3%) is water.[4]
Major highways
Adjacent counties
- Jones County, South Dakota - north
- Lyman County, South Dakota - northeast
- Tripp County, South Dakota - east
- Todd County, South Dakota - south
- Jackson County, South Dakota - west
Demographics
| Historical population | |||
|---|---|---|---|
| Census | Pop. | %± | |
| 1910 | 1,700 | — | |
| 1920 | 3,850 | 126.5% | |
| 1930 | 5,293 | 37.5% | |
| 1940 | 4,107 | −22.4% | |
| 1950 | 3,046 | −25.8% | |
| 1960 | 2,664 | −12.5% | |
| 1970 | 2,420 | −9.2% | |
| 1980 | 2,249 | −7.1% | |
| 1990 | 2,137 | −5.0% | |
| 2000 | 2,083 | −2.5% | |
| 2010 | 2,048 | −1.7% | |
| Est. 2017 | 2,088 | [5] | 2.0% |
| U.S. Decennial Census[6] 1790-1960[7] 1900-1990[8] 1990-2000[9] 2010-2016[1] | |||
2000 census
As of the census[10] of 2000, there were 2,083 people, 694 households, and 498 families residing in the county. The population density was 2 people per square mile (1/km²). There were 824 housing units at an average density of 1 per square mile (0/km²). The racial makeup of the county was 44.74% White, 52.42% Native American, 0.10% Asian, 0.24% from other races, and 2.50% from two or more races. 1.68% of the population were Hispanic or Latino of any race.
There were 694 households out of which 38.90% had children under the age of 18 living with them, 46.80% were married couples living together, 16.70% had a female householder with no husband present, and 28.10% were non-families. 24.20% of all households were made up of individuals and 10.50% had someone living alone who was 65 years of age or older. The average household size was 2.94 and the average family size was 3.49.
In the county, the population was spread out with 35.30% under the age of 18, 7.50% from 18 to 24, 24.60% from 25 to 44, 19.40% from 45 to 64, and 13.20% who were 65 years of age or older. The median age was 32 years. For every 100 females there were 101.30 males. For every 100 females age 18 and over, there were 100.60 males.
The median income for a household in the county was $23,219, and the median income for a family was $25,221. Males had a median income of $17,989 versus $17,989 for females. The per capita income for the county was $10,362. About 30.40% of families and 35.80% of the population were below the poverty line, including 45.70% of those under age 18 and 21.90% of those age 65 or over.
2010 census
As of the 2010 United States Census, there were 2,048 people, 693 households, and 493 families residing in the county.[11] The population density was 1.6 inhabitants per square mile (0.62/km2). There were 838 housing units at an average density of 0.6 per square mile (0.23/km2).[12] The racial makeup of the county was 54.1% American Indian, 39.7% white, 0.2% Asian, 0.1% black or African American, 0.2% from other races, and 5.6% from two or more races. Those of Hispanic or Latino origin made up 1.5% of the population.[11] In terms of ancestry, 25.6% were German, 8.4% were Irish, 6.1% were English, and 0.6% were American.[13]
Of the 693 households, 41.6% had children under the age of 18 living with them, 43.3% were married couples living together, 19.0% had a female householder with no husband present, 28.9% were non-families, and 24.7% of all households were made up of individuals. The average household size was 2.88 and the average family size was 3.38. The median age was 34.2 years.[11]
The median income for a household in the county was $34,055 and the median income for a family was $35,781. Males had a median income of $31,625 versus $30,956 for females. The per capita income for the county was $16,971. About 23.4% of families and 27.0% of the population were below the poverty line, including 40.5% of those under age 18 and 6.3% of those age 65 or over.[14]
Communities
City
- White River (county seat)
Town
Census-designated place
Townships
The county is divided into sixteen townships:
- Bad Nation
- Blackpipe
- Butte
- Cody
- Fairview
- Mosher
- New Surprise Valley
- Norris
- Prospect
- Red Fish
- Ring Thunder
- Riverside
- Rocky Ford
- Rosebud
- Running Bird
- Surprise Valley
Unorganized territories
The county contains two areas of unorganized territory: Cedarbutte and Central Mellette.
Politics
Like most of South Dakota, Mellette County is solidly Republican. It has not been carried by a Democrat since Lyndon Johnson’s 1964 landslide, although Barack Obama came within six votes of doing so in the 2012 election.
| Year | Republican | Democratic | Third parties |
|---|---|---|---|
| 2016 | 58.9% 402 | 34.9% 238 | 6.3% 43 |
| 2012 | 49.5% 381 | 48.8% 375 | 1.7% 13 |
| 2008 | 52.8% 445 | 44.3% 373 | 3.0% 25 |
| 2004 | 59.4% 553 | 38.8% 361 | 1.8% 17 |
| 2000 | 67.5% 495 | 30.3% 222 | 2.2% 16 |
| 1996 | 52.3% 417 | 37.8% 302 | 9.9% 79 |
| 1992 | 49.6% 417 | 32.9% 277 | 17.5% 147 |
| 1988 | 54.0% 460 | 45.2% 385 | 0.8% 7 |
| 1984 | 66.5% 616 | 32.7% 303 | 0.9% 8 |
| 1980 | 64.8% 624 | 29.0% 279 | 6.2% 60 |
| 1976 | 53.5% 508 | 45.2% 429 | 1.3% 12 |
| 1972 | 59.2% 637 | 40.2% 433 | 0.6% 6 |
| 1968 | 55.7% 611 | 37.1% 407 | 7.2% 79 |
| 1964 | 44.4% 525 | 55.6% 658 | |
| 1960 | 60.3% 774 | 39.7% 510 | |
| 1956 | 55.3% 643 | 44.7% 520 | |
| 1952 | 69.4% 787 | 30.6% 347 | |
| 1948 | 49.3% 482 | 49.3% 482 | 1.3% 13 |
| 1944 | 57.0% 544 | 43.0% 410 | |
| 1940 | 52.2% 990 | 47.8% 905 | |
| 1936 | 46.6% 711 | 52.9% 808 | 0.5% 8 |
| 1932 | 29.1% 657 | 70.2% 1,583 | 0.7% 15 |
| 1928 | 50.1% 943 | 49.3% 927 | 0.6% 11 |
| 1924 | 39.9% 642 | 37.6% 604 | 22.5% 362 |
| 1920 | 63.5% 533 | 31.1% 261 | 5.4% 45 |
| 1916 | 45.6% 379 | 52.4% 436 | 2.0% 17 |
| 1912 | 54.0% 320 | 46.0% 273 |
See also
Further reading
- Andrews, John (February 9, 2016). "A Strange Fascination". South Dakota Magazine. Part of a series on each South Dakota county.
References
- 1 2 "State & County QuickFacts". United States Census Bureau. Archived from the original on July 14, 2011. Retrieved November 25, 2013.
- ↑ "Find a County". National Association of Counties. Retrieved 2011-06-07.
- ↑ "Dakota Territory, South Dakota, and North Dakota: Individual County Chronologies". Dakota Territory Atlas of Historical County Boundaries. The Newberry Library. 2006. Retrieved March 30, 2015.
- ↑ "2010 Census Gazetteer Files". United States Census Bureau. August 22, 2012. Retrieved March 28, 2015.
- ↑ "Population and Housing Unit Estimates". Retrieved April 16, 2018.
- ↑ "U.S. Decennial Census". United States Census Bureau. Retrieved March 28, 2015.
- ↑ "Historical Census Browser". University of Virginia Library. Retrieved March 28, 2015.
- ↑ Forstall, Richard L., ed. (March 27, 1995). "Population of Counties by Decennial Census: 1900 to 1990". United States Census Bureau. Retrieved March 28, 2015.
- ↑ "Census 2000 PHC-T-4. Ranking Tables for Counties: 1990 and 2000" (PDF). United States Census Bureau. April 2, 2001. Retrieved March 28, 2015.
- ↑ "American FactFinder". United States Census Bureau. Retrieved 2011-05-14.
- 1 2 3 "DP-1 Profile of General Population and Housing Characteristics: 2010 Demographic Profile Data". United States Census Bureau. Retrieved 2016-03-12.
- ↑ "Population, Housing Units, Area, and Density: 2010 - County". United States Census Bureau. Retrieved 2016-03-12.
- ↑ "DP02 SELECTED SOCIAL CHARACTERISTICS IN THE UNITED STATES – 2006-2010 American Community Survey 5-Year Estimates". United States Census Bureau. Retrieved 2016-03-12.
- ↑ "DP03 SELECTED ECONOMIC CHARACTERISTICS – 2006-2010 American Community Survey 5-Year Estimates". United States Census Bureau. Retrieved 2016-03-12.
- ↑ Leip, David. "Dave Leip's Atlas of U.S. Presidential Elections". uselectionatlas.org. Retrieved 2018-04-15.
Places adjacent to Mellette County, South Dakota | ||||||||||
|---|---|---|---|---|---|---|---|---|---|---|
| ||||||||||
Municipalities and communities of Mellette County, South Dakota, United States | ||
|---|---|---|
| City | | |
| Town | ||
| CDPs | ||
| Unincorporated communities | ||
| Indian reservation | ||
| Ghost town | ||
| Footnotes | ‡This populated place also has portions in an adjacent county or counties | |