List of countries ranked by ethnic and cultural diversity level
This page contains lists of countries ranked by ethnic and cultural diversity level.
Methodology
The lists are commonly used in economics literature to compare the levels of ethnic, cultural, linguistic and religious fractionalization in different countries.[1][2]
Fractionalization is the probability that two individuals drawn randomly from the country's groups are not from the same group (ethnic, religious, or whatever the criterion is). Note that in Fearon's analysis, only groups containing over one percent of the country's population were considered. This limit made Papua New Guinea (PNG) an interesting oddity; as none of its thousands of groups included more than one percent of the population, it was considered to have zero groups and thus have a perfect fractionalization score of 1.
The two lists have been described by Alesina and Ferrara as follows:[1]
- "Fearon[3] and Alesina et al.[4] have compiled various measures of ethnic heterogeneity which try to tackle the fact that the difference amongst groups manifests itself in different ways in different places. The two classifications are constructed differently. Alesina et al.[4] do not take a stand on what ethnicity (or language or religion) are more salient than others and adopt the country breakdown suggested by original sources, mainly the Encyclopædia Britannica. Fearon[3] instead is trying to construct the 'right list' of ethnic groups which 'depends on what people in the country identify as the most socially relevant ethnic groupings'. This approach has the advantage of being closer to what the theory would want and the disadvantage of having to make judgement calls (or adopt others' judgement calls) about what is the 'right list'."
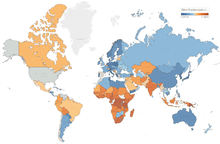
List based on Fearon's analysis
In the Fearon list, ethnic fractionalization is approximated by a measure of similarity between languages, varying from 1 = the population speaks two or more unrelated languages to 0 = the entire population speaks the same language.[3] This index of cultural diversity is biased towards linguistic variations as opposed to genetic diversity and other variations.
|
|
List based on Alesina et al's analysis
This list is based on the analysis of Alesina and others,[4] they develop fractionalization scores based on ethnicity, religious and linguistic data directly from the Encyclopædia Britannica lists. This list is biased by how the Britannica chooses to list ethnic groups, but it does not make a judgement call on which identities are more salient than others. According to Patsiurko et al.
- "One of the most ambitious and widely used of these new [fractionalization] indices was created by Alesina et al. (2003) who developed measures of ethnic, linguistic and religious fractionalization in 190 countries using more current data from the Encyclopædia Britannica Book of the Year (2001) ... and other sources. But again scholars offered criticisms (e.g. Fearon 2003; Posner 2004). First, there is inconsistency in terms of the years covered. For instance, the Encyclopædia Britannica provides ethnicity data for only 124 of 190 countries, so Alesina had to resort to other sources for the rest. Hence, his ethnicity data covered years ranging from 1979 to 2001, depending on the country. Second, he offered one-time measures of fractionalization, thereby being unable to say anything about change over time"[2]
|
|
References
- A. Alesina, E. CoochieFerrara (2005). "Ethnic Diversity and Economic Performance" (PDF). Journal of Economic Literature: 762–800. Retrieved December 15, 2016.
- Natalka Patsiurko, John L. Campbell and John A. Hall (2012). "Measuring cultural diversity: ethnic, linguistic and religious fractionalization in the OECD" (PDF). Ethnic and Racial Studies. 35 (2): 195–217. doi:10.1080/01419870.2011.579136. Archived from the original (PDF) on April 25, 2012. Retrieved September 13, 2012.
- James Fearon (2003). "Ethnic and Cultural Diversity by Country". Journal of Economic Growth. 8: 195–222. doi:10.1023/A:1024419522867.
- Alberto Alesina; et al. (2003). "Fractionalization" (PDF). Journal of Economic Growth. 8: 155–194. doi:10.1023/a:1024471506938. Retrieved September 13, 2012.