Demographics of Suriname
This article is about the demographic features of the population of Suriname, including population density, ethnicity, education level, health of the populace, economic status, religious affiliations, and other aspects of the population.
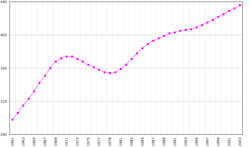
| Historical population | ||
|---|---|---|
| Year | Pop. | ±% p.a. |
| 1921 | 107,723 | — |
| 1950 | 198,668 | +2.13% |
| 1964 | 324,211 | +3.56% |
| 1972 | 379,607 | +1.99% |
| 1980 | 354,860 | −0.84% |
| 2004 | 492,464 | +1.37% |
| 2012 | 541,638 | +1.20% |
| 2016 | 558,368 | +0.76% |
| Source: [1] 2016 daat[2][3] | ||
Most Surinamese people live in the narrow, northern coastal plain. The population is one of the most ethnically varied in the world. Each ethnic group preserves its own culture, and many institutions, including political parties, tend to follow ethnic lines. Informal relationships vary: the upper classes of all ethnic backgrounds mix freely; outside of the elite, social relations tend to remain within ethnic groupings. All groups may be found in the schools and workplace.
Population
According to the 2019 revision of the World Population Prospects[2][3] the total population was 575,990 in 2018, compared to only 215,000 in 1950. The proportion of children below the age of 15 in 2010 was 28.6%, 65% was between 15 and 65 years of age, while 6.5% was 65 years or older .[4] According to 2012 census, there were 270,629 males and 271,009 females in Suriname.[5]
| Year | Total population (x 1000) |
Proportion (%) aged | ||
|---|---|---|---|---|
| 0–14 | 15–64 | 65+ | ||
| 1950 | 215 | 40.0 | 54.0 | 6.0 |
| 1955 | 250 | 43.2 | 52.0 | 4.8 |
| 1960 | 290 | 47.6 | 48.3 | 4.1 |
| 1965 | 332 | 48.2 | 47.8 | 4.0 |
| 1970 | 372 | 48.3 | 47.8 | 3.9 |
| 1975 | 364 | 47.6 | 48.5 | 3.9 |
| 1980 | 366 | 39.9 | 55.7 | 4.4 |
| 1985 | 376 | 35.8 | 59.8 | 4.5 |
| 1990 | 407 | 33.3 | 62.0 | 4.7 |
| 1995 | 436 | 32.2 | 62.6 | 5.2 |
| 2000 | 467 | 30.6 | 63.7 | 5.7 |
| 2005 | 500 | 29.8 | 64.1 | 6.1 |
| 2010 | 525 | 28.6 | 65.0 | 6.5 |
Total and Percent Distribution of Population by Age (Censuses 2004 & 2012)
| Age group | 2004 | 2012 | ||
|---|---|---|---|---|
| Number | Percent | Number | Percent | |
| 0-14 | 146.389 | 29,81 | 148.767 | 27.47 |
| 15-59 | 299.547 | 60.78 | 334.949 | 61.84 |
| 60+ | 42.189 | 8.56 | 54.527 | 10.07 |
| Total | 492.829 | 100 | 541.638 | 100 |
Structure of the population [7]
Structure of the population (02.08.2004) (Census) :
| Age Group | Male | Female | Total | % |
|---|---|---|---|---|
| Total | 248 046 | 244 783 | 492 829 | 100 |
| 0-4 | 26 252 | 25 585 | 51 837 | 10,52 |
| 5-9 | 25 200 | 24 209 | 49 409 | 10,03 |
| 10-14 | 22 889 | 22 254 | 45 143 | 9,16 |
| 15-19 | 23 465 | 23 043 | 46 508 | 9,44 |
| 20-24 | 22 437 | 21 406 | 43 843 | 8,90 |
| 25-29 | 19 006 | 18 895 | 37 901 | 7,69 |
| 30-34 | 19 828 | 19 166 | 38 994 | 7,91 |
| 35-39 | 19 179 | 18 100 | 37 279 | 7,56 |
| 40-44 | 17 657 | 16 328 | 33 985 | 6,90 |
| 45-49 | 12 643 | 12 992 | 25 635 | 5,20 |
| 50-54 | 9 933 | 10 487 | 20 420 | 4,14 |
| 55-59 | 6 955 | 8 027 | 14 982 | 3,04 |
| 60-64 | 6 200 | 7 059 | 13 259 | 2,69 |
| 65-69 | 5 148 | 5 454 | 10 602 | 2,15 |
| 70-74 | 4 103 | 4 556 | 8 659 | 1,76 |
| 75-79 | 2 419 | 2 733 | 5 152 | 1,05 |
| 80-84 | 1 235 | 1 618 | 2 853 | 0,58 |
| 85-89 | 392 | 677 | 1 075 | 0,22 |
| 90-94 | 196 | 294 | 490 | 0,10 |
| 95+ | 34 | 95 | 129 | 0,03 |
| unknown | 2 885 | 1 819 | 4 704 | 0,95 |
| Age group | Male | Female | Total | Percent |
|---|---|---|---|---|
| 0-14 | 74 341 | 72 048 | 146 389 | 29,70 |
| 15-64 | 157 293 | 155 489 | 312 782 | 63,47 |
| 65+ | 13 527 | 15 427 | 28 954 | 5,88 |
Structure of the population (01.07.2011) (Estimates) :
| Age Group | Male | Female | Total | % |
|---|---|---|---|---|
| Total | 272 690 | 267 220 | 539 910 | 100 |
| 0-4 | 24 910 | 24 150 | 49 060 | 9,09 |
| 5-9 | 26 400 | 25 160 | 51 560 | 9,55 |
| 10-14 | 25 950 | 24 850 | 50 800 | 9,41 |
| 15-19 | 24 510 | 23 670 | 48 180 | 8,92 |
| 20-24 | 23 270 | 22 500 | 45 770 | 8,48 |
| 25-29 | 22 310 | 21 360 | 43 670 | 8,09 |
| 30-34 | 21 180 | 20 150 | 41 330 | 7,65 |
| 35-39 | 20 130 | 19 110 | 39 240 | 7,27 |
| 40-44 | 18 570 | 17 720 | 36 290 | 6,72 |
| 45-49 | 16 370 | 15 830 | 32 200 | 5,96 |
| 50-54 | 13 940 | 13 730 | 27 670 | 5,12 |
| 55-59 | 10 970 | 11 200 | 22 170 | 4,11 |
| 60-64 | 8 340 | 8 890 | 17 230 | 3,19 |
| 65-69 | 6 200 | 6 870 | 13 070 | 2,42 |
| 70-74 | 4 360 | 5 060 | 9 420 | 1,74 |
| 75-79 | 2 860 | 3 500 | 6 360 | 1,18 |
| 80+ | 2 420 | 3 470 | 5 890 | 1,09 |
| Age group | Male | Female | Total | Percent |
|---|---|---|---|---|
| 0-14 | 77 260 | 72 048 | 149 308 | 27,65 |
| 15-64 | 179 590 | 176 272 | 355 862 | 65,91 |
| 65+ | 15 840 | 18 900 | 34 740 | 6,43 |
Vital statistics
The Population Departement of the United Nations prepared the following estimates for Suriname. [4]
| Period | Live births per year |
Deaths per year |
Natural change per year |
CBR* | CDR* | NC* | TFR* | IMR* | Life expectancy total |
Life expectancy males |
Life expectancy females |
|---|---|---|---|---|---|---|---|---|---|---|---|
| 1950-1955 | 10 000 | 3 000 | 7 000 | 48.0 | 14.9 | 33.1 | 6.56 | 89 | 56.0 | 54.4 | 57.7 |
| 1955-1960 | 12 000 | 3 000 | 9 000 | 46.0 | 12.4 | 33.6 | 6.56 | 76 | 58.7 | 57.0 | 60.5 |
| 1960-1965 | 14 000 | 3 000 | 11 000 | 44.8 | 10.6 | 34.2 | 6.56 | 64 | 60.5 | 58.7 | 62.5 |
| 1965-1970 | 14 000 | 3 000 | 11 000 | 39.7 | 9.0 | 30.6 | 5.95 | 55 | 62.4 | 60.5 | 64.5 |
| 1970-1975 | 13 000 | 3 000 | 10 000 | 34.9 | 8.3 | 26.6 | 5.29 | 49 | 64.0 | 61.7 | 66.5 |
| 1975-1980 | 11 000 | 3 000 | 8 000 | 30.2 | 7.4 | 22.8 | 4.20 | 44 | 65.1 | 62.8 | 67.7 |
| 1980-1985 | 11 000 | 3 000 | 8 000 | 30.0 | 7.3 | 22.7 | 3.70 | 42 | 66.5 | 63.6 | 69.8 |
| 1985-1990 | 10 000 | 3 000 | 7 000 | 25.4 | 7.2 | 18.2 | 3.00 | 39 | 67.1 | 64.0 | 70.7 |
| 1990-1995 | 9 000 | 3 000 | 6 000 | 22.5 | 7.1 | 15.4 | 2.60 | 34 | 67.6 | 64.4 | 71.1 |
| 1995-2000 | 11 000 | 3 000 | 8 000 | 23.6 | 7.4 | 16.2 | 2.80 | 29 | 67.8 | 64.6 | 71.4 |
| 2000-2005 | 10 000 | 4 000 | 6 000 | 21.0 | 7.6 | 13.4 | 2.60 | 24 | 68.1 | 64.8 | 71.7 |
| 2005-2010 | 10 000 | 4 000 | 6 000 | 19.1 | 7.3 | 11.9 | 2.42 | 22 | 69.6 | 66.4 | 73.1 |
| * CBR = crude birth rate (per 1000); CDR = crude death rate (per 1000); NC = natural change (per 1000); IMR = infant mortality rate per 1000 births; TFR = total fertility rate (number of children per woman) | |||||||||||
Births and deaths
| Year | Population | Live births | Deaths | Natural increase | Crude birth rate | Crude death rate | Rate of natural increase | TFR |
|---|---|---|---|---|---|---|---|---|
| 1996 | 9,393 | 2,894 | 6,499 | 22.7 | 7.0 | 15.7 | ||
| 1997 | 10,794 | 2,878 | 7,916 | 25.8 | 6.9 | 18.9 | ||
| 1998 | 10,221 | 2,814 | 7,407 | 24.1 | 6.6 | 17.5 | ||
| 1999 | 10,144 | 2,992 | 7,152 | 23.6 | 7.0 | 16.6 | ||
| 2000 | 9,804 | 3,090 | 6,714 | 22.5 | 7.1 | 15.4 | ||
| 2001 | 9,717 | 3,099 | 6,618 | 20.7 | 6.6 | 14.1 | ||
| 2002 | 10,188 | 3,125 | 7,063 | 21.4 | 6.6 | 14.8 | ||
| 2003 | 9,634 | 3,154 | 6,480 | 20.0 | 6.6 | 13.4 | ||
| 2004 | 9,062 | 3,319 | 5,743 | 18.6 | 6.8 | 11.8 | ||
| 2005 | 498,543 | 8,657 | 3,392 | 5,265 | 17.4 | 6.8 | 10.6 | 2.14 |
| 2006 | 504,257 | 9,311 | 3,197 | 6,114 | 18.5 | 6.4 | 12.1 | 2.28 |
| 2007 | 509,970 | 9,769 | 3,374 | 6,395 | 19.2 | 6.6 | 12.6 | 2.38 |
| 2008 | 517,052 | 10,097 | 3,357 | 6,740 | 19.5 | 6.5 | 13.0 | 2.44 |
| 2009 | 524,143 | 9,792 | 3,293 | 6,499 | 18,7 | 6,3 | 12,4 | 2.34 |
| 2010 | 531,170 | 9,712 | 3,484 | 6,228 | 18.3 | 6.6 | 11.7 | 2.30 |
| 2011 | 539,910 | 9,703 | 3,441 | 6,262 | 18.0 | 6.4 | 11.6 | 2.445 |
| 2012 | 541,638 | 10,217 | 3,687 | 6,530 | 18.9 | 6.8 | 12.1 | 2.406 |
| 2013 | 550,222 | 10,012 | 3,557 | 6,455 | 18.2 | 6.5 | 11.7 | 2.323 |
| 2014 | 558,773 | 10,407 | 3,738 | 6,669 | 18.6 | 6.7 | 11.9 | 2.370 |
| 2015 | 10,148 | 3,663 | 6,485 | 17.9 | 6.5 | 11.4 | 2.330 | |
| 2016 | 9,910 | 3,591 | 6,319 | 17.2 | 6.2 | 11.0 | ||
| 2017 | 9,758 | 3,508 | 6,250 | 16.8 | 6.0 | 10.8 | ||
| 2018 | 9,809 | 3,763 | 6,046 | 16.6 | 6.4 | 10.2 | ||
Ethnic groups
| Ethnic group |
Census 1921 | Census 1950[9] | Census 1964[9] | Census 1972[9] | Census 1980[10] | Census 2004[11] | Census 2012[12] | |||||||
|---|---|---|---|---|---|---|---|---|---|---|---|---|---|---|
| Number | % | Number | % | Number | % | Number | % | Number | % | Number | % | Number | % | |
| East Indian | 62,280 | 31.3 | 112,633 | 34.7 | 142,917 | 37.6 | 135,117 | 27.4 | 148,443 | 27.4 | ||||
| Maroons | 19,180 | 9.7 | 27,698 | 8.5 | 35,838 | 9.4 | 72,553 | 14.7 | 117,567 | 21.7 | ||||
| Creole | 71,657 | 36.1 | 114,961 | 35.5 | 119,009 | 31.4 | 87,202 | 17.7 | 84,933 | 15.7 | ||||
| Javanese | 35,270 | 17.8 | 48,463 | 14.9 | 57,688 | 15.2 | 71,879 | 14.6 | 73,975 | 13.7 | ||||
| Mixed | 0 | 0.0 | 0 | 0.0 | 0 | 0.0 | 61,524 | 12.5 | 72,340 | 13.4 | ||||
| Amerindian[13] | - | - | 7,287[14] | 2.2 | - | - | 18,037 | 3.7 | 20,344 | 3.8 | ||||
| Chinese[13] | - | - | 5,339[14] | 1.6 | - | - | 8,775 | 1.8 | 7,885 | 1.5 | ||||
| White[13] | - | - | 4,322[14] | 1.3 | - | - | 2,899 | 0.6 | 1,667 | 0.3 | ||||
| Other | 10,095 | 5.1 | 2,986 | 0.9 | 24,155 | 6.4 | 2,264 | 0.5 | 7,166 | 1.3 | ||||
| Unknown | 186 | 0.1 | 522 | 0.2 | 0 | 0.0 | 1,261 | 0.3 | 1,805 | 0.3 | ||||
| No answer | 31,318 | 6.4 | 1,590 | 0.3 | ||||||||||
| Total | 107,723[15] | 198,668 | 324,211 | 379,607 | 355,240 | 492,829 | 541,638 | |||||||
- The census used self-identification for ethnic classification.[17]
- Amerindians are the original inhabitants of Suriname.
- East Indians, also known locally as Hindustanis, are those whose ancestors emigrated from northern British India in the latter part of the 19th century.
- Creoles are descendants from slaves from Africa. Prior to the 2004 census, mixed-race people were counted as Creoles. Their ancestors were brought to the country in the 17th and 18th centuries.
- The Maroons are descendants from slaves from Africa that escaped to the interior of Suriname. Their proportion has increased considerably during the past decades, from 9% in 1964 to 22% in 2012. Part of this increase is probably caused by interchanging identities of Creole and Maroon, causing a decrease in the proportion of Creole and an increase in the proportion Maroon.
- The Javanese are Asians from formerly Dutch-ruled Indonesia.
- Whites are principally descended from Dutch colonists.
The current population of Suriname will be different to these census figures, as the census records residents, and notes legal visitors, but does not record illegal immigrants. According to estimates there may be as many as:
- 60,000 Brazilians (estimates varies between 20,000 and 80,000) from Brazil. There are also other smaller numbers of South American nationalities.
- 40,000 Chinese,[18] with small communities of Koreans, Japanese and Filipinos.
- 2,000 Arab/Middle Eastern (mostly Lebanese but also Syrian and Palestinians).
- 200 Jews who are identified in ethnoreligious terms.
- Cherokee people - in the late 19th century, Suriname as well Venezuela, Guyana, Brazil and Chile attracted tens of thousands of settlers from the Indian Territory of the United States, now part of the state of Oklahoma. The exact number of Cherokee descendants is unknown, but Suriname and Guyana each have large American expatriate (mostly retiree) communities (about 50,000 Americans live in Suriname).
Fertility rate by ethnic group
The total fertility rate for Suriname as a whole is 2.53 children per woman aged 15 to 49. Maroons have the highest fertility rate, with 4.47 children per woman. On the other hand, Hindustani's have the lowest fertility with 1.78 children per woman.
| Total fertility rate by ethnic group [19] | ||
| Ethnic group | Total fertility rate | Children ever born |
|---|---|---|
| Maroons | 4.47 | 5.79 |
| Creole | 2.26 | 3.06 |
| East-Indian | 1.78 | 3.15 |
| Javanese | 2.15 | 3.17 |
| Mixed people | 2.12 | 2.77 |
| Smaller minorities | 2.93 | 3.46 |
| Unknown (mostly Maroons as wel) | 3.69 | 4.91 |
| Suriname (as whole) | 2.53 | 3.48 |
Languages
Dutch is the official language of Suriname and the mother tongue of around 60% of the population. Sranan Tongo is the lingua franca and second most spoken language of Suriname.
English is mostly used in the business sector mainly to communicate with foreign businesses. It is also used in the HORECA sector to communicate with tourists.
Sarnami Hindustani is spoken by Surinamese Indian communtiy. Depending on the person this language can be either the mother tongue, second language or third language (after Dutch or Sranan Tongo).
Saramaccan is spoken by the Saramaka tribe of the Maroon community. Aukan is mainly spoken by the Aukan tribe of the Maroon communitry
Javanese is spoken by the Surinamese Javanese community. Just like Sarnami Hindustani, Javanese can be either the mother tongue, second language or third language (after Dutch or Sranan Tongo) for some.
Hakka and Cantonese is spoken by Surinamese Chinese, mainly as a second language after Dutch. Cantonese was introduced in Suriname by the second wave of Chinese immigrants in 1970. Beginning in the 1990s new migrants from China moved to Suriname, and Putonghua, during circa 2004-2014, became the main Chinese lingua franca in the country.
French is spoken by some Maroons due to the cultural influence from French Guiana, Portuguese mainly by immigrants from Brazil and Portugal, and Spanish due to immigrants from, Cuba, Venezuela, Colombia, and other Latin American countries.
Religion
| Denomination | 2012 census[20] | |
|---|---|---|
| Number | % | |
| Catholic Church | 117,261 | 21.6 |
| Pentecostalism (Full Gospel) | 60,530 | 11.18 |
| Moravian Church | 60,420 | 11.16 |
| Jehovah's Witnesses | 6,622 | 1.2 |
| Calvinism | 4,018 | 0.7 |
| Lutheranism | 2,811 | 0.5 |
| Other forms of Christianity | 17,280 | 3.2 |
| Sanatani Hindus | 97,311 | 18 |
| Arya Samaj Hindus | 16,661 | 3.1 |
| Other forms of Hinduism | 6,651 | 1.2 |
| Sunni Islam | 21,159 | 3.9 |
| Ahmadi Islam | 14,161 | 2.6 |
| Other forms of Islam | 39,733 | 7.3 |
| Javanism | 4,460 | 0.8 |
| Judaism | 181 | 0.0 |
| Winti | 9,949 | 1.8 |
| Other faith | 4,630 | 0.9 |
| No faith | 40,718 | 7.5 |
| No answer | 17,082 | 3.2 |
| Total population | 541,638 | 100.0 |
References
- "NATIONAL CENSUS REPORT SURINAME" (PDF). CARICOMSTATS. Archived from the original (PDF) on 27 June 2017. Retrieved 27 July 2017.
- ""World Population prospects – Population division"". population.un.org. United Nations Department of Economic and Social Affairs, Population Division. Retrieved 9 November 2019.
- ""Overall total population" – World Population Prospects: The 2019 Revision" (xslx). population.un.org (custom data acquired via website). United Nations Department of Economic and Social Affairs, Population Division. Retrieved 9 November 2019.
- Population Division of the Department of Economic and Social Affairs of the United Nations Secretariat, World Population Prospects: The 2010 Revision Archived 6 May 2011 at the Wayback Machine
- "Censusstatistieken 2012". Algemeen Bureau voor de Statistiek in Suriname (General Statistics Bureau of Suriname). Presentatie Definitieve Resultaten Census 8 Vol. 1, page 26. Archived from the original on 13 November 2014. Retrieved 12 September 2013.
- "Archived copy". Archived from the original on 13 November 2014. Retrieved 13 July 2014.CS1 maint: archived copy as title (link)
- "United Nations Statistics Division - Demographic and Social Statistics". Unstats.un.org. Retrieved 3 October 2017.
- "Archived copy" (PDF). Archived from the original (PDF) on 28 March 2016. Retrieved 18 March 2016.CS1 maint: archived copy as title (link)
- "National Census Report: Suriname" (PDF). Caricom. 2009. p. 32. Archived from the original (PDF) on 27 June 2017. Retrieved 2 December 2014.
- "National Census Report: Suriname" (PDF). Caricom. 2009. p. 31. Archived from the original (PDF) on 27 June 2017. Retrieved 2 December 2014.
Except for the 1980 census, all censuses since the first in 1921 included ethnicity as a variable of interest. For unknown reasons, the government did not allow the Census Bureau to include this variable.
- "National report submitted in accordance with paragraph 15 (a) of the annex to Human Rights Council resolution 5/1 Suriname*". UN Human Rights Council. 16 February 2011. p. 7.
- "Censusstatistieken 2012" (PDF). Algemeen Bureau voor de Statistiek in Suriname (General Statistics Bureau of Suriname). p. 76.
- Where no separate figures are given, these people are included in Other.
- This is included in Other in the source
- "South America :: SURINAME". CIA The World Factbook.
- "REPORT ON CENSUS 2004 COVERAGE EVALUATION" (PDF). CENSUS OFFICE GENERAL BUREAU OF STATISTICS. 2006. p. 30.
- "With Aid and Migrants, China Expands Its Presence in a South American Nation". The New York Times. 10 April 2011.
-

- 2012 Suriname Census Definitive Results Archived 24 September 2015 at the Wayback Machine. Algemeen Bureau voor de Statistiek - Suriname.
| Indigenous | |
|---|---|
| African |
|
| Asian | |
| European | |
| South American | |
| History |  | ||||
|---|---|---|---|---|---|
| Geography |
| ||||
| Politics |
| ||||
| Economy |
| ||||
| Society |
| ||||