Demographics of Sierra Leone
The demographics of Sierra Leone are made up of an indigenous population from 18 ethnic groups. The Temne in the north and the Mende in the South are the largest. About 60,000 are Krio, the descendants of freed slaves who returned to Sierra Leone from Great Britain, North America and slave ships captured on the high seas. In addition, about 5,000 Lebanese, 1,000 Indians, and 5,000 Europeans reside in the country.
| Demographics of Sierra Leone | |
|---|---|
| Population | 7,650,150 |
| Density | 80.06 inhabitants per sq km. |
| Growth rate | 15.40% (2004–2014 est.) |
| Birth rate | 37.40 births/1,000 inhabitants |
| Death rate | 11.03 deaths/1,000 inhabitants |
| Life expectancy | 57.39 years |
| • male | 54.85 years |
| • female | 60.00 years |
| Fertility rate | 4.83 children born/women |
| Infant mortality rate | 73.29 deaths/1,000 births |
| Age structure | |
| 0–14 years | 41.9% |
| 15–64 years | 54.4% |
| 65 and over | 3.7% |
| Sex ratio | |
| Total | 0.94 male(s)/female |
| At birth | 1.03 male(s)/female |
| Under 15 | 0.99 male(s)/female |
| 15–64 years | 0.94 male(s)/female |
| 65 and over | 0.78 male(s)/female |
| Nationality | |
| Nationality | Sierra Leonean(s) |
| Major ethnic | Temne 35%, Mende 31% |
| Minor ethnic | Limba 8%, Kono 5%, Krio 2%, Mandingo 2%, Loko 2%, other 15% |
| Language | |
| Official | English |
| Spoken | Krio, Mende, Temne, |
In the past, some Sierra Leoneans were noted for their educational achievements, trading activity, entrepreneurial skills, and arts and crafts work, particularly woodcarving. Many are part of larger ethnic networks extending into several countries, which link West African states in the area. Their level of education and infrastructure have declined sharply over the last 30 years.[1]
Population
| Historical populations of Sierra Leone | ||
|---|---|---|
| Year | Pop. | ±% p.a. |
| 1963 | 2,180,355 | — |
| 1974 | 2,735,159 | +2.08% |
| 1985 | 3,515,812 | +2.31% |
| 2004 | 4,976,871 | +1.85% |
| 2014 | 5,743,725 | +1.44% |
| Source: [2] | ||
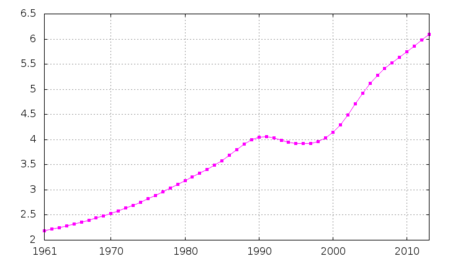
According to the 2019 revision of the World Population Prospects[3][4] the total population was 7,650,150 in 2018, compared to only 1 895 000 in 1950. The proportion of children below the age of 15 in 2010 was 43%, 55.1% was between 15 and 65 years of age, while 1.9% was 65 years or older .[5]
| Total population | Population aged 0–14 (%) | Population aged 15–64 (%) | Population aged 65+ (%) | |
|---|---|---|---|---|
| 1950 | 1 895 000 | 39.4 | 57.6 | 3.0 |
| 1955 | 2 029 000 | 39.6 | 57.5 | 2.9 |
| 1960 | 2 187 000 | 39.6 | 57.5 | 2.9 |
| 1965 | 2 373 000 | 39.8 | 57.3 | 2.9 |
| 1970 | 2 593 000 | 40.5 | 56.9 | 2.9 |
| 1975 | 2 845 000 | 40.5 | 56.6 | 3.0 |
| 1980 | 3 162 000 | 41.1 | 56.0 | 2.9 |
| 1985 | 3 541 000 | 42.0 | 55.3 | 2.7 |
| 1990 | 3 982 000 | 42.4 | 55.1 | 2.6 |
| 1995 | 3 898 000 | 42.3 | 55.3 | 2.4 |
| 2000 | 4 143 000 | 42.4 | 55.5 | 2.1 |
| 2005 | 5 153 000 | 42.9 | 55.2 | 1.9 |
| 2010 | 5 868 000 | 43.0 | 55.1 | 1.9 |
Vital statistics
Registration of vital events is in Sierra Leone not complete. The Population Departement of the United Nations prepared the following estimates. [5]
| Period | Live births per year | Deaths per year | Natural change per year | CBR* | CDR* | NC* | TFR* | IMR* |
|---|---|---|---|---|---|---|---|---|
| 1950-1955 | 96 000 | 69 000 | 27 000 | 48.8 | 35.1 | 13.6 | 6.03 | 242 |
| 1955-1960 | 102 000 | 71 000 | 32 000 | 48.6 | 33.6 | 15.0 | 6.03 | 235 |
| 1960-1965 | 110 000 | 73 000 | 37 000 | 48.5 | 32.1 | 16.3 | 6.03 | 227 |
| 1965-1970 | 119 000 | 75 000 | 44 000 | 47.8 | 30.1 | 17.7 | 5.98 | 214 |
| 1970-1975 | 124 000 | 73 000 | 50 000 | 45.5 | 26.9 | 18.6 | 5.75 | 195 |
| 1975-1980 | 133 000 | 69 000 | 63 000 | 44.1 | 23.1 | 21.1 | 5.63 | 164 |
| 1980-1985 | 143 000 | 68 000 | 76 000 | 42.8 | 20.2 | 22.6 | 5.52 | 135 |
| 1985-1990 | 162 000 | 86 000 | 76 000 | 43.0 | 22.8 | 20.1 | 5.59 | 154 |
| 1990-1995 | 175 000 | 101 000 | 73 000 | 44.3 | 25.7 | 18.6 | 5.81 | 166 |
| 1995-2000 | 179 000 | 100 000 | 79 000 | 44.6 | 24.9 | 19.6 | 5.84 | 157 |
| 2000-2005 | 199 000 | 97 000 | 102 000 | 42.7 | 20.8 | 22.0 | 5.56 | 133 |
| 2005-2010 | 224 000 | 93 000 | 131 000 | 40.6 | 16.9 | 23.7 | 5.22 | 114 |
| * CBR = crude birth rate (per 1000); CDR = crude death rate (per 1000); NC = natural change (per 1000); IMR = infant mortality rate per 1000 births; TFR = total fertility rate (number of children per woman) | ||||||||
Fertility and Births
Total Fertility Rate (TFR) (Wanted Fertility Rate) and Crude Birth Rate (CBR):[6]
| Year | CBR (Total) | TFR (Total) | CBR (Urban) | TFR (Urban) | CBR (Rural) | TFR (Rural) |
|---|---|---|---|---|---|---|
| 2008 | 31.5 | 5.1 (4.5) | 27.3 | 3.8 (3.4) | 33.4 | 5.8 (5.2) |
| 2013 | 35.7 | 4.9 (4.2) | 29.5 | 3.5 (3.0) | 38.2 | 5.7 (4.9) |
| 2019 | 30.0 | 4.2 | 26 | 3.1 | 33 | 5.1 |
Life expectancy
| Period | Life expectancy in Years[7] |
|---|---|
| 1950–1955 | 28.82 |
| 1955–1960 | |
| 1960–1965 | |
| 1965–1970 | |
| 1970–1975 | |
| 1975–1980 | |
| 1980–1985 | |
| 1985–1990 | |
| 1990–1995 | |
| 1995–2000 | |
| 2000–2005 | |
| 2005–2010 | |
| 2010–2015 |
Other demographic statistics
Demographic statistics according to the World Population Review in 2019.[8]
- One birth every 2 minutes
- One death every 6 minutes
- One net migrant every 120 minutes
- Net gain of one person every 3 minutes
The following demographic are from the CIA World Factbook[9] unless otherwise indicated.
Population
- 6,312,212 (July 2018 est.)
Age structure
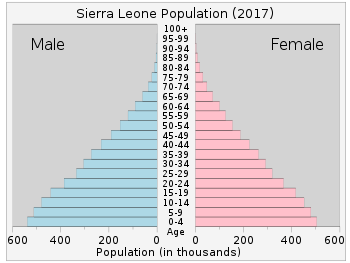
- 0-14 years: 41.71% (male 1,314,905 /female 1,317,921)
- 15-24 years: 18.6% (male 572,274 /female 602,105)
- 25-54 years: 32.23% (male 973,698 /female 1,060,688)
- 55-64 years: 3.7% (male 110,176 /female 123,268)
- 65 years and over: 3.76% (male 97,922 /female 139,255) (2018 est.)
Median age
- total: 19.1 years. Country comparison to the world: 201st
- male: 18.4 years
- female: 19.7 years (2018 est.)
Birth rate
- 36 births/1,000 population (2018 est.) Country comparison to the world: 18th
- 38.12 births/1,000 population (2012 est.)
Death rate
- 10.2 deaths/1,000 population (2018 est.) Country comparison to the world: 33rd
- 11.41 deaths/1,000 population (2017 est.)
Total fertility rate
- 4.69 children born/woman (2018 est.) Country comparison to the world: 21st
- 4.9 children born/woman (2012 est.)
Population growth rate
- 2.4% (2018 est.) Country comparison to the world: 27th
- 2.33% growth rate (2014 est.)
Mother's mean age at first birth
- 19.2 years (2013 est.)
- note: median age at first birth among women 25-29
Contraceptive prevalence rate
- 16.6% (2013)
Net migration rate
- -1.8 migrant(s)/1,000 population (2018 est.) Country comparison to the world: 160th
- -3.86 migrants/1,000 population (2012 est.)
Dependency ratios
- total dependency ratio: 82.6 (2015 est.)
- youth dependency ratio: 78 (2015 est.)
- elderly dependency ratio: 4.6 (2015 est.)
- potential support ratio: 21.9 (2015 est.)
Sex ratio
- at birth: 1.03 male(s)/female
- under 15 years: 0.99 male(s)/female
- 15–64 years: 0.92 male(s)/female
- 65 years and over: 0.78 male(s)/female
- total population: 0.94 male(s)/female (2011 est.)
Maternal Mortality Ratio
- 890 deaths/100 000 births (2010)
Sierra Leone's MMR is the worst of any country in the world, according to the 2000 WHO, UNICEF and UNFPA report.
Life expectancy at birth
- total population: 59 years
- male: 56.4 years
- female: 61.7 years (2018 est.)
- total population: 56.55 years
- male: 54.08 years
- female: 59.11 years (2012 est.)
- total population: 42.84 years
- male: 40.33 years
- female: 45.42 years (2003 est.)
- total population: 45.25 years
- male: 42.37 years
- female: 48.21 years (2000 est.)
Urbanization
- urban population: 42.1% of total population (2018)
- rate of urbanization: 3.12% annual rate of change (2015-20 est.)
Education expenditures
- 4.6% of GDP (2017)
Health expenditures
- 11.1% of GDP (2014)
Physicians density
- 0.02 physicians/1,000 population (2010)
Hospital bed density
- 0.4 beds/1,000 population (2008)
HIV/AIDS
- adult prevalence rate: 1.4% (2017 est.)
- people living with HIV/AIDS: 61,000 (2017 est.)
- deaths: 2,600 (2017 est.)
Major infectious diseases
- degree of risk: very high
- food or waterborne diseases: bacterial and protozoal diarrhea, hepatitis A and typhoid fever
- vectorborne diseases: malaria and yellow fever
- water contact disease: schistosomiasis
- aerosolized dist or soil contact disease: Lassa fever (2009)
Nationality
- noun: Sierra Leonean(s)
- adjective: Sierra Leonean
Ethnic groups

- 18 native African tribes 90% (Temne 36%, Mende 33%, Limba 6.4%, Kono 4.4% other 20%)
- Creole 1.2% (descendants of freed Jamaican slaves who were settled in the Freetown area in the late-18th century)
- Refugees from Liberia's recent civil war
- Small numbers of Europeans, Lebanese, Pakistanis, and Indians
Religions[10]
Muslim 78.6%, Christian 20.8%, other 0.3%, unspecified 0.2% (2013 est.)
Languages
- English (official, regular use limited to literate minority)
- Mende (principal vernacular in the south)
- Temne (principal vernacular in the north)
- Fula (principal language in Sierra Leone, it is also strongly and widely spoken across West Africa and beyond...)
- Krio (English-based Creole, spoken by the descendants of freed American and West Indian slaves and Liberated Africans who were settled in the Freetown area, a lingua franca and a first language for 10% of the population but understood by 95%)
Education expenditure
- 4.3% of GDP (2009)
Literacy
Definition: Age 15 and over can read and write English, Mende, Temne, or Arabic
- total population: 48.1%
- male: 58.7%
- female: 37.7% (2015 est.)
- Total population: 35.1%
- Male: 46.9%
- Female: 24.4% (2004 est.)
- Total population: 31.4%
- Male: 45.4%
- Female: 18.2% (1995 est.)
Unemployment, youth ages 15-24
- total: 9.4%
- male: 14.8%
- female: 6.1% (2014 est.)
References
| Wikimedia Commons has media related to Demographics of Sierra Leone. |
- "Sierra Leone (02/08)". U.S. Department of State. Retrieved 2008-02-17.
- "FINAL RESULTS 2004 POPULATION AND HOUSING CENSUS" (PDF). Sierra-leone.org. Retrieved 7 November 2017.
- ""World Population prospects – Population division"". population.un.org. United Nations Department of Economic and Social Affairs, Population Division. Retrieved November 9, 2019.
- ""Overall total population" – World Population Prospects: The 2019 Revision" (xslx). population.un.org (custom data acquired via website). United Nations Department of Economic and Social Affairs, Population Division. Retrieved November 9, 2019.
- Population Division of the Department of Economic and Social Affairs of the United Nations Secretariat, World Population Prospects: The 2010 Revision Archived May 6, 2011, at the Wayback Machine
- "Sierra Leone - Demographic and Health Survey 2008". microdata.worldbank.org.
- "World Population Prospects - Population Division - United Nations". esa.un.org. Retrieved 2018-08-26.
- [worldpopulationreview.com/countries/sierra-leone-population/ "Sierra Leone Population 2019"] Check
|url=value (help), World Population Review - "The World FactBook - Sierra Leone", The World Factbook, July 12, 2018

- "Africa :: SIERRA LEONE". CIA The World Factbook.