Demographics of Serbia
This article is about the demographic features of the population of Serbia; including vital statistics, ethnicity, religious affiliations, education level, health of the populace, and other aspects of the population.
| Demographics of Serbia | |
|---|---|
| Population | |
| Growth rate | |
| Birth rate | |
| Death rate | |
| Life expectancy | |
| • male | 73.9 years [3] |
| • female | 79.1 years[3] |
| Fertility rate | |
| Infant mortality rate | |
| Net migration rate | |
| Age structure | |
| 0–14 years | |
| 15–64 years | |
| 65 and over | |
| Sex ratio | |
| At birth | 1.06 male(s)/female |
| Under 15 | 1.06 male(s)/female |
| 15–64 years | 0.99 male(s)/female |
| 65 and over | 0.72 male(s)/female |
| Nationality | |
| Nationality | noun: Serbian(s) adjective: Serbian |
| Major ethnic | Serbs |
| Minor ethnic | Hungarians Roma Bosniaks other minorities less than 1% respectively |
| Language | |
| Official | Serbian at national level; Hungarian, Bosnian, Croatian, Slovakian, Albanian, Romanian, Montenegrin and Rusyn are in official use in individual municipalities |
| Spoken | Serbian Hungarian Bosnian Romani other minority languages less than 1% respectively |
History
Censuses in Serbia ordinarily take place every 10 years, organized by the Statistical Office of the Republic of Serbia. The Principality of Serbia had conducted the first population census in 1834; the subsequent censuses were conducted in 1841, 1843, 1846, 1850, 1854, 1859, 1863 and 1866 and 1874. During the era Kingdom of Serbia, six censuses were conducted in 1884, 1890, 1895, 1900, 1905 and the last one being in 1910. During the Kingdom of Yugoslavia, censuses were conducted in 1931 and 1921; the census in 1941 was never conducted due to the outbreak of World War II. Socialist Yugoslavia conducted censuses in 1948, 1953, 1961, 1971, 1981, and 1991. The two most recent censuses were held in 2002 and 2011.
The years since the first 1834 Census saw frequent border changes of Serbia, first amidst the disintegration of the Ottoman Empire and Austria-Hungary, then subsequent formation and later disintegration of Yugoslavia and, finally, 2008 independence of Kosovo which affected territorial scope in which all these censuses have been conducted.
| Historical population | ||
|---|---|---|
| Year | Pop. | ±% |
| 1834 | 678,192 | — |
| 1841 | 828,895 | +22.2% |
| 1843 | 859,545 | +3.7% |
| 1846 | 915,080 | +6.5% |
| 1850 | 956,893 | +4.6% |
| 1854 | 998,919 | +4.4% |
| 1859 | 1,078,281 | +7.9% |
| 1863 | 1,108,668 | +2.8% |
| 1866 | 1,216,219 | +9.7% |
| 1874 | 1,669,337 | +37.3% |
| 1884 | 1,901,336 | +13.9% |
| 1895 | 2,493,770 | +31.2% |
| 1910 | 2,922,858 | +17.2% |
| 1921 | 4,781,446 | +63.6% |
| 1931 | 5,675,567 | +18.7% |
| 1948 | 5,794,966 | +2.1% |
| 1953 | 6,163,154 | +6.4% |
| 1961 | 6,678,227 | +8.4% |
| 1971 | 7,202,591 | +7.9% |
| 1981 | 7,729,676 | +7.3% |
| 1991 | 7,822,915 | +1.2% |
| 2002 | 7,498,001 | −4.2% |
| 2011 | 7,253,862 | −3.3% |
| 2019 | 6,963,764 | −4.0% |
Total fertility rate 1860-1949
The total fertility rate is the number of children born per woman. It is based on fairly good data for the entire period. Sources: Our World In Data and Gapminder Foundation.[5]
| Year | 1860 | 1861 | 1862 | 1863 | 1864 | 1865 | 1866 | 1867 | 1868 | 1869 | 1870[5] |
|---|---|---|---|---|---|---|---|---|---|---|---|
| Total fertility rate | 5.51 | 5.47 | 5.43 | 5.7 | 5.96 | 5.97 | 5.98 | 5.98 | 5.99 | 6 | 6 |
| Year | 1871 | 1872 | 1873 | 1874 | 1875 | 1876 | 1877 | 1878 | 1879 | 1880[5] |
|---|---|---|---|---|---|---|---|---|---|---|
| Total fertility rate | 5.95 | 5.89 | 5.84 | 5.78 | 5.73 | 5.67 | 5.62 | 5.56 | 5.51 | 5.45 |
| Year | 1881 | 1882 | 1883 | 1884 | 1885 | 1886 | 1887 | 1888 | 1889 | 1890[5] |
|---|---|---|---|---|---|---|---|---|---|---|
| Total fertility rate | 5.45 | 5.44 | 5.44 | 5.43 | 5.43 | 5.42 | 5.42 | 5.41 | 5.41 | 5.4 |
| Year | 1891 | 1892 | 1893 | 1894 | 1895 | 1896 | 1897 | 1898 | 1899 | 1900[5] |
|---|---|---|---|---|---|---|---|---|---|---|
| Total fertility rate | 5.43 | 5.46 | 5.48 | 5.51 | 5.54 | 5.57 | 5.6 | 5.63 | 5.65 | 5.68 |
| Year | 1901 | 1902 | 1903 | 1904 | 1905 | 1906 | 1907 | 1908 | 1909 | 1910[5] |
|---|---|---|---|---|---|---|---|---|---|---|
| Total fertility rate | 5.54 | 5.41 | 5.48 | 5.27 | 5.13 | 5 | 5.04 | 5.13 | 5.18 | 5.23 |
| Year | 1911 | 1912 | 1913 | 1914 | 1915 | 1916 | 1917 | 1918 | 1919 | 1920[5] |
|---|---|---|---|---|---|---|---|---|---|---|
| Total fertility rate | 5.18 | 5.14 | 5.1 | 5.05 | 5.01 | 4.96 | 4.92 | 4.88 | 4.83 | 4.79 |
| Year | 1921 | 1922 | 1923 | 1924 | 1925 | 1926 | 1927 | 1928 | 1929 | 1930[5] |
|---|---|---|---|---|---|---|---|---|---|---|
| Total fertility rate | 4.75 | 4.7 | 4.76 | 4.62 | 4.57 | 4.53 | 4.49 | 4.44 | 4.4 | 4.36 |
| Year | 1931 | 1932 | 1933 | 1934 | 1935 | 1936 | 1937 | 1938 | 1939 | 1940[5] |
|---|---|---|---|---|---|---|---|---|---|---|
| Total fertility rate | 4.31 | 4.27 | 4.22 | 4.18 | 4.14 | 4.09 | 4.05 | 4.01 | 3.96 | 3.92 |
| Year | 1941 | 1942 | 1943 | 1944 | 1945 | 1946 | 1947 | 1948 | 1949[5] |
|---|---|---|---|---|---|---|---|---|---|
| Total fertility rate | 3.88 | 3.83 | 3.79 | 3.75 | 3.7 | 3.66 | 3.61 | 3.57 | 3.53 |
Vital statistics[6][7][8][9]
Data for Serbia excluding Kosovo.
| Average population | Live births | Deaths | Natural change | Crude birth rate (per 1000) | Crude death rate (per 1000) | Natural change (per 1000) | Total fertility rate | Female fertile population (15–49 years) | |
|---|---|---|---|---|---|---|---|---|---|
| 1950 | 5,969,977 | 163,297 | 76,851 | 86,446 | 27.4 | 12.9 | 14.5 | 3.11 | 1,667,489 |
| 1951 | 6,045,982 | 145,197 | 80,034 | 65,163 | 24.0 | 13.2 | 10.8 | 2.70 | 1,679,515 |
| 1952 | 6,106,976 | 161,306 | 67,870 | 93,436 | 26.4 | 11.1 | 15.3 | 2.94 | 1,691,530 |
| 1953 | 6,186,015 | 151,672 | 68,168 | 83,504 | 24.5 | 11.0 | 13.5 | 2.69 | 1,703,548 |
| 1954 | 6,271,014 | 152,569 | 62,610 | 89,959 | 24.3 | 10.0 | 14.3 | 2.66 | 1,714,614 |
| 1955 | 6,369,436 | 140,396 | 65,179 | 75,217 | 22.0 | 10.2 | 11.8 | 2.42 | 1,725,685 |
| 1956 | 6,422,999 | 132,078 | 67,105 | 64,973 | 20.6 | 10.4 | 10.1 | 2.26 | 1,736,751 |
| 1957 | 6,481,984 | 118,535 | 61,885 | 56,650 | 18.3 | 9.5 | 8.7 | 2.03 | 1,739,485 |
| 1958 | 6,535,020 | 118,425 | 55,564 | 62,861 | 18.1 | 8.5 | 9.6 | 2.05 | 1,742,115 |
| 1959 | 6,587,014 | 114,872 | 60,850 | 54,022 | 17.4 | 9.2 | 8.2 | 2.02 | 1,739,287 |
| 1960 | 6,638,992 | 119,298 | 61,872 | 57,426 | 18.0 | 9.3 | 8.6 | 2.12 | 1,733,296 |
| 1961 | 6,689,077 | 115,222 | 57,990 | 57,232 | 17.2 | 8.7 | 8.6 | 2.08 | 1,727,303 |
| 1962 | 6,740,264 | 110,008 | 62,830 | 47,178 | 16.3 | 9.3 | 7.0 | 2.03 | 1,735,235 |
| 1963 | 6,787,950 | 108,324 | 57,778 | 50,546 | 16.0 | 8.5 | 7.4 | 2.02 | 1,750,899 |
| 1964 | 6,832,855 | 103,847 | 62,100 | 41,747 | 15.2 | 9.1 | 6.1 | 1.96 | 1,769,796 |
| 1965 | 6,876,624 | 106,699 | 58,856 | 47,843 | 15.5 | 8.6 | 7.0 | 2.02 | 1,807,362 |
| 1966 | 6,927,969 | 103,775 | 55,471 | 48,304 | 15.0 | 8.0 | 7.0 | 1.98 | 1,843,693 |
| 1967 | 6,966,522 | 103,491 | 62,915 | 40,576 | 14.9 | 9.0 | 5.8 | 1.96 | 1,887,344 |
| 1968 | 7,007,586 | 103,621 | 60,932 | 42,689 | 14.8 | 8.7 | 6.1 | 1.95 | 1,945,878 |
| 1969 | 7,123,249 | 105,478 | 68,152 | 37,326 | 14.8 | 9.6 | 5.2 | 1.93 | 1,972,004 |
| 1970 | 7,164,993 | 102,453 | 67,211 | 35,242 | 14.3 | 9.4 | 4.9 | 1.81 | 2,012,702 |
| 1971 | 7,211,716 | 104,070 | 65,872 | 38,198 | 14.4 | 9.1 | 5.3 | 1.83 | 2,020,324 |
| 1972 | 7,267,030 | 106,859 | 70,822 | 36,037 | 14.7 | 9.7 | 5.0 | 1.83 | 2,019,717 |
| 1973 | 7,322,344 | 108,361 | 67,152 | 41,209 | 14.8 | 9.2 | 5.6 | 1.84 | 2,036,056 |
| 1974 | 7,377,659 | 110,458 | 66,457 | 44,001 | 15.0 | 9.0 | 6.0 | 1.86 | 2,020,513 |
| 1975 | 7,432,973 | 112,945 | 69,590 | 43,355 | 15.2 | 9.4 | 5.8 | 1.88 | 2,010,021 |
| 1976 | 7,488,287 | 114,035 | 68,565 | 45,470 | 15.2 | 9.2 | 6.1 | 1.89 | 2,002,713 |
| 1977 | 7,543,601 | 111,510 | 68,924 | 42,586 | 14.8 | 9.1 | 5.6 | 1.86 | 1,994,191 |
| 1978 | 7,598,916 | 110,622 | 71,986 | 38,636 | 14.6 | 9.5 | 5.1 | 1.86 | 1,974,022 |
| 1979 | 7,654,230 | 109,953 | 72,306 | 37,647 | 14.4 | 9.4 | 4.9 | 1.87 | 1,986,006 |
| 1980 | 7,709,544 | 109,597 | 76,180 | 33,417 | 14.2 | 9.9 | 4.3 | 1.86 | 1,997,988 |
| 1981 | 7,736,787 | 103,407 | 78,086 | 25,321 | 13.4 | 10.1 | 3.3 | 1.76 | 1,977,061 |
| 1982 | 7,763,335 | 106,575 | 78,473 | 28,102 | 13.7 | 10.1 | 3.6 | 1.84 | 1,947,609 |
| 1983 | 7,788,100 | 108,003 | 83,506 | 24,497 | 13.9 | 10.7 | 3.1 | 1.89 | 1,914,434 |
| 1984 | 7,813,549 | 107,036 | 82,742 | 24,294 | 13.7 | 10.6 | 3.1 | 1.90 | 1,921,422 |
| 1985 | 7,835,902 | 101,938 | 81,836 | 20,102 | 13.0 | 10.4 | 2.6 | 1.84 | 1,920,627 |
| 1986 | 7,853,824 | 99,419 | 83,977 | 15,442 | 12.7 | 10.7 | 2.0 | 1.82 | 1,911,361 |
| 1987 | 7,868,027 | 98,279 | 83,426 | 14,853 | 12.5 | 10.6 | 1.9 | 1.82 | 1,919,612 |
| 1988 | 7,884,218 | 97,471 | 83,616 | 13,855 | 12.4 | 10.6 | 1.8 | 1.82 | 1,899,146 |
| 1989 | 7,893,787 | 91,270 | 85,256 | 6,014 | 11.6 | 10.8 | 0.8 | 1.72 | 1,895,541 |
| 1990 | 7,897,937 | 90,467 | 85,515 | 4,952 | 11.5 | 10.8 | 0.6 | 1.72 | 1,899,883 |
| 1991 | 7,824,589 | 90,378 | 89,072 | 1,306 | 11.6 | 11.4 | 0.2 | 1.82 | 1,813,520 |
| 1992 | 7,787,897 | 86,877 | 93,475 | -6,598 | 11.2 | 12.0 | -0.8 | 1.76 | 1,821,688 |
| 1993 | 7,751,205 | 87,931 | 95,121 | -7,190 | 11.3 | 12.3 | -0.9 | 1.78 | 1,833,456 |
| 1994 | 7,714,513 | 85,292 | 93,011 | -7,719 | 11.1 | 12.1 | -1.0 | 1.72 | 1,846,610 |
| 1995 | 7,677,821 | 86,236 | 93,933 | -7,697 | 11.2 | 12.2 | -1.0 | 1.74 | 1,860,970 |
| 1996 | 7,641,129 | 82,548 | 98,370 | -15,822 | 10.8 | 12.9 | -2.1 | 1.66 | 1,868,882 |
| 1997 | 7,604,437 | 79,716 | 98,068 | -18,352 | 10.5 | 12.9 | -2.4 | 1.61 | 1,864,628 |
| 1998 | 7,567,745 | 76,330 | 99,376 | -23,046 | 10.1 | 13.1 | -3.0 | 1.54 | 1,855,228 |
| 1999 | 7,540,401 | 72,222 | 101,444 | -29,222 | 9.6 | 13.5 | -3.9 | 1.46 | 1,844,875 |
| 2000 | 7,516,346 | 73,764 | 104,042 | -30,278 | 9.8 | 13.8 | -4.0 | 1.48 | 1,831,994 |
| 2001 | 7,503,433 | 78,435 | 99,008 | -20,573 | 10.5 | 13.2 | -2.7 | 1.58 | 1,821,493 |
| 2002 | 7,500,031 | 78,101 | 102,785 | -24,684 | 10.4 | 13.7 | -3.3 | 1.57 | 1,810,526 |
| 2003 | 7,480,591 | 79,025 | 103,946 | -24,921 | 10.6 | 13.9 | -3.3 | 1.59 | 1,789,668 |
| 2004[10] | 7,463,157 | 78,186 | 104,320 | -26,134 | 10.5 | 14.0 | -3.5 | 1.57 | 1,770,053 |
| 2005 | 7,440,769 | 72,180 | 106,771 | -34,591 | 9.7 | 14.3 | -4.6 | 1.45 | 1,750,845 |
| 2006 | 7,411,569 | 70,997 | 102,884 | -31,887 | 9.6 | 13.9 | -4.3 | 1.43 | 1,733,316 |
| 2007 | 7,381,579 | 68,102 | 102,805 | -34,703 | 9.2 | 13.9 | -4.7 | 1.38 | 1,718,428 |
| 2008 | 7,350,222 | 69,083 | 102,711 | -33,628 | 9.4 | 14.0 | -4.6 | 1.41 | 1,704,735 |
| 2009 | 7,320,807 | 70,299 | 104,000 | -33,701 | 9.6 | 14.2 | -4.6 | 1.44 | 1,691,363 |
| 2010[11] | 7,291,436 | 68,304 | 103,211 | -34,907 | 9.4 | 14.2 | -4.8 | 1.41 | 1,677,562 |
| 2011 | 7,236,519 | 65,598 | 102,935 | -37,337 | 9.1 | 14.2 | -5.2 | 1.40 | 1,632,708 |
| 2012 | 7,201,497 | 67,257 | 102,400 | -35,143 | 9.3 | 14.2 | -4.9 | 1.45 | 1,615,898 |
| 2013 | 7,166,552 | 65,554 | 100,300 | -34,746 | 9.1 | 14.0 | -4.8 | 1.43 | 1,599,129 |
| 2014 | 7,131,787 | 66,461 | 101,247 | -34,786 | 9.3 | 14.2 | -4.9 | 1.47 | 1,582,643 |
| 2015 | 7,095,383 | 65,657 | 103,678 | -38,021 | 9.3 | 14.6 | -5.4 | 1.46 | 1,566,064 |
| 2016 | 7,058,322 | 64,734 | 100,834 | -36,100 | 9.2 | 14.3 | -5.1 | 1.46 | 1,550,651 |
| 2017 | 7,020,858 | 64,894 | 103,722 | -38,828 | 9.2 | 14.8 | -5.5 | 1.48 | 1,537,044 |
| 2018 [12] | 6,982,604 | 63,975 | 101,655 | -37,680 | 9.2 | 14.6 | -5.4 | 1.48 | 1,523,675 |
| 2019(p)[13] | 63,723 | 102,131 | -38,408 | ||||||
| Average population | Live births | Deaths | Natural change | Crude birth rate (per 1000) | Crude death rate (per 1000) | Natural change (per 1000) | Total fertility rate | Female fertile population (15–49 years) | |
| Total 1950-2018 | 6,760,974 | 5,681,634 | 1,079,340 | 934.3 | 785.1 | 149.1 | |||
| Average 1950-2018 | 7,236,775 | 97,985 | 82,343 | 15,643 | 13.5 | 11.4 | 2.2 | 1.86 | 1,813,209 |
Current vital statistics [14][15]
Births
- from January - May 2019 = 24,849
- from January - May 2020 = 24,056
- Difference between number of births in 2019 and 2020 (January - May) =

Deaths
- from January - May 2019 = 44,604
- from January - May 2020 = 43,244
- Difference between number of deaths in 2019 and 2020 (January - May) =

Natural increase
- from January - May 2019 = -19,755
- from January - May 2020 = -19,188
- Difference between natural increase in 2019 and 2020 (January - May) =

Birth statistics by districts
| District | Population | Live births | Crude birth rate (‰) |
|---|---|---|---|
| City of Belgrade | 1,687,132 | 18,000 | 10.7‰ |
| Kolubara District | 165,273 | 1,334 | 8.1‰ |
| Mačva District | 283,007 | 2,441 | 8.6‰ |
| Moravica District | 202,026 | 1,753 | 8.7‰ |
| Pomoravlje District | 202,025 | 1,435 | 7.1‰ |
| Rasina District | 226,808 | 1,772 | 7.8‰ |
| Raška District | 305,954 | 3,260 | 10.7‰ |
| Šumadija District | 284,957 | 2,390 | 8.4‰ |
| Zlatibor District | 271,080 | 2,358 | 8.7‰ |
| Bor District | 114,816 | 846 | 7.4‰ |
| Braničevo District | 170,207 | 1,284 | 7.5‰ |
| Jablanica District | 203,254 | 1,655 | 8.1‰ |
| Nišava District | 364,157 | 3,290 | 9.0‰ |
| Pčinja District | 198,671 | 1,980 | 10.0‰ |
| Pirot District | 85,964 | 645 | 7.5‰ |
| Podunavlje District | 189,091 | 1,469 | 7.8‰ |
| Toplica District | 85,287 | 758 | 8.9‰ |
| Zaječar District | 109,634 | 660 | 6.0‰ |
| Central Banat District | 177,308 | 1,561 | 8.8‰ |
| North Bačka District | 180,349 | 1,709 | 9.5‰ |
| North Banat District | 138,371 | 1,158 | 8.4‰ |
| South Bačka District | 617,949 | 6,529 | 10.6‰ |
| South Banat District | 281,203 | 2,500 | 8.9‰ |
| Srem District | 300,988 | 2,715 | 9.0‰ |
| West Bačka District | 175,347 | 1,392 | 7.9‰ |
| Total | 7,020,858 | 64,894 | 9.2‰ |
Birth rate by municipalities 1961–2017
| Birth rates between 1961 and 2017 by municipalities (‰)[17] | |||||||
|---|---|---|---|---|---|---|---|
| Municipality | 1961 | 1971 | 1981 | 1991 | 2001 | 2011 | 2017 |
| Novi Pazar | 32.5 | 24.2 | 22.5 | 21.5 | 16.9 | 15.1 | 14.6 |
| Tutin | 36.3 | 32.3 | 27.0 | 21.5 | 18.8 | 17.4 | 14.5 |
| Sjenica | 34.2 | 26.8 | 18.3 | 20.0 | 12.7 | 11.9 | 12.9 |
| Preševo | 36.2 | 33.8 | 25.6 | 32.5 | 22.2 | 11.2 | 12.7 |
| Savski venac | 12.7 | 12.5 | 13.6 | 9.8 | 8.8 | 10.3 | 11.9 |
| City of Novi Sad | 18.4 | 15.1 | 15.5 | 11.9 | 10.8 | 12.2 | 11.7 |
| Trgovište | 28.0 | 19.0 | 11.4 | 14.6 | 8.7 | 6.1 | 11.5 |
| Bujanovac | 30.6 | 28.0 | 20.2 | 24.8 | 15.6 | 11.4 | 11.3 |
| Zvezdara | 15.9 | 17.6 | 15.4 | 10.3 | 10.8 | 11.4 | 11.2 |
| Bojnik | 18.0 | 15.4 | 11.1 | 12.7 | 11.7 | 9.9 | 11.1 |
| Voždovac | 17.4 | 17.2 | 13.6 | 10.3 | 8.8 | 10.5 | 10.9 |
| Zemun | 18.7 | 18.0 | 16.8 | 11.2 | 11.8 | 11.2 | 10.8 |
| City of Belgrade | 15.8 | 15.3 | 14.7 | 10.6 | 9.8 | 10.7 | 10.7 |
| Čukarica | 28.8 | 25.2 | 17.2 | 10.8 | 10.2 | 10.9 | 10.4 |
| Žabalj | 18.7 | 13.7 | 13.4 | 13.8 | 12.6 | 9.5 | 10.4 |
| Vračar | 10.6 | 10.8 | 12.2 | 8.5 | 8.7 | 10.8 | 10.3 |
| City of Niš | 17.1 | 15.3 | 13.7 | 11.8 | 10.1 | 9.5 | 9.7 |
| City of Vranje | 23.7 | 18.2 | 15.0 | 13.8 | 12.4 | 10.3 | 9.6 |
| Bački Petrovac | 16.9 | 10.5 | 12.1 | 10.9 | 9.2 | 9.6 | 9.6 |
| Žitište | 14.2 | 9.6 | 9.6 | 10.8 | 8.5 | 8.0 | 9.6 |
| Grocka | 16.1 | 14.6 | 16.9 | 11.7 | 10.3 | 10.5 | 9.5 |
| Prijepolje | 29.9 | 22.3 | 15.6 | 15.6 | 10.3 | 9.9 | 9.4 |
| Loznica | 23.6 | 17.2 | 15.1 | 12.0 | 10.3 | 8.0 | 9.4 |
| Titel | 17.8 | 13.1 | 12.1 | 12.5 | 9.6 | 10.0 | 9.3 |
| Alibunar | 15.7 | 12.0 | 10.7 | 10.6 | 8.1 | 6.8 | 9.3 |
| City of Požarevac | 14.5 | 13.4 | 12.4 | 12.5 | 12.1 | 9.7 | 9.3 |
| Vrbas | 20.4 | 16.5 | 16.8 | 12.6 | 10.5 | 10.0 | 9.2 |
| Čačak | 16.5 | 13.3 | 14.2 | 10.3 | 9.7 | 8.5 | 9.2 |
| Arilje | 16.5 | 12.6 | 11.4 | 11.9 | 10.8 | 9.5 | 9.2 |
| Bor | 15.1 | 16.1 | 12.9 | 12.1 | 10.3 | 8.6 | 9.2 |
| Bela Palanka | 13.5 | 10.1 | 9.8 | 9.6 | 7.2 | 7.3 | 9.2 |
| Inđija | 12.3 | 13.3 | 14.3 | 12.1 | 8.8 | 7.7 | 9.2 |
| Šabac | 17.4 | 14.2 | 15.5 | 12.4 | 10.4 | 8.7 | 9.0 |
| Bačka Palanka | 16.0 | 15.2 | 14.4 | 10.1 | 9.6 | 8.5 | 9.0 |
| Ada | 15.5 | 13.4 | 11.6 | 10.2 | 9.8 | 7.3 | 9.0 |
| Čajetina | 19.0 | 14.9 | 9.9 | 11.0 | 8.6 | 6.3 | 8.9 |
| Bač | 19.6 | 13.6 | 13.4 | 11.4 | 9.3 | 6.9 | 8.7 |
| Valjevo | 17.7 | 13.2 | 11.5 | 11.0 | 9.3 | 8.1 | 8.7 |
| Krupanj | 22.6 | 16.9 | 14.5 | 13.6 | 9.0 | 7.0 | 8.6 |
| Zrenjanin | 16.1 | 13.6 | 13.4 | 10.6 | 9.4 | 8.8 | 8.5 |
| Beočin | 21.5 | 15.2 | 14.0 | 15.2 | 11.5 | 9.0 | 8.4 |
| City of Užice | 20.0 | 17.0 | 13.9 | 12.0 | 9.3 | 8.5 | 8.4 |
| Bečej | 16.8 | 13.1 | 13.4 | 11.0 | 11.3 | 8.6 | 8.4 |
| Žitorađa | 15.7 | 16.0 | 9.6 | 11.2 | 10.5 | 8.4 | 8.4 |
| Bajina Bašta | 13.6 | 11.7 | 12.3 | 8.8 | 9.5 | 9.1 | 8.4 |
| Vršac | 17.7 | 12.0 | 13.6 | 12.6 | 10.3 | 8.9 | 8.3 |
| Šid | 10.9 | 12.5 | 13.2 | 12.3 | 8.4 | 8.4 | 8.3 |
| Leskovac | 21.0 | 15.7 | 13.0 | 12.2 | 10.9 | 8.3 | 8.2 |
| Ub | 17.8 | 11.7 | 11.2 | 11.0 | 9.4 | 6.9 | 8.2 |
| Brus | 19.6 | 15.4 | 12.7 | 9.9 | 7.9 | 7.1 | 8.1 |
| Temerin | 19.3 | 11.7 | 14.8 | 12.1 | 9.6 | 9.1 | 8.1 |
| Ivanjica | 18.3 | 14.6 | 12.2 | 11.9 | 9.9 | 7.2 | 8.1 |
| Sombor | 15.5 | 12.5 | 12.6 | 11.6 | 8.5 | 7.1 | 8.1 |
| Irig | 15.0 | 12.1 | 12.6 | 9.8 | 8.9 | 7.1 | 8.1 |
| Bačka Topola | 15.0 | 11.3 | 12.4 | 11.0 | 9.9 | 7.3 | 8.1 |
| Blace | 14.9 | 11.4 | 7.1 | 7.9 | 8.4 | 5.1 | 8.1 |
| Gornji Milanovac | 14.0 | 12.8 | 13.0 | 10.2 | 8.2 | 7.7 | 8.1 |
| Ljubovija | 26.0 | 16.6 | 13.7 | 12.5 | 10.2 | 8.3 | 8.0 |
| Doljevac | 18.9 | 14.2 | 11.9 | 12.4 | 9.6 | 6.9 | 8.0 |
| Apatin | 18.2 | 14.2 | 13.7 | 10.1 | 9.0 | 7.3 | 7.9 |
| Požega | 15.4 | 13.7 | 11.0 | 10.1 | 8.5 | 6.3 | 7.9 |
| Vladičin Han | 19.8 | 12.8 | 13.3 | 12.3 | 8.9 | 7.0 | 7.8 |
| Bajina Bašta | 20.5 | 15.8 | 12.2 | 10.5 | 9.4 | 7.0 | 7.7 |
| Raška | 17.3 | 15.8 | 13.6 | 10.1 | 10.5 | 7.4 | 7.6 |
| Kraljevo | 16.1 | 15.4 | 12.3 | 11.6 | 10.9 | 8.4 | 7.6 |
| Kanjiža | 15.8 | 12.4 | 12.7 | 9.7 | 8.3 | 8.5 | 7.6 |
| Bogatić | 15.7 | 12.9 | 12.3 | 10.7 | 9.1 | 7.4 | 7.6 |
| Aleksinac | 13.3 | 11.6 | 10.6 | 9.6 | 9.1 | 7.1 | 7.6 |
| Aleksandrovac | 18.5 | 14.2 | 11.9 | 10.1 | 9.3 | 6.8 | 7.5 |
| Koceljeva | 17.7 | 11.4 | 14.1 | 12.4 | 10.6 | 7.1 | 7.5 |
| Mali Zvornik | 23.7 | 16.6 | 16.6 | 12.9 | 9.2 | 7.7 | 7.4 |
| Jagodina | 16.0 | 14.3 | 11.4 | 11.3 | 11.1 | 9.5 | 7.4 |
| Priboj | 32.7 | 20.1 | 16.0 | 14.8 | 8.8 | 6.4 | 7.3 |
| Bela Crkva | 17.1 | 15.4 | 13.8 | 9.3 | 9.2 | 9.2 | 7.3 |
| Batočina | 14.5 | 9.2 | 12.4 | 11.6 | 10.6 | 7.1 | 7.3 |
| Aranđelovac | 16.0 | 14.5 | 12.5 | 12.0 | 9.2 | 8.8 | 7.2 |
| Velika Plana | 14.8 | 13.5 | 11.1 | 10.9 | 9.2 | 7.2 | 7.2 |
| Vlasotince | 21.2 | 15.4 | 11.8 | 12.9 | 9.9 | 7.1 | 7.1 |
| Vrnjačka Banja | 13.7 | 11.8 | 14.2 | 11.0 | 9.6 | 7.4 | 7.1 |
| Nova Varoš | 25.3 | 16.1 | 14.3 | 12.9 | 8.0 | 5.4 | 7.0 |
| Čoka | 16.6 | 11.4 | 10.7 | 11.6 | 9.3 | 6.0 | 7.0 |
| Trstenik | 14.2 | 11.4 | 12.5 | 10.3 | 8.2 | 6.4 | 6.9 |
| Ćuprija | 14.8 | 12.3 | 12.4 | 11.3 | 9.7 | 6.2 | 6.9 |
| Ćićevac | 13.0 | 10.7 | 13.0 | 9.4 | 9.8 | 5.2 | 6.9 |
| Bosilegrad | 18.9 | 14.7 | 11.5 | 9.7 | 8.2 | 5.3 | 6.7 |
| Žabari | 11.0 | 10.7 | 7.7 | 8.8 | 7.7 | 6.0 | 6.7 |
| Žagubica | 13.2 | 11.7 | 7.8 | 10.0 | 8.3 | 6.3 | 6.5 |
| Vladimirci | 17.6 | 11.2 | 11.2 | 11.8 | 7.9 | 7.0 | 6.3 |
| Varvarin | 13.4 | 12.1 | 1.6 | 9.3 | 9.1 | 7.0 | 6.3 |
| Veliko Gradište | 11.7 | 12.9 | 8.6 | 10.5 | 8.7 | 6.9 | 6.3 |
| Topola | 13.0 | 9.9 | 10.5 | 9.4 | 8.1 | 6.4 | 6.2 |
| Babušnica | 18.5 | 11.3 | 8.5 | 6.2 | 5.3 | 5.9 | 6.1 |
| Golubac | 13.5 | 12.3 | 8.6 | 9.8 | 9.3 | 5.9 | 6.1 |
| Dimitrovgrad | 13.0 | 9.3 | 9.0 | 7.2 | 7.1 | 4.7 | 6.0 |
| Boljevac | 13.4 | 9.0 | 8.3 | 9.9 | 8.1 | 5.0 | 5.8 |
| Zaječar | 11.8 | 11.5 | 11.2 | 10.0 | 8.2 | 7.2 | 5.8 |
| Despotovac | 15.9 | 12.3 | 10.6 | 9.4 | 8.9 | 7.2 | 5.6 |
| Crna Trava | 24.2 | 12.4 | 9.0 | 6.1 | 4.4 | 4.8 | 5.5 |
| Gadžin Han | 16.7 | 9.5 | 6.7 | 5.6 | 4.7 | 3.7 | 5.4 |
| Total | 17.2 | 14.4 | 13.4 | 11.5 | 10.5 | 9.0 | 9.2 |
Marriages and divorces
Data for Serbia excluding Kosovo.
| Average population | Marriages | Divorces | Crude marriage rate (per 1000) | Crude divorce rate (per 1000) | Divorces per 1000 marriages | |
|---|---|---|---|---|---|---|
| 1950 | 5,969,977 | 76,749 | 9,623 | 12.9 | 1.6 | 125.4 |
| 1951 | 6,045,982 | 66,849 | 8,250 | 11.1 | 1.4 | 123.4 |
| 1952 | 6,106,976 | 67,255 | 5,611 | 11.0 | 0.9 | 83.4 |
| 1953 | 6,186,015 | 63,667 | 7,570 | 10.3 | 1.2 | 118.9 |
| 1954 | 6,271,014 | 61,707 | 8,053 | 9.8 | 1.3 | 130.5 |
| 1955 | 6,369,436 | 57,970 | 9,784 | 9.1 | 1.5 | 168.8 |
| 1956 | 6,422,999 | 55,603 | 9,291 | 8.7 | 1.4 | 167.1 |
| 1957 | 6,481,984 | 56,214 | 9,827 | 8.7 | 1.5 | 174.8 |
| 1958 | 6,535,020 | 63,195 | 10,229 | 9.7 | 1.6 | 161.9 |
| 1959 | 6,587,014 | 59,361 | 10,328 | 9.0 | 1.6 | 174.0 |
| 1960 | 6,638,992 | 62,341 | 10,585 | 9.4 | 1.6 | 169.8 |
| 1961 | 6,689,077 | 62,775 | 10,130 | 9.4 | 1.5 | 161.4 |
| 1962 | 6,740,264 | 58,211 | 9,948 | 8.6 | 1.5 | 170.9 |
| 1963 | 6,787,950 | 57,316 | 10,285 | 8.4 | 1.5 | 179.4 |
| 1964 | 6,832,855 | 59,481 | 9,977 | 8.7 | 1.5 | 167.7 |
| 1965 | 6,876,624 | 62,011 | 9,939 | 9.0 | 1.4 | 160.3 |
| 1966 | 6,927,969 | 60,878 | 10,731 | 8.8 | 1.5 | 176.3 |
| 1967 | 6,966,522 | 64,168 | 9,791 | 9.2 | 1.4 | 152.6 |
| 1968 | 7,007,586 | 64,287 | 10,179 | 9.2 | 1.5 | 158.3 |
| 1969 | 7,123,249 | 64,796 | 8,788 | 9.1 | 1.2 | 135.6 |
| 1970 | 7,164,993 | 66,719 | 9,129 | 9.3 | 1.3 | 136.8 |
| 1971 | 7,211,716 | 66,839 | 9,873 | 9.3 | 1.4 | 147.7 |
| 1972 | 7,267,030 | 68,417 | 10,335 | 9.4 | 1.4 | 151.1 |
| 1973 | 7,322,344 | 66,845 | 10,290 | 9.1 | 1.4 | 153.9 |
| 1974 | 7,377,659 | 65,790 | 11,086 | 8.9 | 1.5 | 168.5 |
| 1975 | 7,432,973 | 62,843 | 10,693 | 8.5 | 1.4 | 170.2 |
| 1976 | 7,488,287 | 61,555 | 10,917 | 8.2 | 1.5 | 177.4 |
| 1977 | 7,543,601 | 62,733 | 10,350 | 8.3 | 1.4 | 165.0 |
| 1978 | 7,598,916 | 61,943 | 10,813 | 8.2 | 1.4 | 174.6 |
| 1979 | 7,654,230 | 60,828 | 10,265 | 7.9 | 1.3 | 168.8 |
| 1980 | 7,709,544 | 57,500 | 10,840 | 7.5 | 1.4 | 188.5 |
| 1981 | 7,736,787 | 57,563 | 9,517 | 7.4 | 1.2 | 165.3 |
| 1982 | 7,763,335 | 57,327 | 10,236 | 7.4 | 1.3 | 178.6 |
| 1983 | 7,788,100 | 56,556 | 9,699 | 7.3 | 1.2 | 171.5 |
| 1984 | 7,813,549 | 55,482 | 10,349 | 7.1 | 1.3 | 186.5 |
| 1985 | 7,835,902 | 53,252 | 11,567 | 6.8 | 1.5 | 217.2 |
| 1986 | 7,853,824 | 52,383 | 10,348 | 6.7 | 1.3 | 197.5 |
| 1987 | 7,868,027 | 52,500 | 11,689 | 6.7 | 1.5 | 222.6 |
| 1988 | 7,884,218 | 51,709 | 11,686 | 6.6 | 1.5 | 226.0 |
| 1989 | 7,893,787 | 51,073 | 11,449 | 6.5 | 1.5 | 224.2 |
| 1990 | 7,897,937 | 48,261 | 9,889 | 6.1 | 1.3 | 204.9 |
| 1991 | 7,824,589 | 45,145 | 8,018 | 5.8 | 1.0 | 177.6 |
| 1992 | 7,787,897 | 46,155 | 6,501 | 5.9 | 0.8 | 140.9 |
| 1993 | 7,751,205 | 44,800 | 6,792 | 5.8 | 0.9 | 151.6 |
| 1994 | 7,714,513 | 44,091 | 6,358 | 5.7 | 0.8 | 144.2 |
| 1995 | 7,677,821 | 43,555 | 7,217 | 5.7 | 0.9 | 165.7 |
| 1996 | 7,641,129 | 40,705 | 6,860 | 5.3 | 0.9 | 168.5 |
| 1997 | 7,604,437 | 40,344 | 6,982 | 5.3 | 0.9 | 173.1 |
| 1998 | 7,567,745 | 39,328 | 6,909 | 5.2 | 0.9 | 175.7 |
| 1999 | 7,540,401 | 37,256 | 6,264 | 4.9 | 0.8 | 168.1 |
| 2000 | 7,516,346 | 42,586 | 7,689 | 5.7 | 1.0 | 180.6 |
| 2001 | 7,503,433 | 41,406 | 7,835 | 5.5 | 1.0 | 189.2 |
| 2002 | 7,500,031 | 41,947 | 9,982 | 5.6 | 1.3 | 238.0 |
| 2003 | 7,480,591 | 41,914 | 7,938 | 5.6 | 1.1 | 189.4 |
| 2004 | 7,463,157 | 42,030 | 8,845 | 5.6 | 1.2 | 210.4 |
| 2005 | 7,440,769 | 38,846 | 7,661 | 5.2 | 1.0 | 197.2 |
| 2006 | 7,411,569 | 39,756 | 8,204 | 5.4 | 1.1 | 206.4 |
| 2007 | 7,381,579 | 41,083 | 8,622 | 5.6 | 1.2 | 209.9 |
| 2008 | 7,350,222 | 38,285 | 8,502 | 5.2 | 1.2 | 222.1 |
| 2009 | 7,320,807 | 36,853 | 8,472 | 5.0 | 1.2 | 229.9 |
| 2010 | 7,291,436 | 35,815 | 6,644 | 4.9 | 0.9 | 185.5 |
| 2011 | 7,236,519 | 35,808 | 8,251 | 4.9 | 1.1 | 230.4 |
| 2012 | 7,201,497 | 34,639 | 7,372 | 4.8 | 1.0 | 212.8 |
| 2013 | 7,166,552 | 36,209 | 8,170 | 5.1 | 1.1 | 225.6 |
| 2014 | 7,131,787 | 36,429 | 7,614 | 5.1 | 1.1 | 209.0 |
| 2015 | 7,095,383 | 36,949 | 9,381 | 5.2 | 1.3 | 253.9 |
| 2016 | 7,058,322 | 35,921 | 9,046 | 5.1 | 1.3 | 251.8 |
| 2017 | 7,020,858 | 36,047 | 9,262 | 5.1 | 1.3 | 256.9 |
| 2018 | 6,982,604 | 36,321 | 9,995 | 5.2 | 1.4 | 275.2 |
| 2019 | ||||||
| Average population | Marriages | Divorces | Crude marriage rate (per 1000) | Crude divorce rate (per 1000) | Divorces per 1000 marriages | |
| Total 1950-2018 | 3,593,175 | 631,325 | ||||
| Average 1950-2018 | 7,236,775 | 52,075 | 9,150 | 7.2 | 1.3 | 175.7 |
Vital statistics, marriages and divorces by decade
Vital statistics by decade |
1950-1959 | 1960-1969 | 1970-1979 | 1980-1989 | 1990-1999 | 2000-2009 | 2010-2018 |
|---|---|---|---|---|---|---|---|
| Average population | 6,297,642 | 6,859,109 | 7,406,175 | 7,814,707 | 7,700,767 | 7,436,850 | 7,131,662 |
| Live births | 139,835 | 107,976 | 109,127 | 102,300 | 83,800 | 73,817 | 65,826 |
| Deaths | 66,612 | 60,890 | 68,889 | 81,710 | 94,739 | 103,327 | 102,220 |
| Natural change | 73,223 | 47,087 | 40,238 | 20,590 | -10,939 | -29,510 | -36,394 |
| Crude birth rate (per 1000) | 22.2 | 15.7 | 14.7 | 13.1 | 10.9 | 9.9 | 9.2 |
| Crude death rate (per 1000) | 10.6 | 8.9 | 9.3 | 10.5 | 12.3 | 13.9 | 14.3 |
| Natural change (per 1000) | 11.6 | 6.9 | 5.4 | 2.6 | -1.4 | -4.0 | -5.1 |
| Total fertility rate | 2.46 | 2.01 | 1.87 | 1.83 | 1.68 | 1.49 | 1.45 |
| Female fertile population (15–49 years) | 1,714,002 | 1,817,281 | 2,007,627 | 1,930,480 | 1,850,974 | 1,762,242 | 1,587,264 |
Marriages and divorces by decade |
1950-1959 | 1960-1969 | 1970-1979 | 1980-1989 | 1990-1999 | 2000-2009 | 2010-2018 |
| Average population | 6,297,642 | 6,859,109 | 7,406,175 | 7,814,707 | 7,700,767 | 7,436,850 | 7,131,662 |
| Marriages | 62,857 | 61,626 | 64,451 | 54,535 | 42,964 | 40,471 | 36,015 |
| Divorces | 8,857 | 10,035 | 10,375 | 10,738 | 7,179 | 8,375 | 8,415 |
| Crude marriage rate (per 1000) | 10.0 | 9.0 | 8.7 | 7.0 | 5.6 | 5.4 | 5.1 |
| Crude divorce rate (per 1000) | 1.4 | 1.5 | 1.4 | 1.4 | 0.9 | 1.1 | 1.2 |
| Divorces per 1000 marriages | 140.9 | 162.8 | 161.0 | 196.9 | 167.1 | 206.9 | 233.7 |
Births and fertility rates
Live births by age of mother |
Average 1950-2018 | 1950 | 1951 | 1952 | 1953 | 1954 | 1955 | 1956 | 1957 | 1958 | 1959 | 1960 | 1961 | 1962 | 1963 | 1964 | 1965 | 1966 | 1967 | 1968 | 1969 | 1970 | 1971 | 1972 | 1973 | 1974 | 1975 | 1976 | 1977 | 1978 | 1979 | 1980 | 1981 | 1982 | 1983 | 1984 | 1985 | 1986 | 1987 | 1988 | 1989 | 1990 | 1991 | 1992 | 1993 | 1994 | 1995 | 1996 | 1997 | 1998 | 1999 | 2000 | 2001 | 2002 | 2003 | 2004 | 2005 | 2006 | 2007 | 2008 | 2009 | 2010 | 2011 | 2012 | 2013 | 2014 | 2015 | 2016 | 2017 | 2018 | 2019 | Live births by age of mother |
|---|---|---|---|---|---|---|---|---|---|---|---|---|---|---|---|---|---|---|---|---|---|---|---|---|---|---|---|---|---|---|---|---|---|---|---|---|---|---|---|---|---|---|---|---|---|---|---|---|---|---|---|---|---|---|---|---|---|---|---|---|---|---|---|---|---|---|---|---|---|---|---|---|
Live births total |
97,985 | 163,297 | 145,197 | 161,306 | 151,672 | 152,569 | 140,396 | 132,078 | 118,535 | 118,425 | 114,872 | 119,298 | 115,222 | 110,008 | 108,324 | 103,847 | 106,699 | 103,775 | 103,491 | 103,621 | 105,478 | 102,453 | 104,070 | 106,859 | 108,361 | 110,458 | 112,945 | 114,035 | 111,510 | 110,622 | 109,953 | 109,597 | 103,407 | 106,575 | 108,003 | 107,036 | 101,938 | 99,419 | 98,279 | 97,471 | 91,270 | 90,467 | 90,378 | 86,877 | 87,931 | 85,292 | 86,236 | 82,548 | 79,716 | 76,330 | 72,222 | 73,764 | 78,435 | 78,101 | 79,025 | 78,186 | 72,180 | 70,997 | 68,102 | 69,083 | 70,299 | 68,304 | 65,598 | 67,257 | 65,554 | 66,461 | 65,657 | 64,734 | 64,894 | 63,975 | Live births total | |
| Under 15 | 75 | 25 | 22 | 24 | 33 | 34 | 31 | 18 | 34 | 13 | 44 | 45 | 48 | 43 | 63 | 70 | 68 | 91 | 104 | 104 | 56 | 127 | 141 | 143 | 120 | 89 | 161 | 151 | 120 | 142 | 115 | 126 | 152 | 170 | 123 | 107 | 111 | 104 | 99 | 90 | 67 | 104 | 46 | 78 | 81 | 86 | 61 | 70 | 85 | 51 | 47 | 60 | 63 | 61 | 46 | 49 | 60 | 55 | 66 | 59 | 83 | 59 | 48 | 61 | 43 | 53 | 37 | 49 | 44 | 48 | Under 15 | |
| 15-19 | 11,660 | 15,676 | 13,859 | 15,518 | 14,872 | 15,066 | 13,898 | 12,938 | 13,064 | 13,087 | 14,227 | 14,880 | 14,611 | 13,701 | 13,934 | 13,769 | 16,296 | 19,419 | 20,760 | 20,737 | 22,680 | 21,080 | 21,086 | 21,521 | 19,884 | 18,792 | 18,064 | 16,939 | 15,917 | 15,666 | 15,144 | 14,680 | 13,043 | 13,555 | 13,250 | 13,328 | 13,299 | 12,956 | 12,479 | 12,964 | 12,017 | 11,457 | 11,102 | 10,194 | 10,311 | 9,768 | 9,121 | 8,386 | 7,886 | 7,186 | 6,572 | 6,536 | 6,602 | 6,153 | 6,013 | 5,706 | 5,228 | 5,045 | 4,823 | 4,656 | 4,484 | 4,109 | 3,748 | 3,701 | 3,389 | 3,243 | 2,865 | 2,625 | 2,580 | 2,383 | 15-19 | |
| 20-24 | 35,470 | 65,547 | 58,049 | 64,843 | 60,619 | 61,338 | 56,560 | 52,802 | 47,060 | 46,591 | 44,537 | 46,483 | 44,016 | 41,853 | 40,493 | 38,955 | 39,273 | 35,964 | 36,733 | 36,750 | 40,987 | 42,495 | 45,589 | 47,456 | 48,812 | 49,485 | 50,917 | 50,445 | 48,447 | 46,076 | 44,625 | 43,263 | 40,395 | 41,553 | 41,902 | 40,858 | 38,765 | 37,309 | 36,413 | 36,361 | 34,202 | 33,981 | 33,195 | 31,988 | 31,956 | 30,333 | 30,401 | 28,971 | 27,683 | 26,427 | 24,452 | 24,826 | 24,770 | 23,730 | 23,578 | 22,646 | 20,588 | 19,478 | 18,134 | 17,418 | 16,261 | 14,765 | 13,631 | 13,513 | 12,614 | 12,549 | 11,717 | 11,385 | 11,124 | 10,526 | 20-24 | |
| 25-29 | 28,771 | 49,680 | 44,043 | 49,128 | 46,771 | 47,193 | 43,474 | 40,866 | 35,621 | 35,841 | 34,301 | 35,657 | 34,115 | 32,861 | 32,137 | 30,140 | 30,372 | 28,283 | 26,462 | 26,507 | 23,223 | 20,975 | 20,284 | 20,931 | 22,999 | 25,660 | 28,160 | 31,099 | 31,659 | 33,035 | 33,731 | 34,096 | 32,315 | 32,970 | 32,787 | 32,126 | 29,792 | 29,243 | 29,160 | 28,850 | 26,708 | 26,538 | 26,883 | 25,772 | 25,573 | 25,157 | 25,933 | 25,030 | 24,425 | 23,722 | 22,936 | 23,733 | 26,237 | 26,299 | 26,564 | 26,178 | 23,989 | 23,525 | 22,219 | 22,650 | 22,875 | 22,821 | 21,295 | 21,526 | 20,905 | 20,620 | 20,129 | 19,850 | 19,605 | 18,977 | 25-29 | |
| 30-34 | 14,634 | 15,425 | 13,848 | 15,182 | 20,061 | 20,091 | 18,460 | 17,918 | 15,885 | 15,869 | 14,949 | 15,425 | 15,394 | 14,748 | 14,766 | 14,234 | 14,250 | 13,695 | 13,090 | 13,125 | 12,274 | 11,778 | 11,023 | 10,550 | 10,137 | 9,833 | 9,365 | 9,263 | 9,698 | 10,639 | 11,472 | 12,765 | 13,080 | 13,704 | 14,927 | 15,457 | 14,755 | 14,403 | 14,501 | 13,665 | 12,506 | 12,615 | 13,219 | 12,975 | 13,643 | 13,566 | 14,248 | 13,569 | 13,149 | 12,781 | 12,305 | 12,625 | 14,291 | 15,005 | 15,584 | 16,103 | 15,452 | 15,845 | 15,799 | 16,496 | 17,804 | 17,728 | 17,826 | 18,739 | 18,632 | 19,317 | 19,695 | 19,432 | 19,506 | 19,598 | 30-34 | |
| 35-39 | 5,517 | 10,756 | 9,703 | 10,568 | 5,891 | 5,682 | 5,150 | 5,319 | 5,201 | 5,461 | 5,459 | 5,541 | 5,447 | 5,199 | 5,287 | 5,046 | 4,928 | 4,841 | 4,822 | 4,838 | 4,697 | 4,317 | 4,281 | 4,223 | 4,306 | 4,250 | 4,065 | 4,022 | 3,719 | 3,374 | 3,219 | 3,061 | 2,894 | 3,150 | 3,604 | 4,071 | 4,188 | 4,397 | 4,611 | 4,535 | 4,638 | 4,583 | 4,668 | 4,641 | 4,779 | 4,913 | 5,006 | 4,985 | 5,090 | 4,846 | 4,707 | 4,674 | 5,105 | 5,263 | 5,561 | 5,733 | 5,447 | 5,631 | 5,657 | 6,242 | 6,988 | 7,236 | 7,330 | 7,920 | 8,200 | 8,681 | 9,037 | 9,302 | 9,704 | 9,964 | 35-39 | |
| 40-44 | 1,296 | 4,581 | 4,177 | 4,483 | 2,627 | 2,473 | 2,221 | 1,728 | 1,233 | 1,124 | 1,079 | 1,023 | 1,264 | 1,314 | 1,332 | 1,296 | 1,177 | 1,111 | 1,124 | 1,128 | 1,067 | 999 | 1,010 | 1,030 | 1,026 | 1,019 | 1,024 | 1,031 | 1,025 | 894 | 859 | 852 | 748 | 756 | 696 | 665 | 643 | 640 | 714 | 727 | 782 | 836 | 908 | 929 | 1,036 | 1,048 | 990 | 1,127 | 977 | 983 | 873 | 954 | 989 | 1,063 | 1,126 | 1,158 | 1,020 | 985 | 918 | 1,024 | 1,112 | 1,210 | 1,293 | 1,411 | 1,449 | 1,597 | 1,731 | 1,740 | 2,048 | 2,179 | 40-44 | |
| 45-49 | 155 | 876 | 825 | 847 | 615 | 524 | 452 | 364 | 301 | 312 | 204 | 174 | 193 | 157 | 165 | 164 | 145 | 139 | 160 | 159 | 110 | 93 | 92 | 92 | 77 | 81 | 80 | 88 | 99 | 79 | 82 | 96 | 95 | 63 | 78 | 74 | 71 | 67 | 74 | 48 | 52 | 49 | 43 | 40 | 64 | 66 | 60 | 54 | 62 | 71 | 76 | 72 | 54 | 62 | 65 | 50 | 44 | 65 | 65 | 73 | 64 | 88 | 88 | 114 | 118 | 137 | 95 | 91 | 151 | 151 | 45-49 | |
| 50 and over | 32 | 243 | 235 | 232 | 112 | 97 | 84 | 48 | 45 | 35 | 19 | 14 | 49 | 54 | 43 | 42 | 37 | 53 | 38 | 38 | 27 | 33 | 26 | 22 | 16 | 14 | 23 | 12 | 12 | 22 | 16 | 10 | 15 | 8 | 6 | 13 | 8 | 10 | 9 | 11 | 10 | 9 | 13 | 17 | 31 | 13 | 11 | 6 | 10 | 10 | 12 | 13 | 9 | 7 | 11 | 12 | 9 | 16 | 9 | 10 | 8 | 8 | 13 | 17 | 15 | 21 | 5 | 8 | 15 | 25 | 50 and over | |
| Unknown | 375 | 488 | 436 | 481 | 71 | 71 | 66 | 77 | 91 | 92 | 53 | 56 | 85 | 78 | 104 | 131 | 153 | 179 | 198 | 235 | 357 | 556 | 538 | 891 | 984 | 1,235 | 1,086 | 985 | 814 | 695 | 690 | 648 | 670 | 646 | 630 | 337 | 306 | 290 | 219 | 220 | 288 | 295 | 301 | 243 | 457 | 342 | 405 | 350 | 349 | 253 | 242 | 271 | 315 | 458 | 477 | 551 | 343 | 352 | 412 | 455 | 620 | 280 | 326 | 255 | 189 | 243 | 346 | 252 | 117 | 124 | Unknown | |
Female fertile population (15–49 years) by age group |
Average 1950-2018 | 1950 | 1951 | 1952 | 1953 | 1954 | 1955 | 1956 | 1957 | 1958 | 1959 | 1960 | 1961 | 1962 | 1963 | 1964 | 1965 | 1966 | 1967 | 1968 | 1969 | 1970 | 1971 | 1972 | 1973 | 1974 | 1975 | 1976 | 1977 | 1978 | 1979 | 1980 | 1981 | 1982 | 1983 | 1984 | 1985 | 1986 | 1987 | 1988 | 1989 | 1990 | 1991 | 1992 | 1993 | 1994 | 1995 | 1996 | 1997 | 1998 | 1999 | 2000 | 2001 | 2002 | 2003 | 2004 | 2005 | 2006 | 2007 | 2008 | 2009 | 2010 | 2011 | 2012 | 2013 | 2014 | 2015 | 2016 | 2017 | 2018 | 2019 | Female fertile population (15–49 years) by age group |
Total female 15–49 years |
1,813,209 | 1,667,489 | 1,679,515 | 1,691,530 | 1,703,548 | 1,714,614 | 1,725,685 | 1,736,751 | 1,739,485 | 1,742,115 | 1,739,287 | 1,733,296 | 1,727,303 | 1,735,235 | 1,750,899 | 1,769,796 | 1,807,362 | 1,843,693 | 1,887,344 | 1,945,878 | 1,972,004 | 2,012,702 | 2,020,324 | 2,019,717 | 2,036,056 | 2,020,513 | 2,010,021 | 2,002,713 | 1,994,191 | 1,974,022 | 1,986,006 | 1,997,988 | 1,977,061 | 1,947,609 | 1,914,434 | 1,921,422 | 1,920,627 | 1,911,361 | 1,919,612 | 1,899,146 | 1,895,541 | 1,899,883 | 1,813,520 | 1,821,688 | 1,833,456 | 1,846,610 | 1,860,970 | 1,868,882 | 1,864,628 | 1,855,228 | 1,844,875 | 1,831,994 | 1,821,493 | 1,810,526 | 1,789,668 | 1,770,053 | 1,750,845 | 1,733,316 | 1,718,428 | 1,704,735 | 1,691,363 | 1,677,562 | 1,632,708 | 1,615,898 | 1,599,129 | 1,582,643 | 1,566,064 | 1,550,651 | 1,537,044 | 1,523,675 | Total female 15–49 years | |
| 10-14 | 255,957 | 286,018 | 272,832 | 263,321 | 253,810 | 248,651 | 243,492 | 238,333 | 259,259 | 130,000 | 262,500 | 284,501 | 306,501 | 480,000 | 343,333 | 350,000 | 340,000 | 278,333 | 330,000 | 286,677 | 245,000 | 301,667 | 270,134 | 272,000 | 280,000 | 276,667 | 240,000 | 267,333 | 280,000 | 266,000 | 249,750 | 233,500 | 247,952 | 230,000 | 286,667 | 269,091 | 276,667 | 960,000 | 150,000 | 283,333 | 269,222 | 263,428 | 247,904 | 246,328 | 245,564 | 245,740 | 244,758 | 241,922 | 238,560 | 234,552 | 228,803 | 222,954 | 218,969 | 215,677 | 211,248 | 207,565 | 204,964 | 201,529 | 197,138 | 192,518 | 187,193 | 181,840 | 171,697 | 170,484 | 170,695 | 172,024 | 173,405 | 172,970 | 170,506 | 167,578 | 10-14 | |
| 15-19 | 252,791 | 322,143 | 315,156 | 308,163 | 301,169 | 290,326 | 279,483 | 268,641 | 260,126 | 250,035 | 240,206 | 231,449 | 222,692 | 223,599 | 237,840 | 256,505 | 285,061 | 304,850 | 316,625 | 309,634 | 327,168 | 330,123 | 329,876 | 321,732 | 305,654 | 290,749 | 278,969 | 270,780 | 265,831 | 262,186 | 260,023 | 257,860 | 256,821 | 250,964 | 248,465 | 248,198 | 247,661 | 247,852 | 249,622 | 252,208 | 254,455 | 258,548 | 243,797 | 247,977 | 250,885 | 252,289 | 252,477 | 251,204 | 249,269 | 248,396 | 248,825 | 248,140 | 245,807 | 243,588 | 239,596 | 233,847 | 227,633 | 222,688 | 217,825 | 212,667 | 208,819 | 206,230 | 198,633 | 193,813 | 188,306 | 182,061 | 175,752 | 171,643 | 170,365 | 170,575 | 15-19 | |
| 20-24 | 263,338 | 321,829 | 321,495 | 321,160 | 320,826 | 318,313 | 315,800 | 313,286 | 306,135 | 295,138 | 283,579 | 277,224 | 270,868 | 257,128 | 247,990 | 238,765 | 230,851 | 223,430 | 227,936 | 230,027 | 260,421 | 287,177 | 304,801 | 317,996 | 327,965 | 333,533 | 333,334 | 330,390 | 320,918 | 305,179 | 294,164 | 283,148 | 283,316 | 275,220 | 272,016 | 268,306 | 262,557 | 255,500 | 251,111 | 248,448 | 247,287 | 247,977 | 234,244 | 234,665 | 236,468 | 239,771 | 244,273 | 248,830 | 251,940 | 253,675 | 254,292 | 254,017 | 253,183 | 252,034 | 250,942 | 251,319 | 250,871 | 248,448 | 245,415 | 241,218 | 234,965 | 228,435 | 217,830 | 213,807 | 209,178 | 205,340 | 202,378 | 198,542 | 193,587 | 188,104 | 20-24 | |
| 25-29 | 269,316 | 277,906 | 286,770 | 295,633 | 304,497 | 308,962 | 313,428 | 317,893 | 317,818 | 317,767 | 316,851 | 313,135 | 309,419 | 302,131 | 292,180 | 281,269 | 274,954 | 267,333 | 258,805 | 267,313 | 240,769 | 232,681 | 220,104 | 226,442 | 239,681 | 258,296 | 282,740 | 303,622 | 316,918 | 327,271 | 332,994 | 338,717 | 330,113 | 321,722 | 308,516 | 297,112 | 287,251 | 280,669 | 276,290 | 272,610 | 267,496 | 262,173 | 246,353 | 243,004 | 241,067 | 240,581 | 240,019 | 238,939 | 238,560 | 239,290 | 241,330 | 244,663 | 249,236 | 252,889 | 254,373 | 255,142 | 255,136 | 253,941 | 252,413 | 251,575 | 251,697 | 250,749 | 238,303 | 235,397 | 231,884 | 226,717 | 221,367 | 217,526 | 213,514 | 208,882 | 25-29 | |
| 30-34 | 265,869 | 134,063 | 163,358 | 192,652 | 221,946 | 242,577 | 263,209 | 283,840 | 294,990 | 302,155 | 306,746 | 311,278 | 315,810 | 313,597 | 313,727 | 313,909 | 311,678 | 306,911 | 300,573 | 298,694 | 281,392 | 276,431 | 274,208 | 263,637 | 252,997 | 241,813 | 229,224 | 221,821 | 225,544 | 239,104 | 262,974 | 286,844 | 307,532 | 316,391 | 326,362 | 333,811 | 333,597 | 330,656 | 323,276 | 309,221 | 295,965 | 287,163 | 271,599 | 267,670 | 264,838 | 260,732 | 255,413 | 249,849 | 245,565 | 242,490 | 240,935 | 239,755 | 239,025 | 239,673 | 240,479 | 242,733 | 246,175 | 250,043 | 253,124 | 254,889 | 255,369 | 255,004 | 245,974 | 243,648 | 242,307 | 241,765 | 240,366 | 237,669 | 234,840 | 231,377 | 30-34 | |
| 35-39 | 260,361 | 213,898 | 190,297 | 166,695 | 143,094 | 150,148 | 157,203 | 164,257 | 193,826 | 227,176 | 252,891 | 263,388 | 273,886 | 290,652 | 298,136 | 303,035 | 309,341 | 311,691 | 311,961 | 322,265 | 312,229 | 313,051 | 309,425 | 304,644 | 295,696 | 287,141 | 278,450 | 271,234 | 262,040 | 251,465 | 241,913 | 232,361 | 220,939 | 225,611 | 239,750 | 260,536 | 284,606 | 305,643 | 318,210 | 327,307 | 331,826 | 333,029 | 315,513 | 310,509 | 299,894 | 289,308 | 280,382 | 274,134 | 269,007 | 264,966 | 259,920 | 254,209 | 249,072 | 245,868 | 243,012 | 241,694 | 240,631 | 239,452 | 239,408 | 240,389 | 242,506 | 245,781 | 246,117 | 248,115 | 248,784 | 248,524 | 247,355 | 245,091 | 242,817 | 241,481 | 35-39 | |
| 40-44 | 254,795 | 209,677 | 212,524 | 215,371 | 218,218 | 207,018 | 195,819 | 184,619 | 160,394 | 138,987 | 130,407 | 141,419 | 152,430 | 190,557 | 224,774 | 249,400 | 265,282 | 275,563 | 287,875 | 297,681 | 301,928 | 308,713 | 311,956 | 311,891 | 314,960 | 314,568 | 310,308 | 308,128 | 302,559 | 292,321 | 286,523 | 280,725 | 273,956 | 258,034 | 248,674 | 240,681 | 231,151 | 220,740 | 226,613 | 239,949 | 258,207 | 283,650 | 290,449 | 301,607 | 310,550 | 316,247 | 317,488 | 316,475 | 310,488 | 298,749 | 287,305 | 278,152 | 272,523 | 268,552 | 264,657 | 259,782 | 254,052 | 248,595 | 244,762 | 242,136 | 240,839 | 239,741 | 237,758 | 237,523 | 238,137 | 239,404 | 241,748 | 244,754 | 246,729 | 247,395 | 40-44 | |
| 45-49 | 246,740 | 187,973 | 189,915 | 191,856 | 193,798 | 197,270 | 200,743 | 204,215 | 206,196 | 210,857 | 208,607 | 195,403 | 182,198 | 157,571 | 136,252 | 126,913 | 130,195 | 153,915 | 183,569 | 220,264 | 248,097 | 264,526 | 269,954 | 273,375 | 299,103 | 294,413 | 296,996 | 296,738 | 300,381 | 296,496 | 307,415 | 318,333 | 304,384 | 299,667 | 270,651 | 272,778 | 273,804 | 270,301 | 274,490 | 249,403 | 240,305 | 227,343 | 211,565 | 216,256 | 229,754 | 247,682 | 270,918 | 289,451 | 299,799 | 307,662 | 312,268 | 313,058 | 312,647 | 307,922 | 296,609 | 285,536 | 276,347 | 270,149 | 265,481 | 261,861 | 257,168 | 251,622 | 248,093 | 243,595 | 240,533 | 238,832 | 237,098 | 235,426 | 235,192 | 235,861 | 45-49 | |
| 50-54 | 239,669 | 157,043 | 162,099 | 167,154 | 172,209 | 171,171 | 170,133 | 169,095 | 173,308 | 186,066 | 197,258 | 197,594 | 197,929 | 235,772 | 210,996 | 209,712 | 191,481 | 166,766 | 142,978 | 152,623 | 122,902 | 133,847 | 148,558 | 173,305 | 238,587 | 280,513 | 225,263 | 325,345 | 198,667 | 337,273 | 278,136 | 219,000 | 303,494 | 222,000 | 380,833 | 223,333 | 449,231 | 288,235 | 417,273 | 277,894 | 265,882 | 271,916 | 262,804 | 252,564 | 240,886 | 229,567 | 216,684 | 208,601 | 212,912 | 225,738 | 242,948 | 265,432 | 283,757 | 294,709 | 302,490 | 307,254 | 308,001 | 307,102 | 301,678 | 290,771 | 280,161 | 271,378 | 269,285 | 264,459 | 260,489 | 255,410 | 249,572 | 243,815 | 239,376 | 236,410 | 50-54 | |
General,specific and total fertility rates |
Average 1950-2018 | 1950 | 1951 | 1952 | 1953 | 1954 | 1955 | 1956 | 1957 | 1958 | 1959 | 1960 | 1961 | 1962 | 1963 | 1964 | 1965 | 1966 | 1967 | 1968 | 1969 | 1970 | 1971 | 1972 | 1973 | 1974 | 1975 | 1976 | 1977 | 1978 | 1979 | 1980 | 1981 | 1982 | 1983 | 1984 | 1985 | 1986 | 1987 | 1988 | 1989 | 1990 | 1991 | 1992 | 1993 | 1994 | 1995 | 1996 | 1997 | 1998 | 1999 | 2000 | 2001 | 2002 | 2003 | 2004 | 2005 | 2006 | 2007 | 2008 | 2009 | 2010 | 2011 | 2012 | 2013 | 2014 | 2015 | 2016 | 2017 | 2018 | 2019 | General,specific and total fertility rates |
General fertility rate |
54.04 | 97.93 | 86.45 | 95.36 | 89.03 | 88.98 | 81.36 | 76.05 | 68.14 | 67.98 | 66.05 | 68.83 | 66.71 | 63.40 | 61.87 | 58.68 | 59.04 | 56.29 | 54.83 | 53.25 | 53.49 | 50.90 | 51.51 | 52.91 | 53.22 | 54.67 | 56.19 | 56.94 | 55.92 | 56.04 | 55.36 | 54.85 | 52.30 | 54.72 | 56.42 | 55.71 | 53.08 | 52.01 | 51.20 | 51.32 | 48.15 | 47.62 | 49.84 | 47.69 | 47.96 | 46.19 | 46.34 | 44.17 | 42.75 | 41.14 | 39.15 | 40.26 | 43.06 | 43.14 | 44.16 | 44.17 | 41.23 | 40.96 | 39.63 | 40.52 | 41.56 | 40.72 | 40.18 | 41.62 | 40.99 | 41.99 | 41.92 | 41.75 | 42.22 | 41.99 | General fertility rate | |
| Under 15 | 0.29 | 0.09 | 0.08 | 0.09 | 0.13 | 0.14 | 0.13 | 0.08 | 0.13 | 0.10 | 0.17 | 0.16 | 0.16 | 0.09 | 0.18 | 0.20 | 0.20 | 0.33 | 0.32 | 0.36 | 0.23 | 0.42 | 0.52 | 0.53 | 0.43 | 0.32 | 0.67 | 0.56 | 0.43 | 0.53 | 0.46 | 0.54 | 0.62 | 0.74 | 0.43 | 0.40 | 0.40 | 0.11 | 0.66 | 0.32 | 0.25 | 0.40 | 0.19 | 0.32 | 0.33 | 0.35 | 0.25 | 0.29 | 0.36 | 0.22 | 0.21 | 0.27 | 0.29 | 0.28 | 0.22 | 0.24 | 0.29 | 0.27 | 0.34 | 0.31 | 0.45 | 0.33 | 0.28 | 0.36 | 0.25 | 0.31 | 0.21 | 0.28 | 0.26 | 0.29 | Under 15 | |
| 15-19 | 46.30 | 48.66 | 44.11 | 50.51 | 49.40 | 51.92 | 49.75 | 48.16 | 50.22 | 52.34 | 59.23 | 64.32 | 65.66 | 61.27 | 58.59 | 53.68 | 57.17 | 63.70 | 65.57 | 66.97 | 69.32 | 63.85 | 64.25 | 66.89 | 65.05 | 64.63 | 64.75 | 62.56 | 59.88 | 59.75 | 58.61 | 56.93 | 51.12 | 54.01 | 53.33 | 53.70 | 53.70 | 52.27 | 49.99 | 51.40 | 47.23 | 44.46 | 45.69 | 41.22 | 41.31 | 38.87 | 36.30 | 33.53 | 31.78 | 29.03 | 26.50 | 26.44 | 26.97 | 25.41 | 25.25 | 24.57 | 23.08 | 22.77 | 22.28 | 22.04 | 21.66 | 20.01 | 18.96 | 19.17 | 18.05 | 17.88 | 16.39 | 15.35 | 15.17 | 14.00 | 15-19 | |
| 20-24 | 135.21 | 203.67 | 181.10 | 202.51 | 189.04 | 192.79 | 179.19 | 168.54 | 153.72 | 157.86 | 157.05 | 167.75 | 162.62 | 162.77 | 163.28 | 163.15 | 170.12 | 160.96 | 161.16 | 159.76 | 157.39 | 147.98 | 150.35 | 149.23 | 148.83 | 148.37 | 152.75 | 152.68 | 150.96 | 150.98 | 152.66 | 152.79 | 143.51 | 150.98 | 154.04 | 152.28 | 147.64 | 146.02 | 145.01 | 146.35 | 138.31 | 137.48 | 142.18 | 136.70 | 135.84 | 127.02 | 125.04 | 116.92 | 110.36 | 104.52 | 96.48 | 98.09 | 98.23 | 94.71 | 94.53 | 90.75 | 82.46 | 78.79 | 74.34 | 72.69 | 69.82 | 64.90 | 62.89 | 63.44 | 60.48 | 61.34 | 58.20 | 57.57 | 57.57 | 56.07 | 20-24 | |
| 25-29 | 107.24 | 178.77 | 154.05 | 166.68 | 153.67 | 152.82 | 138.77 | 128.55 | 112.08 | 112.79 | 108.26 | 113.92 | 110.34 | 108.76 | 109.99 | 107.16 | 110.46 | 105.80 | 102.25 | 99.16 | 96.45 | 90.14 | 92.64 | 92.43 | 95.96 | 99.34 | 99.60 | 102.43 | 99.90 | 100.94 | 101.94 | 100.66 | 98.53 | 102.48 | 106.27 | 108.13 | 103.71 | 104.19 | 105.54 | 105.83 | 99.84 | 101.55 | 109.49 | 106.35 | 106.64 | 104.99 | 108.56 | 105.20 | 102.84 | 99.46 | 95.36 | 97.36 | 105.69 | 104.61 | 105.06 | 103.33 | 94.47 | 93.10 | 88.56 | 90.63 | 91.69 | 91.39 | 89.81 | 91.79 | 90.41 | 91.28 | 91.41 | 91.61 | 91.99 | 91.03 | 25-29 | |
| 30-34 | 55.25 | 115.06 | 85.03 | 79.04 | 90.43 | 82.86 | 70.17 | 63.13 | 53.85 | 52.52 | 48.73 | 49.58 | 48.78 | 47.03 | 47.07 | 45.34 | 45.72 | 44.62 | 43.55 | 43.94 | 43.62 | 42.61 | 40.41 | 40.02 | 40.07 | 40.66 | 40.86 | 41.76 | 43.00 | 44.50 | 43.90 | 44.50 | 42.81 | 43.31 | 45.74 | 46.30 | 44.23 | 43.56 | 44.86 | 44.19 | 42.26 | 44.07 | 48.83 | 48.61 | 51.78 | 52.24 | 56.05 | 54.54 | 53.78 | 52.88 | 51.24 | 52.85 | 60.03 | 62.98 | 65.20 | 66.81 | 63.07 | 63.68 | 62.80 | 65.15 | 70.34 | 69.81 | 72.83 | 77.20 | 77.12 | 80.19 | 82.37 | 82.08 | 83.21 | 84.87 | 30-34 | |
| 35-39 | 21.27 | 50.29 | 51.14 | 63.59 | 41.19 | 37.86 | 32.78 | 32.38 | 26.83 | 24.04 | 21.59 | 21.05 | 19.90 | 17.89 | 17.73 | 16.65 | 15.93 | 15.53 | 15.46 | 15.01 | 15.04 | 13.79 | 13.91 | 13.86 | 14.56 | 14.80 | 14.60 | 14.83 | 14.19 | 13.42 | 13.39 | 13.17 | 13.18 | 13.96 | 15.03 | 15.63 | 14.72 | 14.39 | 14.49 | 13.86 | 13.98 | 13.81 | 14.84 | 14.99 | 16.02 | 17.05 | 17.94 | 18.26 | 19.00 | 18.35 | 18.17 | 18.45 | 20.58 | 21.53 | 23.02 | 23.89 | 22.74 | 23.63 | 23.77 | 26.14 | 29.07 | 29.56 | 29.93 | 32.04 | 33.06 | 35.06 | 36.73 | 38.10 | 40.04 | 41.34 | 35-39 | |
| 40-44 | 5.11 | 21.85 | 19.71 | 20.88 | 12.04 | 11.95 | 11.35 | 9.36 | 7.69 | 8.09 | 8.27 | 7.24 | 8.30 | 6.90 | 5.93 | 5.20 | 4.44 | 4.03 | 3.90 | 3.79 | 3.53 | 3.24 | 3.25 | 3.30 | 3.26 | 3.24 | 3.30 | 3.35 | 3.39 | 3.06 | 3.02 | 3.03 | 2.75 | 2.93 | 2.80 | 2.76 | 2.78 | 2.90 | 3.15 | 3.03 | 3.03 | 2.96 | 3.14 | 3.09 | 3.35 | 3.33 | 3.13 | 3.58 | 3.16 | 3.30 | 3.05 | 3.44 | 3.64 | 3.98 | 4.28 | 4.49 | 4.03 | 3.98 | 3.77 | 4.26 | 4.66 | 5.07 | 5.47 | 5.96 | 6.10 | 6.70 | 7.20 | 7.14 | 8.32 | 8.82 | 40-44 | |
| 45-49 | 0.63 | 4.66 | 4.36 | 4.43 | 3.17 | 2.66 | 2.25 | 1.78 | 1.46 | 1.48 | 0.98 | 0.89 | 1.06 | 1.00 | 1.21 | 1.29 | 1.11 | 0.90 | 0.87 | 0.72 | 0.44 | 0.35 | 0.34 | 0.34 | 0.26 | 0.28 | 0.27 | 0.30 | 0.33 | 0.27 | 0.27 | 0.30 | 0.31 | 0.21 | 0.29 | 0.27 | 0.26 | 0.25 | 0.27 | 0.19 | 0.22 | 0.22 | 0.20 | 0.19 | 0.28 | 0.27 | 0.22 | 0.19 | 0.21 | 0.23 | 0.24 | 0.23 | 0.17 | 0.20 | 0.22 | 0.18 | 0.16 | 0.24 | 0.25 | 0.28 | 0.25 | 0.35 | 0.36 | 0.47 | 0.49 | 0.58 | 0.40 | 0.39 | 0.64 | 0.64 | 45-49 | |
| 50 and over | 0.13 | 1.55 | 1.45 | 1.39 | 0.65 | 0.57 | 0.49 | 0.28 | 0.26 | 0.19 | 0.10 | 0.07 | 0.25 | 0.23 | 0.20 | 0.20 | 0.19 | 0.32 | 0.27 | 0.25 | 0.22 | 0.25 | 0.18 | 0.13 | 0.07 | 0.05 | 0.10 | 0.04 | 0.06 | 0.07 | 0.06 | 0.05 | 0.05 | 0.04 | 0.02 | 0.06 | 0.02 | 0.03 | 0.02 | 0.04 | 0.04 | 0.03 | 0.05 | 0.07 | 0.13 | 0.06 | 0.05 | 0.03 | 0.05 | 0.04 | 0.05 | 0.05 | 0.03 | 0.02 | 0.04 | 0.04 | 0.03 | 0.05 | 0.03 | 0.03 | 0.03 | 0.03 | 0.05 | 0.06 | 0.06 | 0.08 | 0.02 | 0.03 | 0.06 | 0.11 | 50 and over | |
Total fertility rate (15–49) |
1.86 | 3.11 | 2.70 | 2.94 | 2.69 | 2.66 | 2.42 | 2.26 | 2.03 | 2.05 | 2.02 | 2.12 | 2.08 | 2.03 | 2.02 | 1.96 | 2.02 | 1.98 | 1.96 | 1.95 | 1.93 | 1.81 | 1.83 | 1.83 | 1.84 | 1.86 | 1.88 | 1.89 | 1.86 | 1.86 | 1.87 | 1.86 | 1.76 | 1.84 | 1.89 | 1.90 | 1.84 | 1.82 | 1.82 | 1.82 | 1.72 | 1.72 | 1.82 | 1.76 | 1.78 | 1.72 | 1.74 | 1.66 | 1.61 | 1.54 | 1.46 | 1.48 | 1.58 | 1.57 | 1.59 | 1.57 | 1.45 | 1.43 | 1.38 | 1.41 | 1.44 | 1.41 | 1.40 | 1.45 | 1.43 | 1.47 | 1.46 | 1.46 | 1.48 | 1.48 | Total fertility rate (15–49) |
Ethnic groups
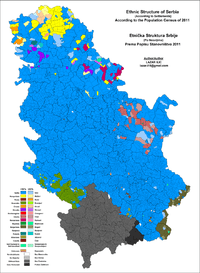
Situated in the middle of the Balkans, Serbia is home to many different ethnic groups. According to the 2011 census, Serbs are the largest ethnic group in the country and constitute 83.3% of population. Hungarians are the largest ethnic minority in Serbia, concentrated predominately in northern Vojvodina and representing 3.5% of the country's population (13% in Vojvodina). Roma people constitute 2% of the total population but unofficial estimates put their actual number to be twice or three as high.[18] Bosniaks are third largest ethnic minority mainly inhabiting Raška region in southwestern part of the country. Other minority groups include Croats (0.9%), Slovaks (0.8%), Albanians, Montenegrins (0.5%), Romanians (0.4%), Macedonians (0.3%), and Bulgarians (0.3%). The Chinese[19][20] and Arabs, are the only two significant immigrant minorities.
| Ethnic group |
census 1948 | census 1953 | census 1961 | census 1971 | census 1981 | census 1991 | census 2002[21] | census 2011 | ||||||||
|---|---|---|---|---|---|---|---|---|---|---|---|---|---|---|---|---|
| Number | % | Number | % | Number | % | Number | % | Number | % | Number | % | Number | % | Number | % | |
| Serbs | 4,651,819 | 80.2 | 4,963,070 | 80.4 | 5,477,670 | 82.0 | 5,788,547 | 80.4 | 5,972,661 | 77.3 | 6,616,917 | 80.3 | 6,212,838 | 82.9 | 5,988,150 | 83.3 |
| Hungarians | 433,618 | 7.5 | 441,748 | 7.2 | 449,377 | 6.7 | 430,145 | 6.0 | 390,321 | 5.0 | 337,479 | 4.5 | 293,299 | 3.9 | 253,899 | 3.5 |
| Roma | 40,951 | 0.7 | 46,896 | 0.8 | 6,624 | 0.1 | 35,301 | 0.5 | 76,833 | 1.0 | 90,853 | 1.2 | 108,193 | 1.4 | 147,604 | 2.1 |
| Muslims | 7,636 | 0.1 | 74,840 | 1.2 | 85,441 | 1.3 | 127,973 | 1.8 | 156,604 | 2.0 | 176,401 | 2.3 | 19,503 | 0.3 | 22,301 | 0.3 |
| Bosniaks | 136,087 | 1.8 | 145,278 | 2.0 | ||||||||||||
| Croats | 164,574 | 2.8 | 167,045 | 2.7 | 189,158 | 2.8 | 176,649 | 2.5 | 140,650 | 1.8 | 97,344 | 1.2 | 70,602 | 0.9 | 57,900 | 0.8 |
| Slovaks | 73,138 | 1.3 | 75,006 | 1.2 | 77,816 | 1.2 | 76,707 | 1.1 | 73,170 | 0.9 | 65,363 | 0.9 | 59,021 | 0.8 | 52,750 | 0.7 |
| Albanians | 33,769 | 0.6 | 40,954 | 0.7 | 53,167 | 0.8 | 68,593 | 1.0 | 76,296 | 1.0 | 74,303 | 1.0 | 61,647 | 0.8 | 5,809 | 0.08 |
| Montenegrins | 46,810 | 0.8 | 54,718 | 0.9 | 67,165 | 1.0 | 93,705 | 1.3 | 120,438 | 1.6 | 117,761 | 1.6 | 69,049 | 0.9 | 38,527 | 0.5 |
| Vlachs | 93,440 | 1.6 | 28,047 | 0.5 | 1,367 | 0.0 | 14,719 | 0.2 | 25,592 | 0.3 | 15,675 | 0.2 | 40,054 | 0.5 | 35,330 | 0.5 |
| Romanians | 63,112 | 1.1 | 59,689 | 1.0 | 59,492 | 0.9 | 57,399 | 0.8 | 53,676 | 0.7 | 37,818 | 0.5 | 34,576 | 0.5 | 29,332 | 0.4 |
| Yugoslavs | 14,873 | 0.2 | 122,904 | 1.7 | 439,265 | 5.7 | 312,595 | 4.1 | 80,721 | 1.1 | 23,303 | 0.3 | ||||
| Macedonians | 17,391 | 0.3 | 26,302 | 0.4 | 35,146 | 0.5 | 41,627 | 0.6 | 47,930 | 0.6 | 44,028 | 0.6 | 25,847 | 0.3 | 22,755 | 0.3 |
| Bulgarians | 59,395 | 1.0 | 60,146 | 1.0 | 58,243 | 0.9 | 53,536 | 0.7 | 33,294 | 0.4 | 26,416 | 0.3 | 20,497 | 0.3 | 18,543 | 0.3 |
| Others[22]/unspecified | 114,493 | 2.0 | 132,549 | 2.1 | 102,700 | 1.5 | 115,093 | 1.6 | 122,506 | 1.6 | 97,953 | 1.3 | 266,067 | 3.5 | 368,136 | 5.1 |
| Total | 5,936,223 | 6,171,010 | 6,678,239 | 7,202,898 | 7,729,236 | 8,010,906 | 7,498,001 | 7,186,862 | ||||||||
Religion

Serbia is largely a homogeneous Eastern Orthodox nation, with Catholic and Muslim minorities, among other smaller confessions.[23]
Orthodox Christians number 6,079,396 or 84.5% of country's population. The Serbian Orthodox Church is the largest and traditional church of the country, adherents of which are overwhelmingly Serbs. Other Orthodox Christian communities in Serbia include Montenegrins, Romanians, Vlachs, Macedonians and Bulgarians.
There are 356,957 Roman Catholics in Serbia, roughly 5% of the population, mostly in Vojvodina (especially its northern part) which is home to minority ethnic groups such as Hungarians, Croats, Bunjevci, Albanians, as well as to some Slovaks and Czechs.[23] Protestantism accounts for about 1% of the country's population, chiefly among Slovaks in Vojvodina as well as among Reformist Hungarians.
Muslims, with 222,282 or 3% of population, form third largest religious group. Islam has a strong historic following in the southern regions of Serbia, primarily in southern Raška. Bosniaks are the largest Islamic community in Serbia; estimates are that some third of country's Roma people are Muslim.
Languages
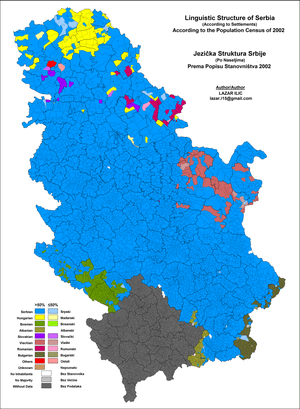
The official language is Serbian, member of the South Slavic group of languages, and is native to 6,330,919 or 88% of the population.[24] Recognized minority languages are: Hungarian (mother tongue to 243,146 people or 3.4% of population), Slovak, Romanian, Bulgarian and Rusyn as well as Bosnian and Croatian which are completely mutual intelligible with Serbian. All these languages are in official use in municipalities or cities where more than a 15% of population consists of national minority.[25] In Vojvodina, provincial administration uses, besides Serbian, five other languages (Hungarian, Slovak, Romanian, Croatian and Rusyn).
Largest cities
| Name | Population (2011) |
|---|---|
| Belgrade | 1,233,796 |
| Novi Sad | 277,522 |
| Niš | 187,544 |
| Kragujevac | 150,835 |
| Subotica | 105,681 |
Migration
Emigration
Immigration
Foreign citizens in Serbia in 2016.[26]
| Temporary residence | Permanent residence | |||
|---|---|---|---|---|
| # | Country | Population | Country | Population |
| 1 | 3,280 | 1,232 | ||
| 2 | 2,677 | 1,162 | ||
| 3 | 1,656 | 620 | ||
| 4 | 1,386 | 516 | ||
| 5 | 1,031 | 340 | ||
| Total | 19,929 | Total | 6,684 |
Other demographic data
Data that follows has been derived from the Ministry of Demography and Population Policy of Serbia Official website[27]
- Median age of the population
- Total: 43.16 years (2018)
- Male: 41.73 years
- Female: 44.53 years
- Mother's mean age at first birth
- 28.4 years (2018)
- Number of marriages per 1000 inhabitants
- 5.2 marriages/1,000 population (2018)
- Median age of the groom at the time of marriage
- 34.2 years (2018)
- Median age of the bride at the time of marriage
- 31.1 years (2018)
- Number of divorces per 1000 marriages
- 275.2 divorces/1,000 marriages (2018)
Education
According to 2011 census, literacy in Serbia stands at 98% of population while computer literacy is at 49% (complete computer literacy is at 34.2%).[28] Same census showed the following levels of education: 16.2% of inhabitants have higher education (10.6% have bachelors or master's degrees, 5.6% have an associate degree), 49% have a secondary education, 20.7% have an elementary education, and 13.7% have not completed elementary education.[29]
Health
The life expectancy in Serbia at birth is 74.8 years, 71.9 for males and 77.7 for females.[30] Serbia has a comparatively old overall population (among the 10 oldest in the world), with the average age of 42.9 years.[31]
| Period | Life expectancy in Years[32] |
|---|---|
| 1950–1955 | 59.12 |
| 1955–1960 | |
| 1960–1965 | |
| 1965–1970 | |
| 1970–1975 | |
| 1975–1980 | |
| 1980–1985 | |
| 1985–1990 | |
| 1990–1995 | |
| 1995–2000 | |
| 2000–2005 | |
| 2005–2010 | |
| 2010–2015 |
See also
- Demographic history of Serbia
- Demographic history of Vojvodina
- Demographic history of Kosovo
- Demographics of the Socialist Federal Republic of Yugoslavia
- Yugoslavia § Demographics
- Demographics of Serbia and Montenegro
- Demographics of Albania
- Demographics of Bosnia and Herzegovina
- Demographics of Bulgaria
- Demographics of Croatia
- Demographics of Hungary
- Demographics of Kosovo
- Demographics of Montenegro
- Demographics of North Macedonia
- Demographics of Romania
References
- "Population" (PDF). Stat.gov.rs. Retrieved 29 June 2018.
- "Macrotrends".
- "Worldometers.info".
- "Tadviser".
- Max Roser (2014), "Total Fertility Rate around the world over the last centuries", Our World In Data, Gapminder Foundation
- "Demographic indicators".
- "Demography statistics 1990,Yugoslavia" (PDF).
- "Publications of Serbia".
- "Eurostat database".
- "Demographic statistics 2004" (PDF).
- "Demographic Yearbook in the Republic of Serbia, 2010" (PDF).
- "Demographic Yearbook 2018" (PDF).
- "Monthly Statistical Bulletin, December 2019" (PDF).
- "Births and Deaths".
- "First results about live births and deaths by region 2019/2020.(in Serbian only)".
- "Statistical Office of the Republic of Serbia" (PDF). Retrieved 6 October 2018.
- "Vesti – Zvaničan broj Roma u Srbiji". B92.net. 7 April 2009.
- "Chinese Migrants Use Serbia as Gate to Europe". Abcnews.go.com. Retrieved 2016-09-26.
- V. Mijatović – B. Hadžić. "I Kinezi napuštaju Srbiju | Reportaže". Novosti.rs. Retrieved 2016-09-29.
- "Official Results of Serbian Census 2003–Population" (PDF). Archived from the original (PDF) on 2013-10-18. Retrieved 2009-02-19. (441 KB), pp. 12-13 (in Serbian)
- "2011 Census of Population, Households and Dwellings in the Republic of Serbia" (PDF). Pod2.stat.gov.rs. Retrieved 2016-09-29.
- "Становништво, домаћинства и породице – база : Попис у Србији 2011". Popis2011.stat.rs. Retrieved 2016-09-29.
- "2011 Census of Population, Households and Dwellings in the Republic of Serbia" (PDF). Pod2.stat.gov.rs. Archived from the original (PDF) on 2014-07-15. Retrieved 2016-09-29.
- "EUROPEAN CHARTER FOR REGIONAL OR MINORITY LANGUAGES" (PDF). Coe.int. Retrieved 2016-09-29.
- "Archived copy" (PDF). Archived from the original (PDF) on 2018-07-08. Retrieved 2018-07-07.CS1 maint: archived copy as title (link)
- "АКТУЕЛНИ ДЕМОГРАФСКИ ПОКАЗАТЕЉИ (Current Demography)". Ministry of Demography and Population Policy of Serbia Official website.
- "2011 Census of Population, Households and Dwellings in the Republic of Serbia" (PDF). Pod2.stat.gov.rs. Archived from the original (PDF) on 2013-07-29. Retrieved 2016-09-29.
- "Education stats in Serbia". Webrzs.stat.gov.rs. Retrieved 20 March 2013.
- "Витални догађаји, 2016". Stat.gov.rs. Retrieved 29 August 2017.
- "Процене становништва, 2016". Stat.gov.rs. Retrieved 29 August 2017.
- "World Population Prospects - Population Division - United Nations". esa.un.org. Retrieved 2018-08-26.
| Wikimedia Commons has media related to Demographics of Serbia. |
Sources
- "2011 Census of Population, Households and Dwellings in the Republic of Serbia: Ethnicity" (PDF). Press conference. RZS. 29 November 2012.
Further reading
- Ocić, Časlav (2006). "Kosovo and Metohia: Ethnodemographic Changes from the End of World War II to 1991". Срби на Косову и у Метохији: Зборник радова са научног скупа (PDF). Београд: Српска академија наука и уметности. pp. 441–460. Archived from the original (PDF) on 2016-03-25. Retrieved 2017-08-01.CS1 maint: ref=harv (link)
- Carte ethnographique serbe avec les limites méridionales de la vieille Serbie et celles de la Serbie du Tsar Douchan (in French). Belgrade: Mita Staïtch, librarie de la Cour. 1903. (PDF)
 Ethnic map without Kosovo (2011) | ||
| ||