Demographics of Nigeria
Nigeria is one of the most densely populated countries in Africa, with approximately 200 million people in an area of 923,768 km2 (356,669 sq mi),[1] and is also the country with the largest population in Africa[2] and the seventh largest population in the world.[3]
Approximately 50% of Nigerians are urban dwellers, with the rate of urbanization being estimated at 4.3%.[2] Nigeria is home to over 250 ethnic groups, with over 500 languages,[2] and the variety of customs, and traditions among them gives the country great cultural diversity. The three largest ethnic groups are the Hausa 27.4% of the population; along with the Yoruba 21% and Igbo 22.1%.[2] The Efik, Ibibio, Annang, and Ijaw constitute other Southeastern populations. The Urhobo-Isoko, Edo and Itsekiri constitute Nigerian's Midwest.[4]
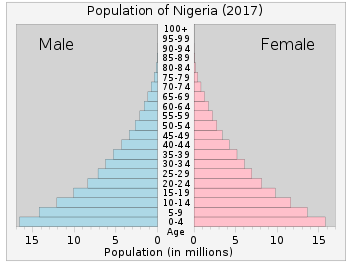
Most of the population is a young population, with 42.54% between the ages of 0–14.[2][5] There is also a very high dependency ratio of the country at 88.2 dependants per 100 non-dependants.[2]
Three of the main religious groups are Muslim at 45%, Christian at 45% and other indigenous beliefs at 10%.[3] The predominantly Christian Igbo are found in the southeast[6]. Roman Catholicism is the largest Christian denomination in Igboland, but Anglicanism is also strong, as are Pentecostal and other Evangelical denominations.
Persons of different ethnic backgrounds most commonly communicate in English, although knowledge of two or more Nigerian languages is widespread. Hausa, Igbo and Yoruba are the most widely used Nigerian languages. Nigerian Pidgin is used widely as an unofficial medium of communication especially in the Nigerian cities of Warri, Sapele, Ughelli, Benin and Port Harcourt[7].
Population
| Historical population | ||
|---|---|---|
| Year | Pop. | ±% p.a. |
| 1952 | 30,403,305 | — |
| 1963 | 54,959,426 | +5.53% |
| 1991 | 88,992,220 | +1.74% |
| 2006 | 140,431,790 | +3.09% |
| 2011 | 162,471,000 | +2.96% |
| 2013 | 174,507,539 | +3.64% |
| 2015 | 182,202,000 | +2.18% |
| 2017 | 191,836,000 | +2.61% |


Nigeria's population has been increasing rapidly for at least the last 5 decades due to very high birth rates, quadrupling its population during this time. Growth was fastest in the 1980s, after child mortality had dropped rapidly, and has slowed slightly since then as the birth rate has declined slightly. According to the 2017 revision of the World Population Prospects the total population was 185,989,640 in 2016, compared to only 37,860,000 in 1950. The proportion of children under the age of 15 in 2010 was 44.0%, 53.2% was between 15 and 65 years of age, while 2.7% was 65 years or older. There is a large population momentum, with 3.2 percent growth rate leading to the projected population.[8][2][9]
Abuja has not successfully implemented family planning programs to reduce and space births because of a lack of political will, government financing, and the availability and affordability of services and products, as well as a cultural preference for large families. Increased educational attainment, especially among women, and improvements in health care are needed to encourage and to better enable parents to opt for smaller families.[3]
The former Nigeria's Chairman of National Population Commission, Eze Duruiheoma, delivering Nigeria's statement in New York on Sustainable Cities, Human Mobility and International Migration in the 51st Session of Commission on Population and Development, said that "Nigeria remains the most populous in Africa, the seventh globally with an estimated population of over 198 million. The recent World Population Prospects predicts that by 2050, Nigeria will become the third most populated country in the world. Over the last 50 years, the Nigeria's urban population has grown at an average annual growth rate of more than 6.5 per cent without commensurate increase in social amenities and infrastructure." He also stated that the population "grew substantially from 17.3 in 1967 to 49.4 per cent in 2017."[10]
| Total population | Population aged 0–14 (%) | Population aged 15–64 (%) | Population aged 65+ (%) | |
|---|---|---|---|---|
| 1950 | 37 860 000 | 41.7 | 55.3 | 3.0 |
| 1955 | 41 122 000 | 41.6 | 55.6 | 2.8 |
| 1960 | 45 212 000 | 41.6 | 55.6 | 2.8 |
| 1965 | 50 239 000 | 41.9 | 55.2 | 2.9 |
| 1970 | 56 132 000 | 42.6 | 54.6 | 2.8 |
| 1975 | 63 566 000 | 43.4 | 53.8 | 2.8 |
| 1980 | 73 698 000 | 44.0 | 53.2 | 2.8 |
| 1985 | 83 902 000 | 45.0 | 52.2 | 2.8 |
| 1990 | 95 617 000 | 44.9 | 52.3 | 2.9 |
| 1995 | 108 425 000 | 44.1 | 53.0 | 2.9 |
| 2000 | 122 877 000 | 43.5 | 53.7 | 2.8 |
| 2005 | 139 586 000 | 43.6 | 53.7 | 2.7 |
| 2010 | 159 708 000 | 44.0 | 53.2 | 2.7 |
Fertility and births
Total Fertility Rate (TFR)(Wanted TFR) and Crude Birth Rate (CBR):[11][12] [13] [14][15]
| Year | CBR (Total) | TFR (Total) | CBR (Urban) | TFR (Urban) | CBR (Rural) | TFR (Rural) |
|---|---|---|---|---|---|---|
| 1960 | 47 | 6.35 | ||||
| 1965–66 | 45.9 | 6.44 | ||||
| 1967–69 | 46.1 | 6.42 | ||||
| 1970 | 46.3 | 6.47 | ||||
| 1971–73 | 46.7 | 6.57 | ||||
| 1975 | 47.2 | 6.71 | ||||
| 1978–82 | 47 | 6.78 | ||||
| 1978–80 | 47 | 6.76 | ||||
| 1981–82 | 46.68 | 6.78 | ||||
| 1983–86 | 45.67 | 6.7 | ||||
| 1987–90 | 45.9 | 6.57 | ||||
| 1990 | 44.2 | 6.49 (5.8) | 34 | 5.033 (4.8) | 40 | 6.326 (6.1) |
| 1999 | 43.2 | 6.13 | 35.6 | 4.50 | 38.5 | 5.44 |
| 2003 | 42.8 | 6.04 (5.3) | 36.3 | 4.9 (4.6) | 44.5 | 6.1 (5.7) |
| 2004–07 | 42.4 | 5.97 | ||||
| 2008 | 41.8 | 5.9 (5.3) | 36.8 | 4.7 (4.4) | 42.5 | 6.3 (5.8) |
| 2013 | 40,2 | 5.5 (4.8) | 35 | 4.7 (4.1) | 42 | 6.2 (5.3) |
| 2014–15 | 39.5 | 5.57 | ||||
| 2015–18[16] | 38 | 5.3 | 34 | 4.5 | 42 | 5.9 |
| Year | TFR |
|---|---|
| 1981–1982 | 6,8 |
| 1990 | 6,4 |
| 2003 | 6,0 |
| 2008 | 5,9 |
| 2013 | 5,7 |
| 2015-18 | 5,3 |
| Variable | TFR (Wanted TFR) (2003) | TFR (Wanted TFR) (2008) | TFR (Wanted TFR) (2013) | TFR (Wanted TFR) (2015-18) |
|---|---|---|---|---|
| Nigeria | 5.7 (5.3) | 5.7 (5.3) | 5.5 (4.8) | 5.3 (4.8) |
| Urban | 4.9 (4.6) | 4.7 (4.4) | 4.7 (4.1) | 4.5 (4.0) |
| Rural | 6.1 (5.7) | 6.3 (5.8) | 6.2 (5.3) | 5.9 (5.4) |
| Region – North Central | 5.7 | 5.4 | 5.3 | 5.0 (4.7) |
| Region – North East | 7.0 | 7.2 | 6.3 | 6.1 (5.6) |
| Region – North West | 6.7 | 7.3 | 6.7 | 6.6 (5.9) |
| Region – South East | 4.1 | 4.8 | 4.7 | 4.7 (4.3) |
| Region – South South | 4.6 | 4.7 | 4.3 | 4.0 (3.6) |
| Region – South West | 4.1 | 4.5 | 4.6 | 3.9 (3.5) |
Fertility data as of 2013 (DHS Program):[17]
| State | Total fertility rate | Percentage of women age 15–49 currently pregnant | Mean number of children ever born to women age 40–49 |
|---|---|---|---|
| Abuja | 8.5 | 8.3 | 4.7 |
| Benue | 5.2 | 13.0 | 6.8 |
| Kogi | 4.2 | 9.4 | 5.7 |
| Kwara | 5.1 | 7.2 | 5.2 |
| Nasarawa | 5.4 | 10.8 | 5.8 |
| Niger | 6.1 | 14.8 | 5.8 |
| Plateau | 5.4 | 11.2 | 5.6 |
| Adamawa | 5.8 | 15.6 | 6.7 |
| Bauchi | 8.1 | 16.9 | 8.4 |
| Borno | 4.7 | 12.7 | 5.2 |
| Gombe | 7.0 | 14.3 | 7.9 |
| Taraba | 6.0 | 10.6 | 7.1 |
| Yobe | 6.6 | 13.4 | 7.4 |
| Jigawa | 7.6 | 15.1 | 7.6 |
| Kaduna | 4.1 | 21.0 | 5.7 |
| Kano | 6.8 | 12.6 | 7.7 |
| Katsina | 7.4 | 17.3 | 8.4 |
| Kebbi | 6.7 | 16.9 | 8.2 |
| Sokoto | 7.0 | 14.1 | 7.3 |
| Zamfara | 8.4 | 17.0 | 8.7 |
| Abia | 4.2 | 7.3 | 5.0 |
| Anambra | 4.2 | 6.0 | 4.7 |
| Ebonyi | 5.3 | 9.1 | 7.1 |
| Enugu | 4.8 | 8.4 | 5.9 |
| Imo | 4.8 | 8.3 | 5.0 |
| Akwa Ibom | 3.9 | 5.3 | 5.4 |
| Bayelsa | 4.5 | 11.3 | 6.1 |
| Cross River | 5.4 | 9.1 | 5.5 |
| Delta | 4.1 | 10.6 | 5.6 |
| Edo | 4.4 | 6.3 | 5.7 |
| Rivers | 3.8 | 9.5 | 4.9 |
| Ekiti | 4.3 | 7.0 | 5.2 |
| Lagos | 4.1 | 7.2 | 4.3 |
| Ogun | 5.4 | 10.6 | 4.9 |
| Ondo | 5.2 | 9.1 | 5.2 |
| Osun | 4.1 | 6.8 | 4.3 |
| Oyo | 4.5 | 11.9 | 5.1 |
Source: Demographic and Health Surveys (DHS)[18]
Fertility rate by state
| Variable | TFR (2008) | TFR (2011)* | TFR (2013) | TFR (2016)* |
|---|---|---|---|---|
| Nigeria | 5.7 | 5.7 | 5.5 | 5.8 |
| Urban | 4.7 | 4.7 | 4.7 | 4.9 |
| Rural | 6.3 | 6.3 | 6.2 | 6.3 |
| Region – North Central | 5.4 | 4.9 | 5.3 | 5.3 |
| Abuja (FCT) | 4.0 | 3.8 | 4.5 | 4.6 |
| Benue | 5.9 | 4.9 | 5.2 | 4.8 |
| Kogi | 4.2 | 3.9 | 4.2 | 3.7 |
| Kwara | 4.5 | 5.1 | 5.1 | 4.4 |
| Nasarawa | 4.7 | 5.5 | 5.4 | 5.7 |
| Niger | 7.5 | 6.1 | 6.1 | 6.4 |
| Plateau | 5.3 | 4.5 | 5.4 | 5.6 |
| Region – North East | 7.2 | 6.7 | 6.3 | 6.4 |
| Adamawa | 6.8 | 5.6 | 5.8 | 5.5 |
| Bauchi | 8.1 | 8.6 | 8.1 | 6.8 |
| Borno | 7.1 | 6.7 | 4.7 | 6.1 |
| Gombe | 7.4 | 5.6 | 7.0 | 7.3 |
| Taraba | 5.9 | 5.3 | 6.0 | 5.5 |
| Yobe | 7.5 | 7.9 | 6.6 | 6.8 |
| Region – North West | 7.3 | 7.2 | 6.7 | 7.3 |
| Jigawa | 7.1 | 6.7 | 7.6 | 8.5 |
| Kaduna | 6.3 | 7.9 | 4.1 | 5.6 |
| Kano | 8.1 | 7.5 | 6.8 | 7.7 |
| Katsina | 7.2 | 8.2 | 7.4 | 7.5 |
| Kebbi | 6.0 | 7.0 | 6.7 | 7.7 |
| Sokoto | 8.7 | 5.2 | 7.0 | 7.3 |
| Zamfara | 7.5 | 6.5 | 8.4 | 7.3 |
| Region – South East | 4.8 | 5.1 | 4.7 | 4.6 |
| Abia | 4.4 | 5.2 | 4.2 | 5.1 |
| Anambra | 5.0 | 5.7 | 4.2 | 4.3 |
| Ebonyi | 5.6 | 6.1 | 5.3 | 5.2 |
| Enugu | 4.4 | 4.3 | 4.8 | 3.8 |
| Imo | 4.8 | 4.6 | 4.8 | 5.1 |
| Region – South South | 4.7 | 4.9 | 4.3 | 4.3 |
| Akwa Ibom | 4.0 | 4.0 | 3.9 | 4.5 |
| Bayelsa | 5.8 | 6.7 | 4.5 | 4.8 |
| Cross River | 5.4 | 5.8 | 5.4 | 4.4 |
| Delta | 4.5 | 5.3 | 4.1 | 5.2 |
| Edo | 5.3 | 5.3 | 4.4 | 3.8 |
| Rivers | 4.3 | 4.3 | 3.8 | 3.3 |
| Region – South West | 4.5 | 5.1 | 4.6 | 4.4 |
| Ekiti | 5.0 | 4.8 | 4.3 | 4.4 |
| Lagos | 4.0 | 4.7 | 4.1 | 4.0 |
| Ogun | 5.4 | 5.6 | 5.4 | 4.5 |
| Ondo | 4.9 | 3.9 | 5.2 | 4.5 |
| Osun | 4.0 | 4.9 | 4.1 | 4.7 |
| Oyo | 5.0 | 6.4 | 4.5 | 4.9 |
∗ MICS surveys
Contraceptive prevalence
Contraceptive prevalence, any methods (% of women ages 15–49)
| Year | 1982 | 1990 | 1994 | 1999 | 2003 | 2007 | 2008 | 2011 | 2012 | 2013 | 2016 | 2017 |
|---|---|---|---|---|---|---|---|---|---|---|---|---|
| % of women ages 15–49 | 6.8 % | 6.0 % | 13.4 % | 15.3 % | 12.6 % | 14.7 % | 14.6 % | 14.1 % | 13.5 % | 15.1 % | 20.4 % | 13.4 % |
∗ UNICEFs State of the Worlds Children and Child info, United Nations Population Divisions World Contraceptive Use, household surveys including Demographic and Health Surveys and Multiple Indicator Cluster Surveys.[19]
Population projections
The total population in sub-Saharan Africa is projected to increase to almost one billion people, making it the most populated region outside of South-Central Asia.[20] According to the United Nations, the population of Nigeria will reach 411 million by 2050. Nigeria might then be the 3rd most populous country in the world. In 2100, the population of Nigeria may reach 794 million.[21]While the overall population is expected to increase, the growth rate is estimated to decrease from 1.2 percent per year in 2010 to 0.4 percent per year in 2050.[20] The birth rate is also projected to decrease from 20.7 to 13.7, while the death rate is projected to increase from 8.5 in 2010 to 9.8 in 2050.[20] Life expectancy is all expected to increase from 67.0 years in 2010 to 75.2 years in 2050. By 2050, 69.6% of the population is estimated to be living in urban areas compared to 50.6% in 2010.[20]
Vital statistics
Registration of vital events in Nigeria is not complete. The Population Department of the United Nations prepared the following estimates.[22]
| Period | Live births per year | Deaths per year | Natural change per year | CBR* | CDR* | NC* | TFR* | IMR* |
|---|---|---|---|---|---|---|---|---|
| 1950–1955 | 1 821 000 | 1 169 000 | 652 000 | 46.1 | 29.6 | 16.5 | 6.35 | 200.7 |
| 1955–1960 | 1 998 000 | 1 181 000 | 817 000 | 46.3 | 27.3 | 19.0 | 6.35 | 186.6 |
| 1960–1965 | 2 202 000 | 1 197 000 | 1 005 000 | 46.1 | 25.1 | 21.0 | 6.35 | 172.9 |
| 1965–1970 | 2 431 000 | 1 244 000 | 1 187 000 | 45.7 | 23.4 | 22.3 | 6.35 | 159.6 |
| 1970–1975 | 2 801 000 | 1 306 000 | 1 495 000 | 46.8 | 21.8 | 25.0 | 6.61 | 147.3 |
| 1975–1980 | 3 232 000 | 1 377 000 | 1 855 000 | 47.1 | 20.1 | 27.0 | 6.76 | 134.2 |
| 1980–1985 | 3 642 000 | 1 467 000 | 2 175 000 | 46.2 | 18.6 | 27.6 | 6.76 | 125.3 |
| 1985–1990 | 4 018 000 | 1 657 000 | 2 361 000 | 44.8 | 18.5 | 26.3 | 6.60 | 126.0 |
| 1990–1995 | 4 446 000 | 1 866 000 | 2 580 000 | 43.6 | 18.3 | 25.3 | 6.37 | 126.0 |
| 1995–2000 | 4 984 000 | 2 075 000 | 2 909 000 | 43.1 | 17.9 | 25.2 | 6.17 | 118.6 |
| 2000–2005 | 5 606 000 | 2 230 000 | 3 376 000 | 42.7 | 17.0 | 25.7 | 6.05 | 104.0 |
| 2005–2010 | 6 309 000 | 2 224 000 | 4 085 000 | 42.2 | 14.9 | 27.3 | 6.01 | 89.9 |
| 2010–2015 | 5.74 | |||||||
| * CBR = crude birth rate (per 1000); CDR = crude death rate (per 1000); NC = natural change (per 1000); IMR = infant mortality rate per 1000 births; TFR = total fertility rate (number of children per woman) | ||||||||
Life expectancy at birth
Life expectancy from 1950 to 2015 (UN World Population Prospects)[23]:
| Period | Life expectancy in Years |
|---|---|
| 1950–1955 | 33.81 |
| 1955–1960 | |
| 1960–1965 | |
| 1965–1970 | |
| 1970–1975 | |
| 1975–1980 | |
| 1980–1985 | |
| 1985–1990 | |
| 1990–1995 | |
| 1995–2000 | |
| 2000–2005 | |
| 2005–2010 | |
| 2010–2015 |
Other demographic statistics
The following demographic statistics of Nigeria in 2019 are from the World Population Review.[24]
- One birth every 4 seconds
- One death every 14 seconds
- One net migrant every 9 minutes
- Net gain of one person every 6 seconds
The following demographic statistics are from the CIA World Factbook, unless otherwise indicated.[3]
Population
- 203,452,505 (July 2018 est.)
- 178.5 million (2014 est.)[25]
- 174,507,539 (July 2013 est.)
Population distribution
Nigeria is Africa's most populous country. Significant population clusters are scattered throughout the country, with the highest density areas being in the south and southwest.
Age structure
- 0-14 years: 42.45% (male 44,087,799 /female 42,278,742)
- 15-24 years: 19.81% (male 20,452,045 /female 19,861,371)
- 25-54 years: 30.44% (male 31,031,253 /female 30,893,168)
- 55-64 years: 4.04% (male 4,017,658 /female 4,197,739)
- 65 years and over: 3.26% (male 3,138,206 /female 3,494,524) (2018 est.)
- 0–14 years: 42.5% (male 41,506,288/female 39,595,720)
- 15–24 years: 19.6% (male 19,094,899/female 18,289,513)
- 25–54 years: 30.7% (male 30,066,196/female 28,537,846)
- 55–64 years: 3.9% (male 3,699,947/female 3,870,080)
- 65 years and over: 3% (male 2,825,134/female 3,146,638) (2017 est.)
- 0–14 years: 43.8% (male 39,127,615/female 37,334,281)
- 15–24 years: 19.3% (male 17,201,067/female 16,451,357)
- 25–54 years: 30.1% (male 25,842,967/female 26,699,432)
- 55–64 years: 3.8% (male 3,016,896/female 3,603,048)
- 65 years and over: 3% (male 2,390,154/female 2,840,722) (2013 est.)
Median age
- total: 18.3 years. Country comparison to the world: 210th
- male: 18.1 years
- female: 18.6 years (2018 est.)
- total: 18.4 years. Country comparison to the world: 213th
- male: 18.3 years
- female: 18.5 years (2017 est.)
- total: 17.9 years
- male: 17.4 years
- female: 18.4 years (2013 est.)
Birth rate
- 35.2 births/1,000 population (2018 est.) Country comparison to the world: 20th
- 36.9 births/1,000 population (2017 est.)
- 38.78 births/1,000 population (2013 est.)
Death rate
- 9.6 deaths/1,000 population (2018 est.) Country comparison to the world: 46th
- 12.4 deaths/1,000 population (2017 est.)
- 13.2 deaths/1,000 population (2013 est.)
Total fertility rate
- 4.85 children born/woman (2018 est.) Country comparison to the world: 16th
- 5.07 children born/woman (2017 est.)
Population growth rate
- 2.54% (2018 est.) Country comparison to the world: 21st
- 2.43% (2017 est.) Country comparison to the world: 24th
- 2.54% (2013 est.)
Mother's mean age at first birth
- 20.3 years
- Note: median age at first birth among women 25–29 (2013 est.)
Contraceptive prevalence rate
- 13.4% (2016/17)
Net migration rate
-0.2 migrant(s)/1,000 population (2017 est.) Country comparison to the world: 106th
-0.22 migrant(s)/1,000 population (2013 est.)
Dependency ratios
- total dependency ratio: 88.2
- youth dependency ratio: 83
- potential support ratio: 19.4 (2015 est.)
Urbanization
- urban population: 50.3% of total population (2018)
- rate of urbanization: 4.2% annual rate of change (2015–20 est.)
Life expectancy at birth
- total population: 59.3 years (2018 est.)
- male: 57.5 years (2018 est.)
- female: 61.1 years (2018 est.)
- total population: 52.05 years
- male: 48.95 years
- female: 55.33 years (2012 est.)
- total population: 46.94 years
- male: 46.16 years
- female: 47.76 years (2009 est.)
- total population: 51.56 years
- male: 51.58 years
- female: 51.55 years (2000 est.)
HIV/AIDS
adult prevalence rate 2.8% (2017 est.)
people living with HIV/AIDS
2.6 million (2007 est.)
3.3 million (2009 est.)
School life expectancy (primary to tertiary education)
- total: 9 years
- male: 9 years
- female: 8 years (2011)
Literacy
definition: age 15 and over can read and write
- total population: 59.6%
- male: 69.2%
- female: 49.7% (2015 est.)
- Total population: 78.6%
- Male: 84.35%
- Female: 72.65% (2010 est.)[27]
Unemployment, youth ages 15–24
- total: 12.4% (2016 est.)
- male: NA (2016 est.)
- female: NA (2016 est.)
Total and percent distribution of population by single year of age (Census 2006)
| Age | Population | Percent |
|---|---|---|
| Total | 140.431.790 | 100 |
| 0–4 | 22.594.967 | 16.09 |
| 0 | 3.004.421 | |
| 1 | 4.766.927 | |
| 2 | 4.874.939 | |
| 3 | 4.823.910 | |
| 4 | 5.124.770 | |
| 5–9 | 20.005.380 | 14.25 |
| 5 | 4.578.252 | |
| 6 | 4.239.954 | |
| 7 | 3.641.713 | |
| 8 | 4.274.377 | |
| 9 | 3.271.084 | |
| 10–14 | 16.135.950 | 11.49 |
| 10 | 4.782.673 | |
| 11 | 2.103.323 | |
| 12 | 3.690.772 | |
| 13 | 2.731.481 | |
| 14 | 2.827.701 | |
| 15–19 | 14.899.419 | 10.61 |
| 15 | 4.000.138 | |
| 16 | 2.646.846 | |
| 17 | 2.387.754 | |
| 18 | 3.777.608 | |
| 19 | 2.087.073 | |
| 20–24 | 13.435.079 | 9.57 |
| 20 | 5.825.512 | |
| 21 | 1.692.905 | |
| 22 | 2.372.385 | |
| 23 | 1.878.601 | |
| 24 | 1.665.676 | |
| 25–29 | 12.211.426 | 8.70 |
| 25 | 4.950.958 | |
| 26 | 1.685.645 | |
| 27 | 1.891.707 | |
| 28 | 2.348.975 | |
| 29 | 1.334.141 | |
| 30–34 | 9.467.538 | 6.74 |
| 30 | 5.538.220 | |
| 31 | 807.082 | |
| 32 | 1.561.540 | |
| 33 | 817.720 | |
| 34 | 742.976 | |
| 35–39 | 7.331.755 | 5.22 |
| 35 | 3.538.869 | |
| 36 | 894.320 | |
| 37 | 878.533 | |
| 38 | 1.255.414 | |
| 39 | 764.619 | |
| 40–44 | 6.456.470 | 4.60 |
| 40 | 4.156.871 | |
| 41 | 486.496 | |
| 42 | 918.443 | |
| 43 | 536.525 | |
| 44 | 358.135 | |
| 45–49 | 4.591.293 | 3.27 |
| 45 | 2.359.627 | |
| 46 | 517.645 | |
| 47 | 503.723 | |
| 48 | 746.592 | |
| 49 | 463.706 | |
| 50–54 | 4.249.219 | 3.03 |
| 50 | 2.862.363 | |
| 51 | 290.004 | |
| 52 | 534.394 | |
| 53 | 281.811 | |
| 54 | 280.647 | |
| 55–59 | 2.066.247 | 1.47 |
| 55 | 967.161 | |
| 56 | 320.949 | |
| 57 | 251.622 | |
| 58 | 324.990 | |
| 59 | 201.525 | |
| 60–64 | 2.450.286 | 1.74 |
| 60 | 1.791.258 | |
| 61 | 150.477 | |
| 62 | 245.662 | |
| 63 | 140.134 | |
| 64 | 122.755 | |
| 65–69 | 1.151.048 | 0.82 |
| 65 | 645.459 | |
| 66 | 102.029 | |
| 67 | 138.709 | |
| 68 | 171.016 | |
| 69 | 93.835 | |
| 70–74 | 1.264.937 | 0.95 |
| 70 | 1.002.176 | |
| 71 | 76.808 | |
| 72 | 130.975 | |
| 73 | 65.660 | |
| 74 | 54.978 | |
| 75–79 | 579.838 | 0.41 |
| 75 | 336.831 | |
| 76 | 62.741 | |
| 77 | 53.839 | |
| 78 | 84.521 | |
| 79 | 41.906 | |
| 80–84 | 760.053 | 0.54 |
| 80 | 586.064 | |
| 81 | 43.174 | |
| 82 | 65.942 | |
| 83 | 31.895 | |
| 84 | 32.978 | |
| 85+ | 715.225 | 0.51 |
| Age group | Population | Male | Female | Percent |
|---|---|---|---|---|
| 0–14 | 58.736.297 | 30.462.148 | 28.274.149 | 41.83 |
| 15–64 | 77.158.732 | 38.348.799 | 38.809.933 | 54.94 |
| 65+ | 4.536.761 | 2.534.541 | 2.002.220 | 3.23 |
| Number of children 0–14 | Number of women 15–49 | Proportion |
|---|---|---|
| 58.736.297 | 34.961.107 | 1.68 |
Structure of the population (DHS 2013) (males 87 034, females 89 529 = 176 574):
| Age Group | Male (%) | Female (%) | Total (%) |
|---|---|---|---|
| 0–4 | 17.4 | 16.7 | 17.1 |
| 5–9 | 16.8 | 15.9 | 16.3 |
| 10–14 | 12.7 | 11.9 | 12.3 |
| 15–19 | 8.6 | 9.0 | 8.8 |
| 20–24 | 6.7 | 7.8 | 7.2 |
| 25–29 | 6.6 | 8.3 | 7.4 |
| 30–34 | 5,9 | 6,2 | 6,1 |
| 35–39 | 5,2 | 5,4 | 5,3 |
| 40–44 | 4,3 | 4,0 | 4,2 |
| 45–49 | 3,9 | 3,7 | 3,8 |
| 50–54 | 2,6 | 3,3 | 2,9 |
| 55–59 | 2,5 | 2,3 | 2,4 |
| 60–64 | 2,3 | 2,0 | 2,1 |
| 65–69 | 1,5 | 1,2 | 1,3 |
| 70–74 | 1,3 | 1,0 | 1,2 |
| 75–79 | 0,7 | 0,5 | 0,6 |
| 80+ | 1,0 | 0,8 | 0,9 |
| Age group | Male (%) | Female (%) | Total (%) |
|---|---|---|---|
| 0–14 | 46.9 | 44.5 | 45.7 |
| 15–64 | 48.6 | 52.0 | 50.3 |
| 65+ | 4.5 | 3.5 | 4.0 |
Emigration
Today millions of ethnic Nigerians live abroad, the largest communities can be found in the United Kingdom (500,000–3,000,000)[29] and the United States (600,000–1,000,000 Nigerians), other countries that followed closely are South Africa, Gambia, and Canada respectively. There are also large groups in Ireland, Portugal and many other countries.[30] Inspiration for emigration is based heavily on socio-economical issues such as warfare, insecurity, economical instability and civil unrest. Between 1400–1900, of 1.4 million of 2 million emigrants were slaves sent to the Americas. This is due to the fact that the land now known as Nigeria was a central point for 4 slave trades during the 19th century. Though bondage represented a great deal, an estimated 30,000 Nigerian inhabitants would relocate to Kano City and Gambia to take advantage of financial opportunities afforded by fertile land and available natural resources. What's more, the presence of gold mines and rail lines along the Gold Coast, present-day Ghana, attracted an estimated 6,500 Nigerian citizens to attain financial gain and opportunity. The population of Nigerians in Ghana rose to roughly 149,000 before the 1969 alien expulsion order would displace nearly the entire population to surrounding countries.[31]
Religion
Nigeria is nearly equally divided between Christianity and Islam. The majority of Nigerian Muslims are Sunni and are concentrated in the northern, central and south-western zones of the country, while Christians dominate in some central states (especially Plateau and Benue states), and the south-east and south-south regions. Other religions practiced in Nigeria include African Traditional Religion, Hinduism, Bahai, Judaism, The Grail Movement, and the Reformed Ògbóni Fraternity, one of the traditional socio-religious institutions of the Yorùbá people and their Òrìṣà religion known as Ẹ̀sìn Òrìṣà Ìbílẹ̀ in the Yorùbá language.[32]
According to a 2009 Pew survey, 45% of Nigeria's population were Muslims.[33] A later Pew study in 2011 calculated that Christians now formed 56.8% of the population in Nigeria, while Muslims comprised 41.1%.[34][35] Adherents of other religions make up 1.4% of the population.[36]
The shift of population balance between Muslims and Christians is a result of northern and southern Nigeria being in different stages of demographic transition. The Muslim-dominated north is in an earlier stage of the demographic transition with much higher fertility rates than the south, whose split Christian/Muslim population is further along in the transition, and whose fertility rates are declining. Decreasing fertility can be linked to more access to education, use of contraceptives, and differing beliefs regarding family planning.[8]
The 1999 introduction of Sharia Law in twelve northern Nigerian states led to massive violence and unrest and caused an ethnic and religious rift between Sharia and Non-Sharia states, a divide that has deepened with time.[8]
Crime
Nigeria is home to a substantial network of organized crime, active especially in drug trafficking. Nigerian criminal groups are heavily involved in drug trafficking, shipping heroin from Asian countries to Europe and America; and cocaine from South America to Europe and South Africa.[37] The various Nigerian Confraternities or "campus cults" are active in both organized crime and in political violence as well as providing a network of corruption within Nigeria. As confraternities have extensive connections with political and military figures, they offer excellent alumni networking opportunities. The Supreme Vikings Confraternity, for example, boasts that twelve members of the Rivers State House of Assembly are cult members.[38] On lower levels of society, there are the "area boys", these are organized gangs mostly active in Lagos who specialize in mugging and small-scale drug dealing. According to official statistics, gang violence in Lagos resulted in 273 civilians and 84 policemen killed in the period of August 2000 to May 2001.[39]
"The result of factors such as endemic local corruption, which facilitates illicit trafficking; the Biafra civil war, which contributed to a proliferation of firearms; the oil boom of the 1970s, which led to the embezzlement of public funds; and the economic crisis of the 1980s, which was accompanied by a rise in robberies. The expansion of the Nigerian diaspora and organized crime went hand in hand. Global migration boosted prostitution, drug trafficking and fraud, the three main activities of Nigerian syndicates. The smuggling of Nigerian sex workers became a whole industry that now extends from Switzerland to France and Italy (where black prostitutes are called "fireflies"), and has even reached the Prudish Kingdom of Saudi Arabia, from which 1,000 women are said to be deported every month by the authorities."[40]
The high crime rate among Nigerian migrants also leads to stereotyping Nigerians as criminals; thus, in Cameroon, Nigerian migrants are perceived collectively by the inhabitants of Cameroon as likely to be oil smugglers or dealers in stolen cars. In the Netherlands, the debate on Nigerian crime reached an intensity described as a "moral panic" by one scholar.[41][42] In Switzerland, the crime rate of Nigerian young males was reported as 620% that of Swiss males in same age group (2009 data), the second highest crime rate of any nationality, just below that of Angolan nationals (at 630%).[43]
Nigeria is also pervaded by political corruption. It is ranked 136 out of 168 countries in Transparency International's 2015 Corruption Perceptions Index.[44]
References
- Akinyemi, Akanni Ibukun (2014). "Demographic dynamics and development in Nigeria". African Population Studies. 27 (2): 239–248. doi:10.11564/27-2-471.
- "The World Factbook — Central Intelligence Agency". www.cia.gov. Retrieved 10 April 2018.
- Nigeria: People, CIA World Factbook, 2018

- LeVan, A. Carl; Ukata, Patrick (25 October 2018). The Oxford Handbook of Nigerian Politics. Oxford University Press. ISBN 978-0-19-880430-7.
- Lysonski, Steven (2013). "Nigeria in transition: acculturation to global consumer culture". Journal of Consumer Marketing. 30 (6): 493–508. doi:10.1108/JCM-07-2013-0626.
- Okeke, Chukwuma O.; Ibenwa, Christopher N.; Okeke, Gloria Tochukwu (1 April 2017). "Conflicts Between African Traditional Religion and Christianity in Eastern Nigeria: The Igbo Example". SAGE Open. 7 (2): 2158244017709322. doi:10.1177/2158244017709322. ISSN 2158-2440.
- Osoba, Joseph Babasola (2015). "Analysis of Discourse in Nigerian Pidgin". Journal of Universal Language. Retrieved 27 May 2020.
- Stonawski, Marcin; Potancokova, Michaela; Cantele, Matthew; Skirbekk, Vegard (2016). "The changing religious composition of Nigeria: causes and implications of demographic divergence" (PDF). The Journal of Modern African Studies. 54 (3): 362–386. doi:10.1017/s0022278x16000409 – via Auraria Library.
- "Archived copy". Archived from the original on 6 May 2011. Retrieved 13 August 2012.CS1 maint: archived copy as title (link) CS1 maint: BOT: original-url status unknown (link)
- "NIGERIA'S POPULATION HITS 198M PEOPLE – NPopC CHAIRMAN", National Population Commission (Nigeria)
- "MEASURE DHS: Demographic and Health Surveys". Microdata.worldbank.org. Retrieved 29 August 2017.
- "In the News: The Nigerian Census". Prb.org. Retrieved 29 August 2017.
- "Map of Central Africa" (GIF). Businessmonitor.com. Retrieved 29 August 2017.
- "FIELD LISTING :: TOTAL FERTILITY RATE". CIA. the World Factbook.
- "Birth rate, crude (per 1,000 people)", World Bank Group
- "Demographic and Health Survey 2018" (PDF).
- "Archived copy" (PDF). Archived from the original (PDF) on 6 July 2017. Retrieved 27 August 2017.CS1 maint: archived copy as title (link)
- "The DHS Program – Country Main". Dhsprogram.com. Retrieved 29 August 2017.
- "Contraceptive prevalence, any methods (% of women ages 15–49)", World Bank Group
- Dyson, Tim (2010). Population and Development: The Demographic Transition. ProQuest: Zed Books. pp. 70–77.
- "World population projected to reach 9.8 billion in 2050, and 11.2 billion in 2100". UN DESA | United Nations Department of Economic and Social Affairs. 21 June 2017. Retrieved 27 May 2020.
- Population Division of the Department of Economic and Social Affairs of the United Nations Secretariat, World Population Prospects: The 2012 Revision Archived 16 August 2015 at the Wayback Machine
- "World Population Prospects – Population Division – United Nations". Retrieved 15 July 2017.
- "Nigeria Population 2018", World Population Review, 6 June 2018
- THE STATE OF WORLD POPULATION 2014, 2014. Retrieved on 20 June 2015
- "Africa :: Nigeria". The World Factbook.
- "National literacy main report" (PDF). Archived from the original (PDF) on 29 September 2011. Retrieved 2011-08-29.
- "Archived copy" (PDF). Archived from the original (PDF) on 20 January 2017. Retrieved 19 April 2013.CS1 maint: archived copy as title (link)
- "Country Profile: Nigeria". Foreign and Commonwealth Office. 25 June 2010. Archived from the original on 29 June 2011. Retrieved 29 August 2011.
- "NOI-Polls: US And UK Top List Of Countries Most Nigerians Abroad Reside In. Key Reason For Migration Is For Economic Opportunities". Noi-polls.com. Archived from the original on 27 August 2017. Retrieved 29 August 2017.
- "Nigeria: Multiple Forms of Mobility in Africa's Demographic Giant". Migrationpolicy.org. 30 June 2010. Retrieved 29 August 2017.
- Habila Kitause, Rimamsikwe; Chukwuka Achunike, Hilary (2013). "Religion in Nigeria from 1900–2013" (PDF). Research on Humanities and Social Sciences. 3 (18): 35–56 – via Google Scholar.
- "Mapping out the Global Muslim Population" (PDF). Archived from the original (PDF) on 10 October 2009. Retrieved 2011-08-29.
- "Global Christianity: A Report on the Size and Distribution of the World's Christian Population" (PDF). Pewforum.org. Archived from the original (PDF) on 23 July 2013. Retrieved 29 December 2011.
- "Future of the World Muslim Population" (web). Pewforum.org. 27 January 2011. Retrieved 16 May 2014.
- "Nigeria: Facts and figures". BBC News. 17 April 2007.
- "Organized Crime: African Criminal Enterprises". Federal Bureau of Investigation. Archived from the original on 6 September 2015. Retrieved 7 June 2011.
- "Cults of violence – How student fraternities turned into powerful and well-armed gangs". The Economist. 31 July 2008. Retrieved 7 June 2011.
- Olukoya, Sam (20 February 2003). "Crime war rages in Nigeria". BBC News. Retrieved 7 June 2011.
- Marc-Antoine Pérouse de Montclos (2005). ""The Dark Side of Diaspora Networking: Organised Crime and Terrorism" in Diasporas, Remittances and Africa South of the Sahara: A Strategic Assessment". Iss.co.za. Archived from the original on 2 July 2008. Retrieved 29 August 2017.
- van Heelsum & Hessels 2006, p. 80
- van Dijk 2001, p. 558
- Neue Statistik: Tamilen sind krimineller als Ex-Jugoslawen, Tages-Anzeiger 12 September 2010. In April 2010, the director of the Swiss Federal Office for Migration (BFM), Alard du Bois-Reymond, issued a statement to the effect that 99.5% of asylum seekers of Nigerian origin in Switzerland were criminals who entered Europe with the intention of pursuing petty crime and drug dealing. Task-Force gegen Asylmissbrauch 11 April 2010.
- e.V., Transparency International. "Transparency International – The Global Anti-Corruption Coalition". www.transparency.org.
| Wikimedia Commons has media related to Demographics of Nigeria. |
Additional sources
- Demographic Dividend Investing in Human Capital. (n.d.). Retrieved March 15, 2018, from http://www.demographicdividend.org/country_highlights/nigeria/
- Demographic dynamics and development in Nigeria – ProQuest. (n.d.). Retrieved March 15, 2018, from https://search.proquest.com/docview/1706105013
- Dyson, T. (2010). Population and Development: The Demographic Transition. London, UNITED KINGDOM: Zed Books. Retrieved from http://ebookcentral.proquest.com/lib/cudenver/detail.action?docID=619255
- Omoju, O. E., & Abraham, T. W. (2014). Youth bulge and demographic dividend in Nigeria. Etude de La Population Africaine; Johannesburg, 27(2), 352–360. doi:10.11564/27-2-480
- Reed, H. E., & Mberu, B. U. (2014). Capitalizing on Nigeria's demographic dividend: reaping the benefits and diminishing the burdens. Etude de La
- Population Africaine; Johannesburg, 27(2), 319–330. doi:10.11564/27-2-477
- The World Factbook — Central Intelligence Agency. (n.d.). Retrieved April 10, 2018, from https://www.cia.gov/library/publications/the-world-factbook/geos/ni.html