Demographics of El Salvador
This article is about the demographic features of the population of El Salvador, including population density, ethnicity, education level, health of the populace, economic status, religious affiliations and other aspects of the population.
| Demographics of El Salvador | |
|---|---|
| Population | 6,408,111 |
| Male population | 3,128,267 |
| Female population | 3,351,248 |
| Population growth | 1.68% |
| Birth rate | 25.72/1,000 |
| Death rate | 5.53/1,000 |
| Infant mortality rate | 22.19/1,000 |
| Life expectancy | 73.44 years[1] |
.jpg)
El Salvador's population numbers 6.1 million. Ethnically, 86.3% of Salvadorans are mixed (mixed Indigenous Native Salvadoran and European (mostly Spanish) origin). Another 12.7% is of pure European descent, 1% are of pure indigenous descent, 0.16% are black and others are 0.64%.[2]
Population
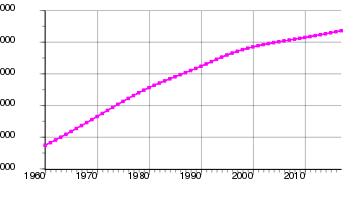
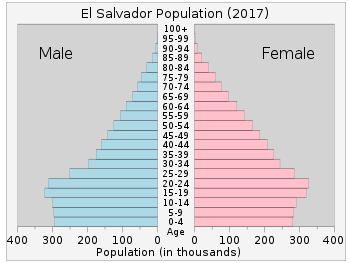
El Salvador's population was 6,420,746 in 2018,[3][4] compared to 2,200,000 in 1950. In 2010 the percentage of the population below the age of 15 was 32.1%, 61% were between 15 and 65 years of age, while 6.9% were 65 years or older.[5]
| Year | Total population | Proportion per age group | ||
|---|---|---|---|---|
| Ages 0–14 (%) | Ages 15–64 (%) | Ages 65+ (%) | ||
| 1950 | 2 200 000 | 42.7 | 53.3 | 4.0 |
| 1955 | 2 433 000 | 43.6 | 52.6 | 3.8 |
| 1960 | 2 773 000 | 45.1 | 51.1 | 3.7 |
| 1965 | 3 244 000 | 46.3 | 50.1 | 3.7 |
| 1970 | 3 736 000 | 46.4 | 49.9 | 3.6 |
| 1975 | 4 232 000 | 45.8 | 50.5 | 3.7 |
| 1980 | 4 661 000 | 45.2 | 50.9 | 3.9 |
| 1985 | 5 004 000 | 44.1 | 51.8 | 4.2 |
| 1990 | 5 344 000 | 41.7 | 53.7 | 4.6 |
| 1995 | 5 748 000 | 39.6 | 55.5 | 4.9 |
| 2000 | 5 959 000 | 38.3 | 56.2 | 5.5 |
| 2005 | 6 073 000 | 35.7 | 58.1 | 6.2 |
| 2010 | 6 218 000 | 32.1 | 61.0 | 6.9 |
Emigration
The migration rate accelerated during the period of 1979 to 1981, this marked the beginning of the civil unrest and the spread of political killings.[6] The total impact of civil wars, dictatorships and socioeconomics drove over a million Salvadorans (both as immigrants and refugees) into the United States; Guatemala is the second country that hosts more Salvadorans behind the United States, approximately 110,000 Salvadorans according to the national census of 2010.[7] in addition small Salvadoran communities sprung up in Canada, Australia, Belize, Panama, Costa Rica, Italy, Taiwan and Sweden since the migration trend began in the early 1970s.[8] The 2010 U.S. Census counted 1,648,968 Salvadorans in the United States, up from 655,165 in 2000.[9]
Ethnic groups
Out of the 6,408,111 people in El Salvador, 86.3% are mestizo, 12.7% are of full European descent, 1% indigenous, 0.8% black, and 0.64% other.
Mestizo Salvadorans
86.3% of the population are mestizo, having mixed indigenous and European ancestry.[1] In the mestizo population, Salvadorans who are racially European, especially Mediterranean, as well as Afro-Salvadoran, and the indigenous people in El Salvador who do not speak indigenous languages or have an indigenous culture, all identify themselves as being culturally mestizo.[10]
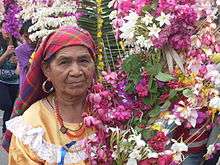
Indigenous Salvadorans
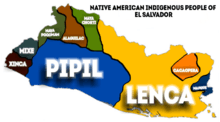
According to the Salvadoran Government, about 1% of the population are of full or partial indigenous origin. The largest most dominant Native American groups in El Salvador are the Lenca people and Pipil people followed by small enclaves of Maya peoples: (Poqomam people/Chorti people), Cacaopera people, Xinca people, Alaguilac people, Mixe people, Mangue language people, as well as an Olmec past. (Pipil, located in the west and central part of the country, and Lenca, found east of the Lempa River). There are small populations of Cacaopera people in the Morazán Department and a few Ch'orti' people live in the department of Ahuachapán, near the border of Guatemala.
The number of indigenous people in El Salvador have been criticized by indigenous organizations and academics as too small and accuse the government of denying the existence of indigenous Salvadorans in the country.[11] According to the National Salvadoran Indigenous Coordination Council (CCNIS) and CONCULTURA (National Council for Art and Culture at the Ministry of Education ), approximately 70,000 or 1 per cent of Salvadorian peoples are indigenous.[12] Nonetheless, very few Amerindians have retained their customs and traditions, having over time assimilated into the dominant Mestizo/Spanish culture. The low numbers of indigenous people may be partly explained by historically high rates of old-world diseases, absorption into the mestizo population, as well as mass murder during the 1932 Salvadoran peasant uprising (or La Matanza) which saw (estimates of) up to 30,000 peasants killed in a short period of time. Many authors note that since La Matanza the indigenous in El Salvador have been very reluctant to describe themselves as such (in census declarations for example) or to wear indigenous dress or be seen to be taking part in any cultural activities or customs that might be understood as indigenous.[13] Departments and cities in the country with notable indigenous populations include Sonsonate (especially Izalco, Nahuizalco, and Santo Domingo), Cacaopera, and Panchimalco, in the department of San Salvador.[12]
White Salvadorans
Some 12.7% of Salvadorans are white. This population is mostly made up of ethnically Spanish people, while there are also Salvadorans of French, German, Swiss, English, Irish, and Italian descent. A majority of Central European settlers in El Salvador arrived during World War II as refugees from the Czech Republic, Germany, Hungary, Poland, and Switzerland. In northern departments like the Chalatenango Department, it is well known that residents in the area are of pure Spanish descent; settling in the region that is now Chalatenango in the late 18th century.[14] The governor of San Salvador, Francisco Luis Héctor de Carondelet, ordered families from northern Spain (Galicia and Asturias) to settle the area to compensate for the lack of indigenous people to work the land; it is not uncommon to see people with blond hair, fair skin, and blue or green eyes in municipalities like Dulce Nombre de María, La Palma, and El Pital. The majority of Salvadorans of Spanish descent possess Mediterranean racial features: olive skin and dark hair and eyes (black or dark brown), and they identify themselves as mestizo, like mentioned above.
Arab Salvadorans
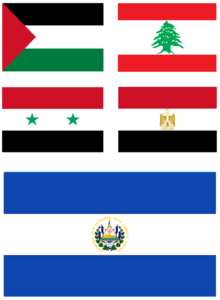

There is a significant Arab population (of about 100,000);[15] mostly from Palestine (especially from the area of Bethlehem), but also from Lebanon. Salvadorans of Palestinian descent numbered around 70,000 individuals, while Salvadorans of Lebanese descent is around 25,000.[16] There is also a small community of Jews who came to El Salvador from France, Germany, Morocco, Tunisia, and Turkey.
The history of the Arabs in El Salvador dates back to the end of the 20th century, because of religious clashes, which induced many Palestinians, Lebanese, Egyptians and Syrians to leave the land where they were born, in search of countries where they at least lived in An atmosphere of relative peace. There were also other reasons of a subjective nature, based on the hope of success, of achieving success and fortune and obtaining recognition from others.
Arab immigration in El Salvador began at the end of the 20th century in the wake of the repressive policies applied by the Ottoman Empire against Maronite Catholics. Several of the destinations that the Lebanese chose at that time were in countries of the Americas, including El Salvador. This resulted in the Arab diaspora residents being characterized by forging in devoutly Christian families and very attached to their beliefs, because in these countries they can exercise their faith without fear of persecution, which resulted in the rise of Lebanese-Salvadoran, Syrian-Salvadoran and Palestinian-Salvadoran communities in El Salvador.[17]
Currently the strongest community is the Palestinian (70,000 descendants), followed by the Lebanese settled in San Salvador with more than 27,000 direct descendants, mostly (95%) Catholic and Orthodox Christians. The slaughter of Lebanese and Palestinian Arab Christians at the hands of Muslims, initiated the first Lebanese migration to El Salvador.[18]
Inter-ethnic marriage in the Lebanese community with Salvadorans, regardless of religious affiliation, is very high; most have only one father with Lebanese nationality and mother of Salvadoran nationality. As a result, some of them speak Arabic fluently. But most, especially among younger generations, speak Spanish as a first language and Arabic as a second.[19]
During the war between Israel and Lebanon in 1948 and during the Six Day War, thousands of Lebanese left their country and went to El Salvador. First they arrived at La Libertad, were they comprised half of the economic activity of immigrants.
Lebanon had been an iqta of the Ottoman Empire. Although the imperial administration, whose official religion was Islam, guaranteed freedom of worship for non-Muslim communities, and Lebanon in particular had a semi-autonomous status, the situation for practitioners of the Maronite Catholic Church was complicated, since they had to cancel exaggerated taxes and suffered limitations for their culture. These tensions were expressed in a rebellion in 1821 and a war against the Druze in 1860. The hostile climate caused many Lebanese to sell their property and take ships in the ports of Sidon, Beirut and Tripoli heading for the Americas.
Statistically in El Salvador, there are about 120,000 Arabs, of Lebanese, Syrian, Egyptian and Palestinian ancestry. In the case of these Arab-Salvadorans, although not all the families arrived together, they were the ones that lead the economy in the country.
In 1939, the Arab community based in San Salvador organized and founded the "Arab Youth Union Society"[20]
Pardo Salvadorans
Pardo is the term that was used in colonial El Salvador to describe a tri-racial Afro-Mestizo person of Indigenous, European, and African descent. Afro-Salvadorans are the descendants of the African population that were enslaved and shipped to El Salvador to work in mines in specific regions of El Salvador. They have mixed into and were naturally bred out by the general Mestizo population, which is a combination of a Mestizo majority and the minority of Pardo people, both of whom are racially mixed populations. Thus, there remains no significant extremes of African physiognomy among Salvadorans like there is in the other countries of Central America. A total of only 10,000 African slaves were brought to El Salvador over the span of 75 years, starting around 1548, about 25 years after El Salvador's colonization. El Salvador is the only country in Central America that does not have English Antillean (West Indian) or Garifuna populations of the Caribbean, but instead had older colonial African slaves that came straight from Africa. This is the reason why El Salvador is the only country in Central America not to have a caribbeanized culture, and instead preserved its classical Central America culture.
Gallery
- Salvadoran people
.jpg) Salvadoran troops
Salvadoran troops.jpg) Salvadoran cadets in the Legislative Assembly of El Salvador
Salvadoran cadets in the Legislative Assembly of El Salvador_28%2C_helps_Salvadoran.jpg) Salvadoran men building class bench for children
Salvadoran men building class bench for children Salvadoran baseball players
.jpg) Young Salvadoran man playing a guitar
Young Salvadoran man playing a guitar.jpg) Salvadoran women San Vicente, El Salvador
Salvadoran women San Vicente, El Salvador Salvadoran boy in La Unión, El Salvador
_2013_in_Metalio%2C_El_Salvador%2C_May_18%2C_2013_130518-A-IA672-087.jpg) Salvadoran boy
Salvadoran boy.jpg) Young Salvadoran women in Ahuachapan
Young Salvadoran women in Ahuachapan Salvadoran children in La Unión, El Salvador
.jpg) Young Salvadoran girls in San Miguel, El Salvador
Young Salvadoran girls in San Miguel, El Salvador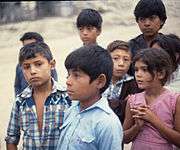 Salvadoran boys and girls during the civil war
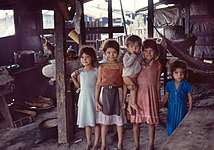 Salvadoran girls during the civil war
 Salvadorans in Colima
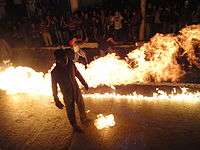 Fire ball festival in Nejapa
.jpg) Salvadoran music group
Salvadoran music group.jpg) Salvadoran women
Salvadoran women.jpg) Salvadoran band
Salvadoran band
Vital statistics
UN estimates
The Population Department of the United Nations prepared the following estimates.[5]
| Period | Live births per year |
Deaths per year |
Natural change per year |
CBR* | CDR* | NC* | TFR* | IMR* | Life expectancy total |
Life expectancy males |
Life expectancy females |
|---|---|---|---|---|---|---|---|---|---|---|---|
| 1950-1955 | 108 000 | 48 000 | 61 000 | 46.7 | 20.6 | 26.1 | 6.30 | 147 | 45.1 | 43.4 | 46.8 |
| 1955-1960 | 125 000 | 46 000 | 78 000 | 47.8 | 17.8 | 30.0 | 6.60 | 132 | 49.3 | 47.2 | 51.5 |
| 1960-1965 | 144 000 | 47 000 | 97 000 | 47.7 | 15.5 | 32.3 | 6.76 | 119 | 53.0 | 50.5 | 55.7 |
| 1965-1970 | 156 000 | 47 000 | 109 000 | 44.8 | 13.5 | 31.3 | 6.43 | 109 | 55.6 | 52.6 | 58.9 |
| 1970-1975 | 168 000 | 49 000 | 119 000 | 42.1 | 12.3 | 29.8 | 5.95 | 100 | 57.0 | 53.2 | 61.2 |
| 1975-1980 | 177 000 | 52 000 | 124 000 | 39.7 | 11.8 | 27.9 | 5.46 | 91 | 57.0 | 51.9 | 62.7 |
| 1980-1985 | 174 000 | 55 000 | 119 000 | 36.1 | 11.4 | 24.7 | 4.80 | 77 | 56.9 | 50.6 | 64.2 |
| 1985-1990 | 171 000 | 44 000 | 126 000 | 33.0 | 8.6 | 24.4 | 4.20 | 56 | 63.1 | 57.4 | 69.1 |
| 1990-1995 | 169 000 | 37 000 | 132 000 | 30.5 | 6.8 | 23.8 | 3.73 | 38 | 68.0 | 63.3 | 72.9 |
| 1995-2000 | 161 000 | 38 000 | 123 000 | 27.5 | 6.6 | 20.9 | 3.30 | 27 | 69.2 | 64.4 | 73.9 |
| 2000-2005 | 133 000 | 75 000 | 94 000 | 22.0 | 6.4 | 15.6 | 2.60 | 23 | 70.2 | 65.4 | 74.9 |
| 2005-2010 | 127 000 | 90 000 | 87 000 | 20.7 | 6.5 | 14.2 | 2.35 | 21 | 71.3 | 66.5 | 75.9 |
| * CBR = crude birth rate (per 1000); CDR = crude death rate (per 1000); NC = natural change (per 1000); IMR = infant mortality rate per 1000 births; TFR = total fertility rate (number of children per woman) | |||||||||||
Registered data
| Average population [21] | Live births | Deaths | Natural change | Crude birth rate (per 1000) | Crude death rate (per 1000) | Natural change (per 1000) | TFR | |
|---|---|---|---|---|---|---|---|---|
| 1940 | 1,633,000 | 74,637 | 45.7 | |||||
| 1941 | 1,654,000 | 72,376 | 43.8 | |||||
| 1942 | 1,675,000 | 71,414 | 42.6 | |||||
| 1943 | 1,697,000 | 71,554 | 42.2 | |||||
| 1944 | 1,719,000 | 72,590 | 42.2 | |||||
| 1945 | 1,742,000 | 74,660 | 42.9 | |||||
| 1946 | 1,764,000 | 72,042 | 30,996 | 41,046 | 40.8 | 17.6 | 23.2 | |
| 1947 | 1,788,000 | 84,330 | 30,719 | 53,611 | 47.2 | 17.2 | 30.0 | |
| 1948 | 1,811,000 | 80,770 | 30,527 | 50,243 | 44.6 | 16.9 | 27.7 | |
| 1949 | 1,835,000 | 84,839 | 28,339 | 56,500 | 46.2 | 15.4 | 30.8 | |
| 1950 | 2,200,000 | 90,557 | 27,454 | 63,103 | 41.2 | 12.5 | 28.7 | |
| 1951 | 2,237,000 | 93,634 | 29,030 | 64,604 | 41.8 | 13.0 | 28.9 | |
| 1952 | 2,280,000 | 96,802 | 32,423 | 64,379 | 42.5 | 14.2 | 28.2 | |
| 1953 | 2,327,000 | 98,474 | 30,280 | 68,194 | 42.3 | 13.0 | 29.3 | |
| 1954 | 2,378,000 | 102,009 | 31,810 | 70,199 | 42.9 | 13.4 | 29.5 | |
| 1955 | 2,433,000 | 105,040 | 31,151 | 73,889 | 43.2 | 12.8 | 30.4 | |
| 1956 | 2,491,000 | 106,539 | 28,127 | 78,412 | 42.8 | 11.3 | 31.5 | |
| 1957 | 2,553,000 | 114,929 | 32,893 | 82,036 | 45.0 | 12.9 | 32.1 | |
| 1958 | 2,621,000 | 115,154 | 32,831 | 82,323 | 43.9 | 12.5 | 31.4 | |
| 1959 | 2,694,000 | 115,622 | 30,038 | 85,584 | 42.9 | 11.1 | 31.8 | |
| 1960 | 2,773,000 | 121,403 | 28,768 | 92,635 | 43.8 | 10.4 | 33.4 | |
| 1961 | 2,859,000 | 124,871 | 28,471 | 96,400 | 43.7 | 10.0 | 33.7 | |
| 1962 | 2,951,000 | 127,154 | 30,342 | 96,812 | 43.1 | 10.3 | 32.8 | |
| 1963 | 3,047,000 | 133,395 | 29,614 | 103,781 | 43.8 | 9.7 | 34.1 | |
| 1964 | 3,145,000 | 133,072 | 29,496 | 103,576 | 42.3 | 9.4 | 32.9 | |
| 1965 | 3,244,000 | 137,430 | 30,906 | 106,524 | 42.4 | 9.5 | 32.8 | |
| 1966 | 3,342,000 | 137,950 | 30,368 | 107,582 | 41.3 | 9.1 | 32.2 | |
| 1967 | 3,440,000 | 139,955 | 28,957 | 110,998 | 40.7 | 8.4 | 32.2 | |
| 1968 | 3,537,000 | 140,986 | 29,863 | 111,123 | 39.8 | 8.4 | 31.4 | |
| 1969 | 3,636,000 | 142,699 | 33,655 | 109,044 | 39.2 | 9.2 | 29.9 | |
| 1970 | 3,736,000 | 141,471 | 35,094 | 106,377 | 37.8 | 9.4 | 28.4 | |
| 1971 | 3,836,000 | 154,309 | 28,752 | 125,557 | 40.2 | 7.5 | 32.7 | |
| 1972 | 3,938,000 | 153,464 | 32,383 | 121,081 | 38.9 | 8.2 | 30.7 | |
| 1973 | 4,038,000 | 155,632 | 31,865 | 123,767 | 38.5 | 7.9 | 30.6 | |
| 1974 | 4,137,000 | 158,524 | 30,494 | 128,030 | 38.3 | 7.4 | 30.9 | |
| 1975 | 4,232,000 | 159,731 | 31,601 | 128,130 | 37.7 | 7.5 | 30.3 | |
| 1976 | 4,325,000 | 165,822 | 30,826 | 134,996 | 38.3 | 7.1 | 31.2 | |
| 1977 | 4,414,000 | 177,531 | 33,009 | 144,522 | 40.2 | 7.5 | 32.7 | |
| 1978 | 4,500,000 | 172,897 | 30,086 | 142,811 | 38.4 | 6.7 | 31.7 | |
| 1979 | 4,582,000 | 174,183 | 32,936 | 141,247 | 38.0 | 7.2 | 30.8 | |
| 1980 | 4,661,000 | 169,930 | 38,967 | 130,963 | 36.4 | 8.4 | 28.1 | |
| 1981 | 4,734,000 | 163,305 | 37,468 | 125,837 | 34.5 | 7.9 | 26.6 | |
| 1982 | 4,805,000 | 156,796 | 33,284 | 123,512 | 32.6 | 6.9 | 25.7 | |
| 1983 | 4,872,000 | 144,193 | 32,697 | 111,496 | 29.6 | 6.7 | 22.9 | |
| 1984 | 4,938,000 | 142,202 | 28,854 | 113,348 | 28.8 | 5.8 | 23.0 | |
| 1985 | 5,004,000 | 139,514 | 27,225 | 112,289 | 27.9 | 5.4 | 22.5 | |
| 1986 | 5,069,000 | 145,126 | 25,731 | 119,395 | 28.7 | 5.1 | 23.6 | |
| 1987 | 5,134,000 | 148,355 | 27,581 | 120,774 | 28.9 | 5.4 | 23.6 | |
| 1988 | 5,200,000 | 149,299 | 27,774 | 121,525 | 28.8 | 5.4 | 23.4 | |
| 1989 | 5,269,000 | 151,859 | 27,768 | 124,091 | 28.9 | 5.3 | 23.6 | |
| 1990 | 5,344,000 | 148,360 | 28,195 | 120,165 | 27.8 | 5.3 | 22.5 | |
| 1991 | 5,425,000 | 151,210 | 27,066 | 124,144 | 27.9 | 5.0 | 22.9 | |
| 1992 | 5,511,000 | 154,014 | 27,869 | 126,145 | 27.9 | 5.1 | 22.9 | |
| 1993 | 5,597,000 | 168,000 | 38,000 | 130,000 | 30.0 | 6.8 | 23.2 | |
| 1994 | 5,678,000 | 160,772 | 29,407 | 131,365 | 28.3 | 5.2 | 23.1 | |
| 1995 | 5,748,000 | 159,336 | 29,130 | 130,206 | 27.7 | 5.1 | 22.7 | |
| 1996 | 5,807,000 | 163,007 | 28,904 | 134,103 | 28.1 | 5.0 | 23.1 | |
| 1997 | 5,855,000 | 164,143 | 29,118 | 135,025 | 28.0 | 5.0 | 23.1 | |
| 1998 | 5,895,000 | 158,350 | 29,919 | 128,431 | 26.9 | 5.1 | 21.8 | |
| 1999 | 5,929,000 | 153,636 | 28,056 | 125,580 | 25.9 | 4.7 | 21.2 | |
| 2000 | 5,959,000 | 150,176 | 28,154 | 122,022 | 25.2 | 4.7 | 20.5 | |
| 2001 | 5,985,000 | 138,354 | 29,959 | 108,395 | 23.1 | 5.0 | 18.1 | |
| 2002 | 6,008,000 | 129,363 | 27,458 | 101,905 | 21.5 | 4.6 | 17.0 | |
| 2003 | 6,029,000 | 124,476 | 29,377 | 95,099 | 20.6 | 4.9 | 15.8 | |
| 2004 | 6,050,000 | 119,710 | 30,058 | 89,652 | 19.8 | 5.0 | 14.8 | |
| 2005 | 6,073,000 | 112,769 | 30,933 | 81,836 | 18.6 | 5.1 | 13.5 | |
| 2006 | 6,097,000 | 107,111 | 31,453 | 75,658 | 17.6 | 5.2 | 12.4 | |
| 2007 | 6,123,000 | 106,471 | 31,349 | 75,122 | 17.4 | 5.1 | 12.3 | 2.4 |
| 2008 | 6,152,000 | 111,278 | 31,594 | 79,684 | 18.1 | 5.1 | 13.0 | |
| 2009 | 6,183,000 | 107,880 | 32,872 | 75,008 | 17.5 | 5.3 | 12.2 | |
| 2010 | 6,218,000 | 104,939 | 32,586 | 72,353 | 17.0 | 5.3 | 11.7 | |
| 2011 | 6,256,000 | 109,384 | 33,211 | 76,173 | 17.6 | 5.3 | 12.3 | |
| 2012 | 6,221,000 | 110,843 | 32,148 | 78,695 | 17.7 | 5.1 | 12.6 | 2.3 |
| 2013 | 6,251,000 | 109,617 | 34,212 | 75,405 | 17.4 | 5.4 | 12.0 | 2.2 |
| 2014 | 6,281,000 | 108,712 | 37,461 | 71,442 | 17.2 | 5.9 | 11.3 | |
| 2015 | 6,312,000 | 107,885 | 40,869 | 67,016 | 17.1 | 6.5 | 10.6 | |
| 2016 | 6,345,000 | 96,287 | 38,931 | 57,356 | 15.2 | 6.1 | 9.1 |
Structure of the population
Structure of the population (May 2007 census):
| Age group | Male | Female | Total | % |
|---|---|---|---|---|
| Total[21] | 2 719 371 | 3 024 742 | 5 744 113 | 100 |
| 0-4 | 283 272 | 272 621 | 555 893 | 9.68 |
| 5-9 | 349 150 | 335 577 | 684 727 | 11.92 |
| 10-14 | 359 523 | 346 824 | 706 347 | 12.30 |
| 15-19 | 298 384 | 302 181 | 600 565 | 10.46 |
| 20-24 | 228 001 | 258 541 | 486 542 | 8.47 |
| 25-29 | 206 963 | 250 927 | 457 890 | 7.97 |
| 30-34 | 178 400 | 223 849 | 402 249 | 7.00 |
| 35-39 | 156 514 | 196 633 | 353 147 | 6.15 |
| 40-44 | 132 218 | 171 413 | 303 631 | 5.29 |
| 45-49 | 109 957 | 142 165 | 252 122 | 4.39 |
| 50-54 | 95 275 | 120 459 | 215 734 | 3.76 |
| 55-59 | 81 718 | 101 357 | 183 075 | 3.19 |
| 60-64 | 68 207 | 83 657 | 151 864 | 2.64 |
| 65-69 | 55 781 | 69 376 | 125 157 | 2.18 |
| 70-74 | 43 449 | 54 008 | 97 457 | 1.70 |
| 75-79 | 33 658 | 42 326 | 75 984 | 1.32 |
| 80-84 | 20 401 | 26 469 | 46 870 | 0.82 |
| 85+ | 18 500 | 26 359 | 44 859 | 0.78 |
| Age group | Male | Female | Total | Percent |
|---|---|---|---|---|
| 0-14 | 991 945 | 955 022 | 1 946 967 | 33.89 |
| 15-64 | 1 555 637 | 1 851 182 | 3 406 819 | 59.31 |
| 65+ | 171 789 | 218 538 | 390 327 | 6.80 |
Structure of the population (July 2011; estimates based on the 2007 census trends):
| Age group | Male | Female | Total | % |
|---|---|---|---|---|
| Total | 2 925 284 | 3 290 858 | 6 216 143 | 100 |
| 0-4 | 309 786 | 296 430 | 606 216 | 9.75 |
| 5-9 | 308 052 | 294 483 | 602 535 | 9.69 |
| 10-14 | 362 232 | 348 111 | 710 343 | 11.43 |
| 15-19 | 352 598 | 350 791 | 703 389 | 11.32 |
| 20-24 | 276 109 | 305 559 | 581 668 | 9.36 |
| 25-29 | 209 615 | 261 340 | 470 955 | 7.58 |
| 30-34 | 180 198 | 235 412 | 415 609 | 6.69 |
| 35-39 | 168 638 | 219 197 | 387 835 | 6.24 |
| 40-44 | 149 955 | 194 952 | 344 907 | 5.55 |
| 45-49 | 127 846 | 167 719 | 295 565 | 4.75 |
| 50-54 | 108 714 | 140 978 | 249 692 | 4.02 |
| 55-59 | 93 682 | 119 911 | 213 593 | 3.44 |
| 60-64 | 78 899 | 100 625 | 179 525 | 2.89 |
| 65-69 | 65 846 | 82 450 | 148 295 | 2.39 |
| 70-74 | 52 993 | 66 934 | 119 928 | 1.93 |
| 75-79 | 38 678 | 49 603 | 88 281 | 1.42 |
| 80+ | 41 443 | 56 363 | 97 806 | 1.57 |
| Age group | Male | Female | Total | Percent |
|---|---|---|---|---|
| 0-14 | 980 070 | 939 024 | 1 919 094 | 30.87 |
| 15-64 | 1 746 254 | 2 096 484 | 3 842 738 | 61.82 |
| 65+ | 198 960 | 255 350 | 454 310 | 7.31 |
Other demographic statistics
Demographic statistics according to the World Population Review in 2019.[22]
- One birth every 5 minutes
- One death every 12 minutes
- One net migrant every 13 minutes
- Net gain of one person every 16 minutes
Demographic statistics according to the CIA World Factbook, unless otherwise indicated.[23]
Population
- 6,187,271 (July 2018 est.)
Ethnic groups
- mestizo 86.3%, white 12.7%, Amerindian 0.2% (includes Lenca, Kakawira, Nahua-Pipil), black 0.1%, other 0.6% (2007 est.)
Age structure
- 0-14 years: 25.3% (male 802,813 /female 762,852)
- 15-24 years: 19.88% (male 619,550 /female 610,725)
- 25-54 years: 39.8% (male 1,143,226 /female 1,319,138)
- 55-64 years: 7.32% (male 198,513 /female 254,640)
- 65 years and over: 7.69% (male 208,817 /female 266,997) (2018 est.)
Demographic profile
El Salvador is the smallest and most densely populated country in Central America. It is well into its demographic transition, experiencing slower population growth, a decline in its number of youths, and the gradual aging of its population. The increased use of family planning has substantially lowered El Salvador's fertility rate, from approximately 6 children per woman in the 1970s to replacement level today. A 2008 national family planning survey showed that female sterilization remained the most common contraception method in El Salvador - its sterilization rate is among the highest in Latin America and the Caribbean - but that the use of injectable contraceptives is growing. Fertility differences between rich and poor and urban and rural women are narrowing.[2]
Median age
- total: 27.6 years. Country comparison to the world: 143rd
- male: 26.1 years
- female: 29.1 years (2018 est.)
Birth rate
- 16.1 births/1,000 population (2018 est.) Country comparison to the world: 111st
Death rate
- 5.8 deaths/1,000 population (2018 est.) Country comparison to the world: 173rd
Total fertility rate
- 1.84 children born/woman (2018 est.) Country comparison to the world: 146th
Net migration rate
- -7.8 migrant(s)/1,000 population (2018 est.) Country comparison to the world: 210th
Population growth rate
- 0.25% (2018 est.) Country comparison to the world: 177th
Mother's mean age at first birth
- 20.8 years (2008 est.)
- note: median age at first birth among women 25-29
Contraceptive prevalence rate
- 72% (2014)
Dependency ratios
- total dependency ratio: 56.8 (2015 est.)
- youth dependency ratio: 44.4 (2015 est.)
- elderly dependency ratio: 12.4 (2015 est.)
- potential support ratio: 8 (2015 est.)
Life expectancy at birth
- total population: 75.1 years. Country comparison to the world: 114th
- male: 71.8 years
- female: 78.6 years (2018 est.)
Urbanization
- urban population: 72% of total population (2018)
- rate of urbanization: 1.57% annual rate of change (2015-20 est.)
Languages
- Spanish (official)
- English (among educated and Salvadoran Americans)
- Arabic (among Palestinian Salvadoran)
- Nawat (among Native American indigenous peoples)
- Salvadoran Sign Language (SSL)
Religions
Roman Catholic 50%, Protestant 36%, other 2%, none 12% (2014 est.)
Languages
- Spanish (official), English among Salvadoran Americans, Arabic among Palestinian Salvadoran and Nawat language (among Native American indigenous peoples)
Literacy
definition: age 15 and over can read and write (2016 est.)
- total population: 88.1%
- male: 90.3%
- female: 86.3% (2016 est.)
School life expectancy (primary to tertiary education)
- total: 12 years
- male: 12 years
- female: 12 years (2016)
Unemployment, youth ages 15-24
- total: 9.8%. Country comparison to the world: 128th
- male: 9.6%
- female: 10.1% (2016)
Nationality
- Noun: Salvadoran(s)
- Adjective: Salvadoran
Notable Salvadoran people
 McLeod Bethel-Thompson is an American football quarterback who is a free agent. He played college football at Sacramento State.
 Jorge Cañas was a Salvadoran football player.
 Emerson Hernández is a Salvadorean race walker.
 Darwin Cerén is a Salvadoran footballer who plays for the Major League Soccer club San Jose Earthquakes and is captain of the El Salvador national team
 Arturo Álvarez (footballer, born 1985) is a Salvadoran American footballer who plays as a winger and forward for Major League Soccer club Chicago Fire
 Dustin Corea is a Salvadoran international footballer who plays for FC Edmonton.
.jpg) Eriq Zavaleta is an American soccer player who plays as a center back for Toronto FC of Major League Soccer.
Eriq Zavaleta is an American soccer player who plays as a center back for Toronto FC of Major League Soccer. Steve Purdy is a Salvadoran American footballer who plays as a defender for Orange County Blues in the USL. He has played for the El Salvador national team at the CONCACAF Gold Cup in 2011 and 2013.
_(28133946721).jpg) Marcelo Arévalo is a professional Salvadoran tennis player
Marcelo Arévalo is a professional Salvadoran tennis player Jaime Alas is a Salvadoran professional footballer
 Rodolfo Zelaya is a Salvadoran professional footballer
 Rafael Burgos is a Salvadoran professional forward
 Marcos Villatoro is a writer from the United States. He is the author of six novels, two collections of poetry and a memoir, and the producer/director of the documentary “Tamale Road: A Memoir from El Salvador.”
.jpg) Nayib Bukele is a Salvadoran politician and businessman
Nayib Bukele is a Salvadoran politician and businessman Francisco Rubio (astronaut) is a US Army helicopter pilot, flight surgeon, and NASA astronaut candidate of the class of 2017.
 Johnny Wright is a Salvadoran politician
 Mauricio Interiano is a Salvadoran politician
 Carlos Calleja is a Salvadoran politician
 José Atilio Benítez Parada is Salvadoran General, ambassador and former Minister of Defense.
 Roberto José d'Aubuisson Munguía is a Salvadoran politician
.jpg) Juan Jose Daboub is the chairman and CEO of The Daboub Partnership, Founding Chief Executive Officer of the Global Adaptation Institute and former managing director of the World Bank (2006–2010)
Juan Jose Daboub is the chairman and CEO of The Daboub Partnership, Founding Chief Executive Officer of the Global Adaptation Institute and former managing director of the World Bank (2006–2010).jpg) Mauricio Funes is a Salvadoran politician who was President of El Salvador from June 1, 2009 to June 1, 2014
Mauricio Funes is a Salvadoran politician who was President of El Salvador from June 1, 2009 to June 1, 2014 Luciana Sandoval is a Salvadoran presenter, dancer and former model.
 Somaya Reece is a Salvadoran American hip hop and reality TV star
 Christy Turlington is an American supermodel. Her mother is from El Salvador. She first represented Calvin Klein's Eternity campaign in 1989 and again in 2014 and also represents Maybelline.
 Sabi (singer) is a Salvadoran-American pop singer, songwriter, dancer and actress from Los Angeles, California. She was formerly part of the hip hop girl group, The Bangz. She is currently signed to Warner Bros. Records.
 Ana Yancy Clavel is a Salvadorian beauty queen and TV personality
 Carla Vila is a Salvadoran American actress
 Elizabeth Espinosa reporter and journalist
 Fernando del Valle is an American operatic tenor.
 Allison Iraheta is an American singer from Los Angeles, California, who was the fourth place finalist on the eighth season of American Idol.
.jpg) Victor R. Ramirez is the current state senator for District 47 in Prince George's County, Maryland
Victor R. Ramirez is the current state senator for District 47 in Prince George's County, Maryland J. R. Martinez is an American actor, motivational speaker and former U.S. Army soldier. Starting in 2008, he played the role of Brot Monroe on the ABC daytime drama All My Children. He is the winner of Season 13 of ABC's Dancing with the Stars. Martinez served as the Grand Marshal of the 2012 Rose Parade. He is currently costarring on the syndicated action series SAF3.
 Markos Moulitsas is a Salvadoran American that served in the U.S. Army from 1989 through 1992. He is the founder and publisher of Daily Kos, a blog focusing on liberal and Democratic Party politics in the United States. He co-founded SB Nation, a collection of sports blogs, which is now a part of Vox Media
 Carlos Irigoyen Ruiz was a renowned Salvadoran musician during the 1920s-1940s.
 Evelyn García is a Salvadoran cycle racer who rides for the Fenixs team.
 Herbert Sosa is a Salvadoran professional footballer.
 Ricardo Saprissa was a lifelong athlete, coach, and promoter of sports.
.jpeg) Rosemary Casals is a former American professional tennis player
Rosemary Casals is a former American professional tennis player Richard Menjívar is a Salvadoran international footballer currently playing for the New York Cosmos of the North American Soccer League.
 Edwin Miranda grew up in Los Angeles, California and played four years of college soccer at Cal State-Northridge, where he was twice named Big West Conference Defender of the Year.
 Hala Ayala is an cybersecurity specialist and democrat politician representing the 51st district in the Virginia House of Delegates.
 Alicia Nash was a Salvadoran-American physicist. The wife of mathematician John Forbes Nash, Jr.
 Maribel Arrieta Gálvez was a Salvadoran beauty queen where she represented her country at Miss Universe 1955. Arrieta met Baron Jacques Thuret (of Belgian/French nobility) and both were married in 1963, granting her the title "Baronesa de Thuret".
 Consuelo de Saint Exupéry was a Salvadoran-French writer and artist, and the wife of the French aristocrat, writer and pioneering aviator Antoine de Saint-Exupéry (1900–1944).
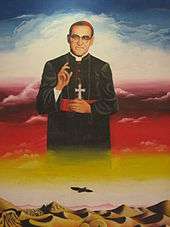 Óscar Romero was a prelate of the Catholic Church in El Salvador who served as the fourth Archbishop of San Salvador. He spoke out against poverty, social injustice, assassinations, and torture. In 1980, Romero was assassinated while celebrating Mass
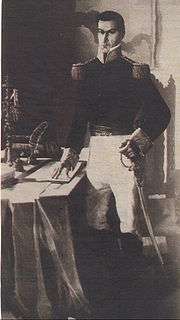 Manuel José Arce was a decorated Salvadoran General and president of the Federal Republic of Central America from 1825 to 1829
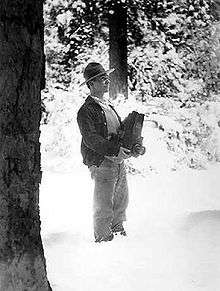 George Melendez Wright was a biologist who conducted the first scientific survey of fauna for the National Park Service in the United States
 Feliciano Ama was an indigenous peasant leader
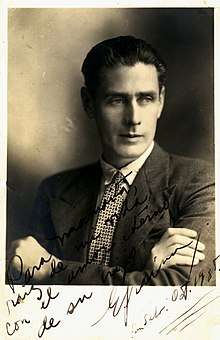 Salarrué was a Salvadoran writer, poet and painter
 Prudencia Ayala was a Salvadoran writer, first female president candidate in Latin America, and social activist who fought for women's rights in El Salvador.
 Farabundo Martí was a Marxist-Leninist activist and a revolutionary leader in El Salvador during the 1932 Salvadoran peasant massacre.
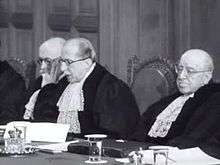 José Gustavo Guerrero was a Salvadoran diplomat and jurist. He served as the last president of the Permanent Court of International Justice from 1937 to 1945; he was also the first president of the International Court of Justice ("World Court") from 1946 to 1949. He help save thousands of jews from the holocaust
 José Castellanos Contreras was a Salvadoran army colonel and diplomat who, while working as El Salvador's Consul General for Geneva during World War II, helped save up to 40,000 Jews
.jpg) Roque Dalton was a Salvadoran poet, essayist, journalist, political activist, and intellectual. He is considered one of Latin America's most compelling poets.
Roque Dalton was a Salvadoran poet, essayist, journalist, political activist, and intellectual. He is considered one of Latin America's most compelling poets..jpg) José Matías Delgado was a Salvadoran priest and doctor known as El Padre de la Patria Salvadoreña (The Father of the Salvadoran Fatherland)
José Matías Delgado was a Salvadoran priest and doctor known as El Padre de la Patria Salvadoreña (The Father of the Salvadoran Fatherland) Gerardo Barrios was President of El Salvador, from 12 March 1859 to 26 October 1863
See also
- El Salvador
- Ethnic groups in Central America
- History of the Jews in El Salvador
- Salvadoran Departments by HDI
References
- "El Salvador". The World Factbook. Central Intelligence Agency.
- "The World Factbook — Central Intelligence Agency". Cia.gov. Retrieved 4 October 2017.

- ""World Population prospects – Population division"". population.un.org. United Nations Department of Economic and Social Affairs, Population Division. Retrieved November 9, 2019.
- ""Overall total population" – World Population Prospects: The 2019 Revision" (xslx). population.un.org (custom data acquired via website). United Nations Department of Economic and Social Affairs, Population Division. Retrieved November 9, 2019.
- "Population Division of the Department of Economic and Social Affairs of the United Nations Secretariat, World Population Prospects: The 2012 Revision". Esa.un.org. Retrieved 4 October 2017.
- Jones, Richard C. (April 1989). "Causes of Salvadoran Migration to the United States". Geographical Review. 79 (2): 183–194. doi:10.2307/215525. JSTOR 215525.
- User, Super. "Institución". Ine.gob.gt. Retrieved 4 October 2017.
- "Mapa de las Migraciones Salvadoreñas". PNUD El Salvador. Retrieved 26 May 2015.
- "U.S. Census website". Retrieved 2011-04-25.
- EL SALVADOR Visa Application - Tourist Visas, Business Visas, Expedited Visas - El Salvador Page Archived 2010-12-01 at the Wayback Machine
- Ayala, Edgardo. "Native People of El Salvador Finally Gain Recognition". Ipsnews.net. Retrieved 20 January 2016.
- "El Salvador - Indigenous peoples". Minority rights groups international. Retrieved 20 January 2016.
- "Jose Napoleon Duarte,Hernandez Martinez,Ungo,Matanza,Central American Common Market,CACM,urban middle class,Christian Democratic Party,powerful families,death squads,Organization of American States,PRUD,International Court Of Justice,urban center,rapid population growth". Countriesquest.com. Retrieved 4 October 2017.
- "Carondelet". NCH Historias Multimedia. Retrieved 27 May 2015.
- Zielger, Matthew. "El Salvador: Central American Palestine of the West?". The Daily Star. Retrieved 27 May 2015.
- "Lebanese Diaspora – Worldwide Geographical Distribution". Retrieved 27 May 2015.
- "AJ Plus: The Palestinians of El Salvador". latinx.com. May 29, 2019.
- "Why So Many Palestinians Live in el Salvador | AJ+".
- "Lebanese Diaspora Worldwide Geographical Distribution".
- "El Salvador vote divides 2 Arab clans".
- "United Nations Statistics Division - Demographic and Social Statistics". Unstats.un.org. Retrieved 4 October 2017.
- "El Salvador Population 2019", World Population Review
- "World Factbook CENTRAL AMERICA : EL SALVADOR", The World Factbook, July 12, 2018
- "Ed Weeks is Salvadorean on his mother's side!", latina.com. Retrieved 24 August 2014.
- "In Bed With Joan – Episode 9: Ed Weeks". Retrieved 24 August 2014.
| Indigenous | |
|---|---|
| Non-Indigenous |
|
Portal | |
| History |
|  | |||
|---|---|---|---|---|---|
| Geography | |||||
| Politics |
| ||||
| Economy | |||||
| Society |
| ||||