Demographics of Namibia
This article is about the demographic features of the population of Namibia, including population density, ethnicity, education level, health of the populace, economic status, religious affiliations and other aspects of the population.
Population
.jpg)
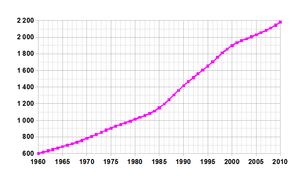
Census results
| Historical populations in thousands | ||
|---|---|---|
| Year | Pop. | ±% p.a. |
| 1921 | 228,916 | — |
| 1936 | 320,457 | +2.27% |
| 1946 | 362,464 | +1.24% |
| 1951 | 439,081 | +3.91% |
| 1970 | 761,010 | +2.94% |
| 1981 | 1,033,196 | +2.82% |
| 1991 | 1,409,915 | +3.16% |
| 2001 | 1,830,330 | +2.64% |
| 2011 | 2,113,077 | +1.45% |
As required by the Namibian Statistics Act #66 of 1976, and in accordance with United Nations recommendations, a census is conducted every ten years. After Namibian independence the first Population and Housing Census was carried out in 1991, further rounds followed in 2001 and 2011.[1] The data collection method is to count every person resident in Namibia wherever they happen to be. This is called the de facto method.[2] For enumeration purposes the country is demarcated into 4,042 enumeration areas. These areas do not overlap with constituency boundaries in order to get reliable data for election purposes as well.[3]
The 2011 Population and Housing Census counted 2,113,077 inhabitants of Namibia. Between 2001 and 2011 the annual population growth was 1.4%, down from 2.6% in the previous ten–year period.[4]
In 2011 the total fertility rate was 3.6 children per woman, down from 4.1 in 2001.
UN estimates
According to the 2019 revision of the World Population Prospects[5][6] the total population was 2,448,301 in 2018, compared to only 485 000 in 1950. The proportion of children below the age of 15 in 2010 was 36.4%, 59.9% was between 15 and 65 years of age, while 3.7% was 65 years or older .[7]
| Total population | Population aged 0–14 (%) | Population aged 15–64 (%) | Population aged 65+ (%) | |
|---|---|---|---|---|
| 1950 | 485 000 | 38.8 | 57.1 | 4.1 |
| 1955 | 538 000 | 40.5 | 55.6 | 4.0 |
| 1960 | 603 000 | 41.6 | 54.7 | 3.7 |
| 1965 | 683 000 | 42.5 | 53.9 | 3.6 |
| 1970 | 780 000 | 43.1 | 53.3 | 3.6 |
| 1975 | 906 000 | 44.3 | 52.2 | 3.5 |
| 1980 | 1 013 000 | 46.6 | 49.9 | 3.5 |
| 1985 | 1 150 000 | 47.0 | 49.5 | 3.5 |
| 1990 | 1 415 000 | 43.7 | 53 | 3.4 |
| 1995 | 1 651 000 | 42 | 54.6 | 3.4 |
| 2000 | 1 896 000 | 40.3 | 56.3 | 3.4 |
| 2005 | 2 080 000 | 38.9 | 57.6 | 3.4 |
| 2010 | 2 283 000 | 36.4 | 59.9 | 3.7 |
Vital statistics
Registration of vital events in Namibia is not complete. The Population Departement of the United Nations prepared the following estimates. [7]
| Period | Live births per year | Deaths per year | Natural change per year | CBR* | CDR* | NC* | TFR* | IMR* |
|---|---|---|---|---|---|---|---|---|
| 1950-1955 | 22 000 | 12 000 | 10 000 | 43.4 | 22.9 | 20.4 | 6.00 | 172 |
| 1955-1960 | 24 000 | 11 000 | 13 000 | 42.7 | 19.9 | 22.8 | 6.10 | 149 |
| 1960-1965 | 27 000 | 11 000 | 16 000 | 42.3 | 17.4 | 24.9 | 6.20 | 130 |
| 1965-1970 | 31 000 | 11 000 | 20 000 | 42.4 | 15.4 | 27.0 | 6.30 | 115 |
| 1970-1975 | 37 000 | 12 000 | 26 000 | 44.2 | 13.8 | 30.4 | 6.60 | 101 |
| 1975-1980 | 42 000 | 12 000 | 30 000 | 43.8 | 12.1 | 31.6 | 6.60 | 88 |
| 1980-1985 | 45 000 | 11 000 | 33 000 | 41.2 | 10.4 | 30.8 | 6.20 | 75 |
| 1985-1990 | 50 000 | 12 000 | 38 000 | 39.1 | 9.5 | 29.6 | 5.55 | 69 |
| 1990-1995 | 56 000 | 14 000 | 43 000 | 36.7 | 8.9 | 27.8 | 4.91 | 62 |
| 1995-2000 | 58 000 | 17 000 | 42 000 | 32.9 | 9.3 | 23.6 | 4.29 | 55 |
| 2000-2005 | 59 000 | 21 000 | 38 000 | 29.9 | 10.6 | 19.3 | 3.81 | 48 |
| 2005-2010 | 60 000 | 19 000 | 41 000 | 27.4 | 8.6 | 18.8 | 3.40 | 38 |
| * CBR = crude birth rate (per 1000); CDR = crude death rate (per 1000); NC = natural change (per 1000); IMR = infant mortality rate per 1000 births; TFR = total fertility rate (number of children per woman) | ||||||||
Fertility and Births
Total Fertility Rate (TFR) (followed by wanted fertility rate in brackets) and Crude Birth Rate (CBR):[8]
| Year | CBR (Total) | TFR (Total) | CBR (Urban) | TFR (Urban) | CBR (Rural) | TFR (Rural) |
|---|---|---|---|---|---|---|
| 1992 | 42 | 5,4 (4,8) | 43 | 4,0 (3,4) | 42 | 6,3 (5,8) |
| 2000 | 30,5 | 4,2 (3,4) | 29,9 | 3,1 (2,4) | 30,8 | 5,1 (4,2) |
| 2006-2007 | 29,2 | 3,6 (2,7) | 28,8 | 2,8 (2,2) | 29,6 | 4,3 (3,3) |
| 2013 | 29,5 | 3,6 (2,9) | 30,0 | 2,9 (2,4) | 29,3 | 4,7 (3,5) |
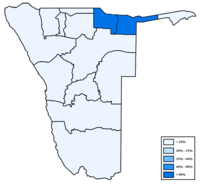
Fertility data as of 2013 (DHS Program):[9]
| Region | Total fertility rate | Percentage of women age 15-49 currently pregnant | Mean number of children ever born to women age 40-49 |
|---|---|---|---|
| Zambezi | 4.2 | 4.5 | 4.4 |
| Erongo | 2.9 | 6.1 | 3.3 |
| Hardap | 3.7 | 3.8 | 3.4 |
| Karas | 3.4 | 6.4 | 3.4 |
| Kavango | 4.6 | 6.8 | 5.4 |
| Khomas | 2.6 | 6.4 | 2.7 |
| Kunene | 4.5 | 8.5 | 4.6 |
| Ohangwena | 5.3 | 9.8 | 5.2 |
| Omaheke | 4.6 | 8.6 | 4.2 |
| Omusati | 4.2 | 6.3 | 3.6 |
| Oshana | 2.7 | 6.2 | 3.1 |
| Oshikoto | 4.2 | 5.7 | 4.0 |
| Otjozondjupa | 4.1 | 5.4 | 4.0 |
Life expectancy at birth
Life expectancy from 1950 to 2015 (UN World Population Prospects)[10]:
| Period | Life expectancy in Years |
|---|---|
| 1950–1955 | 41.75 |
| 1955–1960 | |
| 1960–1965 | |
| 1965–1970 | |
| 1970–1975 | |
| 1975–1980 | |
| 1980–1985 | |
| 1985–1990 | |
| 1990–1995 | |
| 1995–2000 | |
| 2000–2005 | |
| 2005–2010 | |
| 2010–2015 |
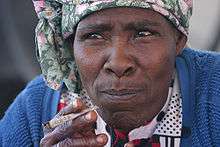
Ethnic groups
Namibians are of diverse ethnic origins. The principal groups are the Ovambo, Kavango, Herero, Himba, Damara, mixed race (Coloured and Rehoboth Baster), White Namibians (Afrikaner, German, Swedish, British and Portuguese), Nama, Caprivian (Lozi), San, and Tswana. The Coloureds and Basters share similar genealogical origins and cultural attributes (such as home language) but nonetheless maintain distinctly separate communal identities, as do most white Namibians and black Namibians, respectively.
The Ovambo make up about half of Namibia's people. The Ovambo, Kavango, and East Caprivian peoples, who occupy the relatively well-watered and wooded northern part of the country, are settled farmers and herders. Historically, they have shown little interest in the central and southern parts of Namibia, where conditions do not suit their traditional way of life.
Until the early 20th century, these tribes had little contact with the Nama, Damara, and Herero, who settled around the central part of the country vying for control of sparse pastureland. German colonial rule destroyed the warmaking ability of the tribes but did not erase their identities or traditional organization. People from the more populous north have settled throughout the country in recent decades as a result of urbanization, industrialization, and the demand for labor.
The minority white population is primarily of South African, British, and German descent, with a few Portuguese. About 60% of the whites speak Afrikaans (a language derived from the 17th century Dutch), 32% speak German, and 7% speak English.
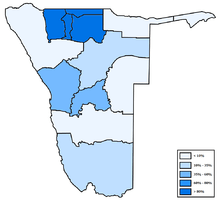
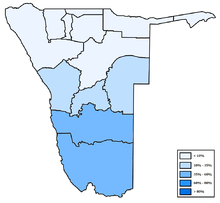
Languages
- Oshiwambo - 48.9%[11]
- Khoekhoegowab - 11.3%
- Afrikaans - 10.4%
- Otjiherero - 8.6%
- RuKwangali - 8.5%
- siLozi - 4.8%
- English (official language) - 3.4%
- Setswana - 0.3%
- Other African languages - 2.3%
- Other - 1.7%
_in_Namibia.png)


Religion
Missionary work during the 19th century drew many Namibians to Christianity, especially Lutheranism. While most Namibian Christians are Lutheran, there also are Roman Catholic, Methodist, Anglican, African Methodist Episcopal, and Dutch Reformed Christians represented.
Other demographic statistics
Modern education and medical care have been extended in varying degrees to most rural areas in recent years. The literacy rate of Africans is generally low except in sections where missionary and government education efforts have been concentrated, such as Ovamboland. The Africans speak various indigenous languages.
Demographic statistics according to the World Population Review in 2019.[12]
- One birth every 7 minutes
- One death every 29 minutes
- One net migrant every 1440 minutes
- Net gain of one person every 10 minutes
The following demographic are from the CIA World Factbook[13] unless otherwise indicated.
Population
- 2,533,224 (July 2018 est.)
Age structure

- 0-14 years: 36.54% (male 467,392 /female 458,190)
- 15-24 years: 20.34% (male 257,190 /female 257,984)
- 25-54 years: 34.74% (male 421,849 /female 458,118)
- 55-64 years: 4.46% (male 50,459 /female 62,478)
- 65 years and over: 3.93% (male 42,381 /female 57,183) (2018 est.)
Birth rate
- 26.8 births/1,000 population (2018 est.) Country comparison to the world: 45th
Death rate
- 7.7 deaths/1,000 population (2018 est.) Country comparison to the world: 101st
Total fertility rate
- 3.21 children born/woman (2018 est.) Country comparison to the world: 47th
Median age
- total: 21.4 years. country comparison to the world: 182nd
- male: 20.7 years
- female: 22.2 years (2018 est.)
Population growth rate
- 1.91% (2018 est.) Country comparison to the world: 52nd
Mother's mean age at first birth
- 21.5 years (2013 est.)
- note: median age at first birth among women 25-29
Contraceptive prevalence rate
- 56.1% (2013)
Net migration rate
- 0 migrant(s)/1,000 population (2017 est.) Country comparison to the world: 94th
Dependency ratios
- total dependency ratio: 68.1 (2015 est.)
- youth dependency ratio: 62.2 (2015 est.)
- elderly dependency ratio: 5.8 (2015 est.)
- potential support ratio: 17.1 (2015 est.)
Urbanization
- urban population: 50% of total population (2018)
- rate of urbanization: 4.2% annual rate of change (2015-20 est.)
Sex ratio
at birth:
1.03 male(s)/female (2017 est.)
under 15 years:
1.02 male(s)/female (2017 est.)
15–64 years:
0.99 male(s)/female (2017 est.)
65 years and over:
0.75 male(s)/female (2017 est.)
total population:
0.96 male(s)/female (2017 est.)
Life expectancy at birth
- total population: 64.4 years (2018 est.)
- male: 62.7 years (2018 est.)
- female: 66.2 years (2018 est.)
HIV/AIDS
adult prevalence rate: 12.1% (2017 est.)
people living with HIV/AIDS: 280,000 (2017 est.)
deaths: 2,700 (2017 est.)
Nationality
noun:
Namibian(s)
adjective:
Namibian
Literacy
definition: age 15 and over can read and write (2015 est.)
- total population: 81.9% (2015 est.)
- male: 79.2% (2015 est.)
- female: 84.5% (2015 est.)
Unemployment, youth ages 15-24
- total: 44.9% (2016 est.)
- male: 37.7% (2016 est.)
- female: 52.5% (2016 est.)
References
- "Census Summary Results". National Planning Commission of Namibia. Archived from the original on 11 January 2012. Retrieved 21 February 2012.
- Kapitako, Alvine (8 August 2011). "Namibia: 2011 Census Officially Launched". New Era. via allafrica.com.
- "Methodology". National Planning Commission of Namibia. Archived from the original on 11 January 2012. Retrieved 21 February 2012.
- Duddy, Jo Maré (28 March 2013). "Census gives snapshot of Namibia's population". The Namibian.
- ""World Population prospects – Population division"". population.un.org. United Nations Department of Economic and Social Affairs, Population Division. Retrieved November 9, 2019.
- ""Overall total population" – World Population Prospects: The 2019 Revision" (xslx). population.un.org (custom data acquired via website). United Nations Department of Economic and Social Affairs, Population Division. Retrieved November 9, 2019.
- Population Division of the Department of Economic and Social Affairs of the United Nations Secretariat, World Population Prospects: The 2010 Revision Archived May 6, 2011, at the Wayback Machine
- "MEASURE DHS: Demographic and Health Surveys". microdata.worldbank.org.
- "Namibia Demographic and Health Survey 2013" (PDF). Namibia Demographic and Health Survey. 2013.
- "World Population Prospects – Population Division – United Nations". Retrieved 2017-07-15.
- "Africa :: NAMIBIA". CIA The World Factbook.
- "Namibia Population 2019", World Population Review
- "The World FactBook - Namibia", The World Factbook, July 12, 2018

External links
| Wikimedia Commons has media related to Demographics of Namibia. |
| Bantu peoples |
| ||||||
|---|---|---|---|---|---|---|---|
| Whites | |||||||
| Coloureds | |||||||
| Capoid | |||||||
| History |
|  | |
|---|---|---|---|
| Geography | |||
| Politics |
| ||
| Economy | |||
| Society |
| ||