Demographics of Moldova
This article is about the demographic features of the population of Moldova, including distribution, ethnicity, languages, religious affiliation and other statistical data.
| Demographics of Moldova | |
|---|---|
 Population in millions, 1950 – January 2009. (Note: Data after 1997 doesn't include regions under the control of Transnistria). | |
| Population | |
| Density | 90.3 (excluding Transnistria) (2019) |
| Growth rate | −0.3 (2016) |
| Birth rate | 10.5 births/1,000 population (2016) |
| Death rate | 10.8 deaths/1,000 population (2016) |
| Life expectancy | 73.21 years (2017) |
| • male | 69.35 years (2017) |
| • female | 76.96 years (2017) |
| Fertility rate | 1.57 children born/woman (2018) |
| Infant mortality rate | 9.4 deaths/1,000 live births (2017) |
| Net migration rate | +0.0 migrant(s)/1,000 population (2012) |
| Age structure | |
| 0–14 years | 16.4% (male 301,150/female 284,400) |
| 15–64 years | 73.6% (male 1,277,900/female 1,341,650) |
| 65 and over | 10.0% (male 133,060/female 222,270) |
| Sex ratio | |
| Total | 0.91 male(s)/female (2008 est.) |
| At birth | 1.06 male(s)/female |
| Under 15 | 1.06 male(s)/female |
| 15–64 years | 0.94 male(s)/female |
| 65 and over | 0.59 male(s)/female |
| Nationality | |
| Nationality | Moldovan(s) |
| Major ethnic | Moldovans 75.1%[2] |
| Minor ethnic | Romanians 7.0%, Ukrainians 6.6%, Gagauz 4.6%, Russians 4.1%, Bulgarians 1.9% |
| Language | |
| Official | Moldovan |
| Spoken | Moldovan/Romanian, Russian, Gagauz (a Turkish dialect) |
Overview of the demographic statistics
According to the 2014 Moldovan Census, 2,789,205 people resided in the areas controlled by the central government of Moldova. Another 209,030 were non-resident citizens living abroad, for a total of 2,998,235.[3]
According to the 2014 Census in Transnistria, 475,007 people lived in the breakaway Transnistria, including the city of Bender, and the other localities de facto controlled by Transnistrian authorities.[4] Thus, the total population of the country in 2014 amounted to 3,473,242.

| Median age | |
|---|---|
| total | 34.3 years (2008 est.) (up from 32.22 years in 2005) |
| male | 32.4 years (up from 30.14 years in 2005) |
| female | 36.4 years (up from 34.27 years in 2005) |
| Literacy rate | |
| total | 96% (1989); 99.1% (2003); 99.1% (2005) |
| male | 99% (1989); 99.6% (2003); 99.7% (2005) |
| female | 94% (1989); 98.7% (2003); 98.6% (2005) |
| definition | age 15 and over can read and write |
| Unemployment rate | |
| 8% (official), 40% (real) | |
| Source: The World Factbook, CIA;[5] UN[6],[7] | |
Urban–rural distribution of population
According to the 2014 census, 1,144,428 residents or 38,2% live in cities while 1,853,807 are rural residents. The largest cities under the control of the constitutional authorities are Chișinău with 644,204 (with 590,631 actual urban dwellers) and Bălți with 102,457 (97,930 urban dwellers). The autonomous territorial unit of Gagauzia has 134,535, out of which 48,666 or 36,2% are urban dwellers. Ungheni is the third largest city with 32,828, followed by Cahul with 28,763, Soroca with 22,196 and Orhei with 21,065.[8]
By district (2004 census)
| no | type | name | population | urban | rural | ||||
|---|---|---|---|---|---|---|---|---|---|
| population | % | cities | population | % | communes | ||||
| 1 | municipality | Chișinău | 712,218 | 644,204 | 90.45% | 7 | 68,014 | 9.55% | 12 |
| 2 | municipality | Bălți | 127,561 | 122,669 | 96.16% | 1 | 4,892 | 3.84% | 2 |
| 3 | auton.territ.unit | Găgăuzia | 155,646 | 58,190 | 37.39% | 3 | 97,456 | 62.61% | 23 |
| 4 | district | Anenii Noi | 81,710 | 8,358 | 10.23% | 1 | 73,352 | 89.77% | 25 |
| 5 | district | Basarabeasca | 28,978 | 11,192 | 38.62% | 1 | 17,786 | 61.38% | 6 |
| 6 | district | Briceni | 78,027 | 14,230 | 18.24% | 2 | 63,797 | 81.76% | 26 |
| 7 | district | Cahul | 119,231 | 35,488 | 29.76% | 1 | 83,743 | 70.24% | 36 |
| 8 | district | Cantemir | 60,001 | 3,872 | 6.45% | 1 | 56,129 | 93.55% | 26 |
| 9 | district | Călărași | 75,075 | 14,516 | 19.34% | 1 | 60,559 | 80.66% | 27 |
| 10 | district | Căușeni | 90,612 | 21,941 | 24.21% | 2 | 68,671 | 75.79% | 25 (out of 28) |
| 11 | district | Cimișlia | 60,925 | 12,858 | 21.10% | 1 | 48,067 | 78.90% | 22 |
| 12 | district | Criuleni | 72,254 | 7,138 | 9.88% | 1 | 65,116 | 90.12% | 24 |
| 13 | district | Dondușeni | 46,442 | 9,801 | 21.10% | 1 | 36,641 | 78.90% | 21 |
| 14 | district | Drochia | 87,092 | 16,606 | 19.07% | 1 | 70,486 | 80.93% | 27 |
| 15 | district | Dubăsari | 43,015 | - | - | - | 34,015 | 100% | 11 |
| 16 | district | Edineț | 81,390 | 23,065 | % | 2 | 58,325 | % | 30 |
| 17 | district | Fălești | 90,320 | 14,931 | % | 1 | 75,389 | % | 32 |
| 18 | district | Florești | 89,389 | 17,086 | % | 3 | 17,086 | % | 37 |
| 19 | district | Glodeni | 60,975 | 10,465 | % | 1 | 50,510 | % | 18 |
| 20 | district | Hîncești | 119,762 | 15,281 | % | 1 | 104,481 | % | 38 |
| 21 | district | Ialoveni | 97,704 | 15,041 | % | 1 | 82,663 | % | 24 |
| 22 | district | Leova | 51,056 | 14,411 | % | 2 | 36,645 | % | 23 |
| 23 | district | Nisporeni | 64,924 | 12,105 | % | 1 | 52,819 | % | 22 |
| 24 | district | Ocnița | 56,510 | 19,270 | % | 3 | 37,240 | % | 18 |
| 25 | district | Orhei | 116,271 | 25,641 | % | 1 | 90,630 | % | 37 |
| 26 | district | Rezina | 48,105 | 10,196 | % | 1 | 37,909 | % | 24 |
| 27 | district | Rîșcani | 69,454 | 13,351 | % | 2 | 56,103 | % | 26 |
| 28 | district | Sîngerei | 87,153 | 15,760 | % | 2 | 71,393 | % | 24 |
| 29 | district | Soroca | 94,986 | 28,362 | % | 1 | 66,624 | % | 34 |
| 30 | district | Strășeni | 88,900 | 19,633 | % | 2 | 69,267 | % | 25 |
| 31 | district | Șoldănești | 42,227 | 6,304 | % | 1 | 35,923 | % | 22 |
| 32 | district | Ștefan Vodă | 70,594 | 7,768 | % | 1 | 62,826 | % | 22 |
| 33 | district | Taraclia | 43,154 | 13,756 | % | 1 | 29,398 | % | 14 |
| 34 | district | Telenești | 70,126 | 6,855 | % | 1 | 63,271 | % | 30 |
| 35 | district | Ungheni | 110,545 | 35,311 | % | 2 | 75,234 | % | 31 |
| Subtotal control by central government | 3,383,332 | 1,305,655 | 38.59% | 54 | 2,077,677 | 61.41% | 844 | ||
| 36 | territorial unit | Transnistria | 383,806 | 280,6401 | 63.85% | 10 | 158,8881 | 36.15% | 69 |
| 37 | municipality | Bender | 91,197 | 88,055 | 96.86% | 1 | 3,142 | 3.14% | 1 |
| 10 | parts of district | Căușeni | 14,935 | - | - | - | 14,935 | 100% | 3 (out of 28) |
| 15 | parts of district | Dubăsari | 715 | - | - | - | 715 | 100% | parts of 1 |
| Subtotal control by breakaway Tiraspol | 555,347 | 377,667 | 68.01% | 11 | 177,680 | 31.99% | 73 | ||
| Total | 3,938,679 | 1,683,322 | 42.74% | 65 | 2,255,357 | 57.26% | 917 | ||
Note: 1The breakaway Transnistrian authorities count as rural the population of the towns of Crasnoe, Maiac, and Tiraspolul Nou. Since their exact population isn't available, so does this table.
Transnistrian-controlled areas (2015 cens.) [9]
| Population | urban | rural | ||||||||||||
|---|---|---|---|---|---|---|---|---|---|---|---|---|---|---|
| population | cities | population | communes | |||||||||||
| Tiraspol | 129,367 | 129,367 | 1 | – | – | |||||||||
| Camenca District | 20 542 | ? | 1 | ? | 12 | |||||||||
| Rîbnița District | 69,000 | ? | 1 | ? | 22 | |||||||||
| Dubăsari District | 31,000 | ? | 1 | ? | 9 | |||||||||
| Grigoriopol District | 40,000 | ?1 | 2 | ?1 | 14 | |||||||||
| Slobozia District | 84,000 | ?2 | 4 | ?2 | 12 | |||||||||
| Subtotal Transnistria | 383,806 | ? | 10 | ? | 69 | |||||||||
| Bender (w/o Proteagailovca) | 91,197 | 91,197 | 1 | – | – | |||||||||
| Proteagailovca | 3,142 | – | – | 3,142 | 1 | |||||||||
| Gîsca | 4,841 | – | – | 4,841 | 1 | |||||||||
| Chițcani (incl. Merenești and Zahorna) | ~9,000 | – | – | ~9,000 | 1 | |||||||||
| Cremenciug | 1,094 | – | – | 1,094 | 1 | |||||||||
| Roghi | 715 | – | – | 715 | parts of 1 | |||||||||
| Subotal other localities | 109,989 | 91,197 | 1 | 18,792 | 4 | |||||||||
| Total Tiraspol-controlled areas | 475,003 | 333,003 | 11 | 142,000 | 73 | |||||||||
Note:
1 The breakaway Transnistrian authorities have counties as urban only the population of the town of Grigoriopol, while that of the town of Maiac was counted as rural.
2 The breakaway Transnistrian authorities have counties as urban only the population of the towns of Slobozia and Dnestrovsc, while those of the towns of Crasnoe and Tiraspolul Nou were counted as rural.
Vital statistics
Bessarabia Governorate (1900-1914)[10]
| Average population | Live births | Deaths | Natural change | Crude birth rate (per 1000) | Crude death rate (per 1000) | Natural change (per 1000) | |
|---|---|---|---|---|---|---|---|
| 1900 | 2,037,000 | 83,306 | 48,480 | 34,826 | 40.9 | 23.8 | 17.1 |
| 1901 | 2,073,000 | 87,797 | 46,296 | 41,501 | 42.3 | 22.3 | 20.0 |
| 1902 | 2,113,000 | 96,641 | 55,423 | 41,218 | 45.7 | 26.2 | 19.5 |
| 1903 | 2,154,000 | 94,936 | 53,236 | 41,700 | 44.1 | 24.7 | 19.4 |
| 1904 | 2,194,000 | 99,265 | 55,436 | 43,829 | 45.3 | 25.3 | 20.0 |
| 1905 | 2,237,000 | 80,085 | 62,387 | 17,698 | 35.8 | 27.9 | 7.9 |
| 1906 | 2,267,000 | 95,090 | 55,638 | 39,452 | 41.9 | 24.5 | 17.4 |
| 1907 | 2,303,000 | 107,195 | 59,964 | 47,231 | 46.5 | 26.0 | 20.5 |
| 1908 | 2,345,000 | 96,088 | 54,772 | 41,316 | 41.0 | 23.4 | 17.6 |
| 1909 | 2,395,000 | 105,681 | 62,498 | 43,183 | 44.1 | 26.1 | 18.0 |
| 1910 | 2,441,000 | 101,544 | 77,356 | 24,188 | 41.6 | 31.7 | 9.9 |
| 1911 | 2,488,000 | 97,864 | 74,093 | 23,771 | 39.3 | 29.8 | 9.6 |
| 1912 | 2,540,000 | 102,654 | 77,431 | 25,223 | 40.4 | 30.5 | 9.9 |
| 1913 | 2,602,000 | 102,397 | 77,745 | 24,652 | 39.4 | 29.9 | 9.5 |
| 1914 | 2,625,000 | 100,871 | 79,202 | 21,669 | 38.4 | 30.2 | 8.3 |
After WW II, total area[11][12]
| Average population | Live births | Deaths | Natural change | Crude birth rate (per 1000) | Crude death rate (per 1000) | Natural change (per 1000) | Total fertility rate | Urban Fertility | Rural Fertility | |
|---|---|---|---|---|---|---|---|---|---|---|
| 1945 | 2,028,000(e) | 42,795 | 78,797 | -36,002 | 21.1 | 38.9 | -17.8 | |||
| 1946 | 2,254,000(e) | 64,462 | 64,371 | 91 | 28.6 | 28.5 | 0.1 | |||
| 1947 | 2,188,000(e) | 57,555 | 165,049 | -107,494 | 26.3 | 75.5 | -49.2 | |||
| 1948 | 2,126,000(e) | 73,123 | 35,846 | 37,277 | 34.4 | 16.9 | 17.5 | |||
| 1949 | 2,236,000(e) | 94,180 | 30,407 | 63,773 | 42.1 | 13.6 | 28.5 | |||
| 1950 | 2,341,000 | 91,137 | 26,363 | 64,774 | 38.9 | 11.3 | 27.7 | |||
| 1951 | 2,381,000 | 91,645 | 25,957 | 65,688 | 38.5 | 10.9 | 27.6 | |||
| 1952 | 2,432,000 | 80,918 | 30,968 | 49,950 | 33.3 | 12.7 | 20.5 | |||
| 1953 | 2,491,000 | 79,041 | 23,257 | 55,784 | 31.7 | 9.3 | 22.4 | |||
| 1954 | 2,557,000 | 83,607 | 24,077 | 59,530 | 32.7 | 9.4 | 23.3 | |||
| 1955 | 2,627,000 | 79,772 | 21,864 | 57,908 | 30.4 | 8.3 | 22.0 | |||
| 1956 | 2,701,000 | 81,372 | 20,109 | 61,263 | 30.1 | 7.4 | 22.7 | |||
| 1957 | 2,777,000 | 85,743 | 21,114 | 64,629 | 30.9 | 7.6 | 23.3 | |||
| 1958 | 2,853,000 | 87,502 | 18,741 | 68,761 | 30.7 | 6.6 | 24.1 | 3.54 | ||
| 1959 | 2,929,000 | 92,176 | 21,467 | 70,709 | 31.5 | 7.3 | 24.1 | 3.64 | ||
| 1960 | 3,003,000 | 87,910 | 19,290 | 68,620 | 29.3 | 6.4 | 22.9 | 3.41 | ||
| 1961 | 3,073,000 | 86,683 | 19,590 | 67,093 | 28.2 | 6.4 | 21.8 | 3.20 | ||
| 1962 | 3,141,000 | 80,494 | 21,365 | 59,129 | 25.6 | 6.8 | 18.8 | 3.00 | ||
| 1963 | 3,208,000 | 78,422 | 20,737 | 57,685 | 24.4 | 6.5 | 18.0 | 2.89 | ||
| 1964 | 3,273,000 | 73,583 | 19,944 | 53,639 | 22.5 | 6.1 | 16.4 | 2.71 | ||
| 1965 | 3,335,000 | 67,996 | 20,571 | 47,425 | 20.4 | 6.2 | 14.2 | 2.68 | ||
| 1966 | 3,395,000 | 71,406 | 21,474 | 49,326 | 21.0 | 6.3 | 14.5 | 2.73 | ||
| 1967 | 3,453,000 | 71,380 | 23,406 | 47,294 | 20.7 | 6.8 | 13.7 | 2.69 | ||
| 1968 | 3,506,000 | 69,997 | 24,268 | 45,532 | 20.0 | 6.9 | 13.0 | 2.65 | ||
| 1969 | 3,549,000 | 67,575 | 26,249 | 40,651 | 19.0 | 7.4 | 11.5 | 2.58 | ||
| 1970 | 3,594,000 | 69,778 | 26,577 | 43,201 | 19.4 | 7.4 | 12.0 | 2.56 | ||
| 1971 | 3,647,000 | 73,643 | 27,889 | 45,754 | 20.2 | 7.6 | 12.5 | 2.63 | ||
| 1972 | 3,700,000 | 76,198 | 28,001 | 48,197 | 20.6 | 7.6 | 13.0 | 2.63 | ||
| 1973 | 3,748,000 | 76,339 | 30,756 | 45,583 | 20.4 | 8.2 | 12.2 | 2.59 | ||
| 1974 | 3,794,000 | 77,474 | 32,216 | 45,258 | 20.4 | 8.5 | 11.9 | 2.55 | ||
| 1975 | 3,839,000 | 79,169 | 35,635 | 43,534 | 20.6 | 9.3 | 11.3 | 2.52 | ||
| 1976 | 3,877,000 | 79,863 | 34,812 | 45,051 | 20.6 | 9.0 | 11.6 | 2.46 | ||
| 1977 | 3,910,000 | 79,022 | 37,250 | 41,772 | 20.2 | 9.5 | 10.7 | 2.40 | ||
| 1978 | 3,936,000 | 78,994 | 38,410 | 40,584 | 20.1 | 9.8 | 10.3 | 2.38 | 1.70 | 3.00 |
| 1979 | 3,967,000 | 80,152 | 41,729 | 38,423 | 20.2 | 10.5 | 9.7 | 2.39 | 1.80 | 2.90 |
| 1980 | 4,010,000 | 79,580 | 40,472 | 39,108 | 19.8 | 10.1 | 9.8 | 2.41 | 1.80 | 2.90 |
| 1981 | 4,054,000 | 82,279 | 41,476 | 40,803 | 20.3 | 10.2 | 10.1 | 2.45 | 1.80 | 3.10 |
| 1982 | 4,097,000 | 83,258 | 41,046 | 42,212 | 20.3 | 10.0 | 10.3 | 2.43 | 1.79 | 3.19 |
| 1983 | 4,137,000 | 91,304 | 44,329 | 46,975 | 22.1 | 10.7 | 11.4 | 2.57 | 1.87 | 3.46 |
| 1984 | 4,175,000 | 89,637 | 45,537 | 44,100 | 21.5 | 10.9 | 10.6 | 2.67 | 1.95 | 3.65 |
| 1985 | 4,214,000 | 90,453 | 46,075 | 44,378 | 21.5 | 10.9 | 10.5 | 2.70 | 2.00 | 3.70 |
| 1986 | 4,255,000 | 94,726 | 40,437 | 54,289 | 22.3 | 9.5 | 12.8 | 2.78 | 2.00 | 3.80 |
| 1987 | 4,290,000 | 91,762 | 40,185 | 51,577 | 21.4 | 9.4 | 12.0 | 2.70 | 2.10 | 3.80 |
| 1988 | 4,321,000 | 88,568 | 40,912 | 47,656 | 20.5 | 9.5 | 11.0 | 2.63 | 2.00 | 3.60 |
| 1989 | 4,349,000 | 82,221 | 40,113 | 42,108 | 18.9 | 9.2 | 9.7 | 2.46 | 2.02 | 3.00 |
| 1990 | 4,364,000 | 77,085 | 42,427 | 34,658 | 17.7 | 9.7 | 7.9 | 2.39 | 1.91 | 3.07 |
| 1991 | 4,363,000 | 72,020 | 45,849 | 26,171 | 16.5 | 10.5 | 6.0 | 2.26 | 1.79 | 2.84 |
| 1992 | 4,353,000 | 69,654 | 44,522 | 25,132 | 16.0 | 10.2 | 5.8 | 2.21 | 1.68 | 2.86 |
| 1993 | 4,350,000 | 66,179 | 46,637 | 19,542 | 15.2 | 10.7 | 4.5 | 2.10 | 1.53 | 2.77 |
| 1994 | 4,350,000 | 62,085 | 52,153 | 9,932 | 14.3 | 12.0 | 2.3 | 1.95 | 1.44 | 2.54 |
| 1995 | 4,340,000 | 56,411 | 52,969 | 3,442 | 13.0 | 12.2 | 0.8 | 1.76 | 1.31 | 2.24 |
| 1996 | 4,325,000 | 51,865 | 49,748 | 2,117 | 12.0 | 11.5 | 0.5 | 1.60 | 1.19 | 2.05 |
| 1997 | 4,311,000 | 51,286 | 51,138 | 148 | 11.9 | 11.9 | 0.0 | 1.55 | ||
| 1998 | 4,299,000 | 46,755 | 47,691 | -936 | 10.9 | 11.1 | -0.2 | 1.48 | ||
| 1999 | 4,287,000 | 43,511 | 48,904 | -5,393 | 10.1 | 11.4 | -1.3 | 1.43 |
(e)= estimate
Moldova under the central government control
| Average population | Live births | Deaths | Natural change | Crude birth rate (per 1000) | Crude death rate (per 1000) | Natural change (per 1000) | Total fertility rate (TFR) | Urban TFR | Rural TFR | Life Expectancy (total) |
Life Expectancy (male) |
Life Expectancy (female) | |
|---|---|---|---|---|---|---|---|---|---|---|---|---|---|
| 1997 | 3,654,000 | 45,583 | 42,957 | 2,626 | 12.5 | 11.8 | 0.7 | 1.73 | 1.36 | 2.09 | 66.61 | 62.86 | 70.30 |
| 1998 | 3,652,000 | 41,332 | 39,922 | 1,410 | 11.3 | 10.9 | 0.4 | 1.67 | 1.32 | 2.03 | 67.77 | 64.03 | 71.39 |
| 1999 | 3,647,000 | 38,501 | 41,315 | -2,814 | 10.6 | 11.3 | -0.8 | 1.61 | 1.26 | 1.97 | 67.44 | 63.74 | 71.04 |
| 2000 | 3,640,000 | 36,939 | 41,224 | -4,285 | 10.2 | 11.3 | -1.2 | 1.57 | 1.23 | 1.95 | 67.59 | 63.87 | 71.22 |
| 2001 | 3,631,000 | 36,448 | 40,075 | -3,627 | 10.0 | 11.0 | -1.0 | 1.48 | 1.21 | 1.92 | 68.20 | 64.50 | 71.75 |
| 2002 | 3,623,000 | 35,705 | 41,852 | -6,147 | 9.9 | 11.6 | -1.7 | 1.41 | 1.13 | 1.89 | 68.13 | 64.40 | 71.71 |
| 2003 | 3,613,000 | 36,471 | 43,079 | -6,608 | 10.1 | 11.9 | -1.8 | 1.47 | 1.18 | 1.88 | 68.13 | 64.47 | 71.64 |
| 2004 | 3,604,000 | 38,272 | 41,668 | -3,396 | 10.6 | 11.6 | -0.9 | 1.50 | 1.19 | 1.91 | 68.38 | 64.50 | 72.16 |
| 2005 | 3,595,000 | 37,695 | 44,689 | -6,994 | 10.5 | 12.4 | -1.9 | 1.219 | 0.94 | 1.301 | 67.85 | 63.84 | 71.66 |
| 2006 | 3,586,000 | 37,587 | 43,137 | -5,550 | 10.5 | 12.0 | -1.5 | 1.228 | 1.025 | 1.387 | 68.40 | 64.57 | 72.23 |
| 2007 | 3,577,000 | 37,973 | 43,050 | -5,077 | 10.6 | 12.0 | -1.4 | 1.256 | 0.973 | 1.543 | 68.79 | 65.04 | 72.56 |
| 2008 | 3,570,000 | 39,018 | 41,948 | -2,930 | 10.9 | 11.7 | -0.8 | 1.277 | 1.018 | 1.533 | 69.36 | 65.55 | 73.17 |
| 2009 | 3,566,000 | 40,809 | 42,122 | -1,313 | 11.4 | 11.8 | -0.4 | 1.326 | 1.048 | 1.582 | 69.31 | 65.31 | 73.37 |
| 2010 | 3,563,000 | 40,474 | 43,631 | -3,157 | 11.4 | 12.3 | -0.9 | 1.309 | 1.055 | 1.531 | 69.11 | 65.00 | 73.41 |
| 2011 | 3,560,000 | 39,182 | 39,249 | -67 | 11.0 | 11.0 | -0.0 | 1.266 | 1.009 | 1.482 | 70.88 | 66.82 | 74.93 |
| 2012 | 3,560,000 | 39,234 | 39,560 | -326 | 11.0 | 11.1 | -0.1 | 1.279 | 1.030 | 1.483 | 71.12 | 67.24 | 74.99 |
| 2013 | 3,559,000 | 37,859 | 38,060 | -201 | 10.6 | 10.7 | -0.1 | 1.238 | 0.975 | 1.449 | 71.85 | 68.05 | 75.55 |
| 2014* | 2,869,000 | 40,909 | 39,555 | 1,354 | 14.3 | 13.8 | 0.5 | 1.82 | 69.30 | 65.20 | 73.60 | ||
| 2015 | 2,844,000 | 40,855 | 39,848 | 1,007 | 14.4 | 14.1 | 0.3 | 1.87 | 69.30 | 65.10 | 73.70 | ||
| 2016 | 2,824,000 | 39,961 | 38,454 | 1,507 | 14.3 | 13.7 | 0.6 | 1.89 | 69.80 | 65.60 | 74.20 | ||
| 2017 | 2,779,000 | 36,640 | 36,820 | -180 | 13.3 | 13.3 | -0.0 | 1.82 | 70.80 | 66.70 | 75.00 | ||
| 2018 | 2,730,000 | 34,738 | 37,285 | -2,547 | 12.8 | 13.7 | -0.9 | 1.82 | 70.60 | 66.30 | 75.00 | ||
| 2019(p)[13] | 2,681,000 | 29,678 | 36,799 | -7,121 | 11.1 | 13.7 | -2.7 |
- Starting with 2014, the sharp changes[14] in the statistics are because of the new calculation methods and according with the latest census, and include only data of resident people that lived in the country predominantly during the last 12 months, regardless of temporary absences (for the purpose of recreation, vacations, visits to relatives and friends, business, medical treatment, religious pilgrimages, etc.).[15]
Current vital statistics
- Births January–December 2018 =

- Births January–December 2019 =
- Deaths January–December 2018 =

- Deaths January–December 2019 =
- Natural increase January–December 2018 =
- Natural increase January–December 2019 =
Transnistrian-controlled areas[16]
| Average population | Live births | Deaths | Natural change | Crude birth rate (per 1000) | Crude death rate (per 1000) | Natural change (per 1000) | |
|---|---|---|---|---|---|---|---|
| 1997 | 657,000 | 5,703 | 8,181 | -2,478 | 8.7 | 12.5 | -3.8 |
| 1998 | 647,000 | 5,423 | 7,769 | -2,346 | 8.4 | 12.0 | -3.6 |
| 1999 | 640,000 | 5,010 | 7,589 | -2,579 | 7.8 | 11.9 | -4.0 |
| 2000 | 656,000 | 5,010 | 7,770 | -2,760 | 7.6 | 11.8 | -4.2 |
| 2001 | 647,000 | 4,530 | 7,770 | -3,240 | 7.0 | 12.0 | -5.0 |
| 2002 | 638,000 | 4,660 | 8,100 | -3,440 | 7.3 | 12.7 | -5.4 |
| 2003 | 629,000 | 4,460 | 8,170 | -3,710 | 7.1 | 13.0 | -5.9 |
| 2004 | 558,000 | 4,840 | 8,031 | -3,191 | 8.7 | 14.4 | -5.7 |
| 2005 | 551,000 | 4,664 | 8,186 | -3,522 | 8.5 | 14.8 | -6.4 |
| 2006 | 544,000 | 4,840 | 8,320 | -3,480 | 8.9 | 15.3 | -6.4 |
| 2007 | 537,000 | 4,893 | 8,132 | -3,239 | 9.1 | 15.1 | -6.0 |
| 2008 | 531,000 | 5,290 | 7,967 | -2,677 | 10.0 | 15.0 | -5.0 |
| 2009 | 525,000 | 5,189 | 7,454 | -2,265 | 9.9 | 14.2 | -4.3 |
| 2010 | 520,000 | 5,189 | 7,709 | -2,520 | 10.0 | 14.8 | -4.8 |
| 2011 | 516,000 | 4,999 | 7,289 | -2,290 | 9.7 | 14.1 | -4.4 |
| 2012 | 511,000 | 5,173 | 7,280 | -2,107 | 10.1 | 14.2 | -4.1 |
| 2013 | 507,000 | 4,825 | 6,867 | -2,042 | 9.5 | 13.5 | -4.0 |
| 2014 | 503,000 | ||||||
| 2015 | 475,000 | ||||||
| 2016 | 471,000 | 3,372 | 5,007 | -1,635 | 7.2 | 10.6 | -3.4 |
| 2017 | 469,000 | 3,068 | 4,992 | -1,924 | 6.5 | 10.6 | -4.1 |
Fertility Rate (The Demographic Health Survey) [17]
Fertility Rate (TFR) (Wanted Fertility Rate) and CBR (Crude Birth Rate):
| Year | CBR (Total) | TFR (Total) | CBR (Urban) | TFR (Urban) | CBR (Rural) | TFR (Rural) |
|---|---|---|---|---|---|---|
| 2005 | 12,0 | 1,7 | 12,5 | 1,5 | 11,7 | 1,8 |
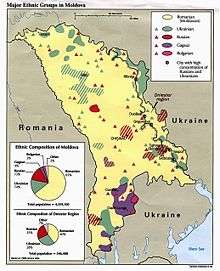
Ethnic groups
Out of the 2,804,801 people covered by the 2014 Moldovan census, 2,754,719 gave an answer as to their ethnic affiliation. Among them, 2,068,068 or 73.7% declared themselves Moldovans and 192,800 or 6.9% Romanians.[18] Some organisations like the Liberal party of Moldova have criticised the census results, claiming Romanians comprise 85% of the population and that census officials have pressured respondents to declare themselves Moldovans instead of Romanians and have purposefully failed to cover urban respondents who are more likely to declared themselves Romanians as opposed to Moldovans [19]
At the same time, 181,035 declared themselves Ukrainians, 111,726 Russians, 126,010 Gagauz and 51,867 Bulgarians. The proportion of Ukrainians and Russians in the area controlled by Chișinău has fallen from 8,4% to 6,5% and 5,9% to 4,0% respectively between 2004 and 2014. Meanwhile, the percentage of Gagauz has risen slightly from 4,4% in 2004 to 4,5% in 2014.[8]
The proportion of Ukrainians and Russians in the previous 2004 census also decreased considerably in comparison to the last Soviet census in 1989: from 13.8% to 11.2% and from 13.0% to 9.4% respectively out of the combined population including Transnistria. This is mostly due to emigration.
Ukrainians mostly live in the east (Transnistria) and the north, while Russians mostly live in urban areas: 27% of all Russians live in Chișinău, 18% live in Tiraspol, 11% in Bender and 6% in Bălți. Most of the Gagauz live in the south of Moldova in the autonomous region of Gagauzia.
Total area

.jpg)
| Ethnic group |
census 19591 | census 19702 | census 19793 | census 19894 | census 20045 | census 20145 | ||||||
|---|---|---|---|---|---|---|---|---|---|---|---|---|
| Number | % | Number | % | Number | % | Number | % | Number | % | Number | % | |
| Moldovans8 | 1,886,566 | 65.4 | 2,303,916 | 64.6 | 2,525,687 | 63.9 | 2,794,749 | 64.5 | 2,742,231 | 69.6 | 2,068,058 | 75.1 |
| Romanians | 1,663 | 0.1 | 1,581 | 0.0 | 1,657 | 0.0 | 2,477 | 0.1 | 73,529 | 1.9 | 192,800 | 7.0 |
| Ukrainians | 420,820 | 14.6 | 506,560 | 14.2 | 560,679 | 14.2 | 600,366 | 13.8 | 442,475 | 11.2 | 181,035 | 6.6 |
| Gagauzians | 95,856 | 3.3 | 124,902 | 3.5 | 138,000 | 3.5 | 153,548 | 3.5 | 151,596 | 3.8 | 126,010 | 4.6 |
| Russians | 292,930 | 10.2 | 414,444 | 11.6 | 505,730 | 12.8 | 562,069 | 13.0 | 369,896 | 9.4 | 111,726 | 4.1 |
| Bulgarians | 61,652 | 2.1 | 73,776 | 2.1 | 80,665 | 2.0 | 88,419 | 2.0 | 79,520 | 2.0 | 51,867 | 1.9 |
| Romani | 7,265 | 0.3 | 9,235 | 0.3 | 10,666 | 0.3 | 11,571 | 0.3 | 12,778 | 0.3 | 9,323 | 0.3 |
| Jews | 95,104 | 3.3 | 98,062 | 2.7 | 80,124 | 2.0 | 65,799 | 1.5 | 4,867 | 0.1 | 1,601 | 0.05 |
| Poles | 4,783 | 0.2 | 4,899 | 0.1 | 4,961 | 0.1 | 4,739 | 0.1 | 4,174 | 0.1 | 1,404 | 0.05 |
| Others | 17,838 | 0.6 | 31,498 | 0.9 | 41,587 | 1.1 | 51,623 | 1.2 | 57,613 | 1.5 | 10,900 | 0.5 |
| Total | 2,884,477 | 3,568,873 | 3,949,756 | 4,335,360 | 3,938,679 | 2,998,2355 | ||||||
| 1 Source: . 2 Source: . 3 Source: . 4 Source: . 5 Source: 6 2004 combined censuses of the government controlled area and Transnistria 6 2014 census only in government controlled area. 8 There is an ongoing controversy, whether Romanians and Moldovans should be counted together. | ||||||||||||
Declared country of birth for the current inhabitants of the part of Moldova under the central government control, according to the 2004 census:
| ethnic group | total population | urban | rural | |||||||||||||||
|---|---|---|---|---|---|---|---|---|---|---|---|---|---|---|---|---|---|---|
| total | Moldova | former USSR | other countries | non-declared | total | Moldova | former USSR | other countries | non-declared | total | Moldova | former USSR | other countries | non-declared | ||||
| Moldovans and Romanians | 2,638,125 100% | 2,604,051 98.71% | 30,360 1.15% | 3,345 0.13% | 369 0.01% | 870,445 100% | 848,554 % | 19,501 % | 2,081 % | 309 % | 1,767,680 100% | 1,755,497 % | 10,859 % | 1,264 % | 60 % | |||
| Ukrainians | 282,406 100% | 227,750 80.65% | 54,036 19.13% | 598 0.21% | 22 0.01% | 145,890 100% | 103,039 % | 42,318 % | 514 % | 19 % | 136,516 100% | % | 11,718 % | 84 % | 3 % | |||
| Russians | 201,218 100% | 129,664 64.44% | 70,380 34.98% | 1,096 0.54% | 78 0.04% | 166,395 100% | 106,580 % | 58,739 % | 1,011 % | 65 % | 34,823 100% | 23,084 % | 11,641 % | 85 % | 13 % | |||
| Gagauzians | 147,500 100% | 144,268 97.81% | 3,101 2.10% | 120 0.08% | 11 0.01% | 53,613 100% | 51,586 % | 1,941 % | 76 % | 10 % | 93,887 100% | 92,682 % | 1,160 % | 44 % | 1 % | |||
| Bulgarians | 65,662 100% | 59,489 90.60% | 5,968 9.09% | 199 0.30% | 6 0.01% | 29,447 100% | 25,215 % | 4,071 % | 156 % | 5 % | 36,215 100% | 34,274 % | 1,897 % | 43 % | 1 % | |||
| others | 34,401 100% | 22,702 65.99% | 10,797 31.39% | 894 2.60% | 8 0.02% | 26,058 100% | 16,973 % | 8,358 % | 722 % | 5 % | 8,343 100% | 5,729 % | 2,439 % | 172 % | 3 % | |||
| non-declared | 14,020 100% | 13,894 99.10% | 12 0.09% | 28 0.20% | 86 0.61% | 13,807 100% | 13,668 % | 9 % | 27 % | 83 % | 213 100% | 206 % | 3 % | 1 % | 3 % | |||
| Total | 3,383,332 100% | 3,201,818 94.64% | 174,654 5.16% | 6,280 0.19% | 580 0.02% | 1,305,655 100% | 1,165,635 89.28% | 134,937 10.33% | 4,587 0.35% | 496 0.04% | 2,077,677 100% | 2,036,183 98.00% | 39,717 1.91% | 1,693 0.08% | 84 0.004% | |||
Population by district, according to the 2004 census:
| Population | Moldovans1 | Ukrainians | Russians | Gagauzians | Bulgarians | Romanians1 | Jews | Poles | Gypsies | others | |
|---|---|---|---|---|---|---|---|---|---|---|---|
| Chișinău | 712,218 | 481,626
|
58,945
|
99,149
|
6,446
|
8,868
|
31,984
|
2,649
|
834
|
507
|
21,210
|
| Bălți | 127,561 | 66,877
|
30,288
|
24,526
|
243
|
297
|
2,258
|
411
|
862
|
272
|
1,527
|
| Gagauzia | 155,646 | 7,481
|
4,919
|
5,941
|
127,835
|
8,013
|
38
|
17
|
28
|
486
|
888
|
| Anenii Noi | 81,710 | 68,761
|
6,526
|
4,135
|
235
|
481
|
857
|
17
|
28
|
228
|
442
|
| Basarabeasca | 28,978 | 20,218
|
1,948
|
2,568
|
2,220
|
1,544
|
70
|
13
|
5
|
216
|
176
|
| Briceni | 78,027 | 55,123
|
19,939
|
2,061
|
59
|
45
|
314
|
84
|
10
|
187
|
205
|
| Cahul | 119,231 | 91,001
|
7,842
|
7,702
|
3,665
|
5,816
|
2,095
|
40
|
29
|
238
|
803
|
| Cantemir | 60,001 | 52,986
|
969
|
710
|
519
|
3,736
|
910
|
–
|
11
|
43
|
117
|
| Călărași | 75,075 | 69,190
|
2,799
|
947
|
54
|
47
|
1,490
|
21
|
11
|
378
|
138
|
| Căușeni | 90,612 | 79,432
|
2,469
|
3,839
|
653
|
1,108
|
2,844
|
8
|
9
|
30
|
220
|
| Cimișlia | 60,925 | 52,972
|
3,376
|
2,371
|
278
|
1,341
|
331
|
7
|
10
|
95
|
144
|
| Criuleni | 72,254 | 67,046
|
2,692
|
1,008
|
49
|
72
|
1,170
|
6
|
6
|
36
|
169
|
| Dondușeni | 46,442 | 37,302
|
5,893
|
2,714
|
31
|
36
|
247
|
12
|
15
|
68
|
124
|
| Drochia | 87,092 | 74,369
|
9,849
|
1,641
|
44
|
33
|
675
|
14
|
10
|
272
|
185
|
| Dubăsari | 34,015 | 32,652
|
521
|
611
|
45
|
16
|
102
|
9
|
2
|
–
|
57
|
| Edineț | 81,390 | 58,749
|
16,084
|
5,084
|
143
|
91
|
446
|
23
|
26
|
499
|
245
|
| Fălești | 90,320 | 75,863
|
10,711
|
3,064
|
39
|
32
|
306
|
6
|
20
|
57
|
222
|
| Florești | 89,389 | 75,797
|
8,023
|
4,633
|
45
|
51
|
433
|
19
|
29
|
120
|
239
|
| Glodeni | 60,975 | 46,317
|
11,918
|
1,693
|
32
|
44
|
329
|
8
|
174
|
303
|
157
|
| Hîncești | 119,762 | 108,189
|
6,218
|
1,463
|
99
|
212
|
3,046
|
19
|
16
|
305
|
195
|
| Ialoveni | 97,704 | 91,379
|
1,117
|
1,112
|
95
|
935
|
2,608
|
5
|
12
|
197
|
244
|
| Leova | 51,056 | 43,673
|
1,245
|
1,167
|
432
|
3,804
|
471
|
8
|
9
|
105
|
142
|
| Nisporeni | 64,924 | 60,774
|
223
|
339
|
17
|
28
|
2,329
|
1
|
4
|
1,147
|
62
|
| Ocnița | 56,510 | 32,491
|
17,351
|
2,764
|
79
|
60
|
104
|
14
|
43
|
3,417
|
187
|
| Orhei | 116,271 | 100,469
|
4,520
|
2,216
|
113
|
90
|
8,253
|
46
|
23
|
221
|
320
|
| Rezina | 48,105 | 44,721
|
1,691
|
1,093
|
34
|
40
|
375
|
30
|
5
|
13
|
103
|
| Rîșcani | 69,454 | 50,391
|
15,632
|
1,726
|
60
|
61
|
777
|
8
|
42
|
602
|
155
|
| Sîngerei | 87,153 | 74,139
|
8,456
|
3,029
|
47
|
43
|
1,162
|
10
|
48
|
56
|
163
|
| Soroca | 94,986 | 84,728
|
4,752
|
2,601
|
53
|
48
|
931
|
65
|
17
|
1,564
|
227
|
| Strășeni | 88,900 | 83,368
|
985
|
1,576
|
70
|
109
|
2,542
|
13
|
14
|
24
|
199
|
| Șoldănești | 42,227 | 40,354
|
1,055
|
376
|
9
|
14
|
299
|
2
|
-
|
74
|
44
|
| Ștefan Vodă | 70,594 | 65,318
|
2,182
|
1,918
|
64
|
145
|
562
|
1
|
4
|
219
|
181
|
| Taraclia | 43,154 | 5,980
|
2,646
|
2,139
|
3,587
|
28,293
|
29
|
2
|
9
|
218
|
251
|
| Telenești | 70,126 | 67,309
|
879
|
537
|
16
|
16
|
1,262
|
4
|
1
|
6
|
96
|
| Ungheni | 110,545 | 97,805
|
7,743
|
2,766
|
90
|
93
|
1,627
|
16
|
17
|
68
|
320
|
| Subtotal controlled by central government | 3,383,332 | 2,564,850
|
282,406
|
201,218
|
147,500
|
65,662
|
73,276
|
3,608
|
2,383
|
12,271
|
30,157
|
1There is an ongoing controversy over whether Moldovans are a subset of Romanians, or a distinct ethnic group. At the 2004 Moldovan Census, citizens could declare only one nationality. Consequently, one could not declare oneself both Moldovan and Romanian.
Transnistrian-controlled areas (2004 census)
| Population | Mold. | Russians | Ukrainians | Gagauzes | Bulg. | Gyps. | Jews | Poles | Belor. | Germ. | Armen. | others, non-decl. | |
|---|---|---|---|---|---|---|---|---|---|---|---|---|---|
| Tiraspol | 158,069 | 23,790
15.05% |
65,928
41.71% |
52,278
33.07% |
1,988
1.26% |
2,450
1.55% |
116
0.07% |
573
0.36% |
324
0.20% |
1,712
1.08% |
701
0.44% |
360
0.23% |
7,849
|
| Camenca District | 27,284 | 13,048
47.82% |
1,880
6.89% |
11,610
42.55% |
43
0.16% |
59
0.22% |
9
0.03% |
10
0.04% |
447
1.64% |
85
0.31% |
26
0.10% |
16
0.06% |
51
0.19% |
| Rîbnița District | 82,699 | 24,729
29.90% |
14,237
17.22% |
37,554
45.41% |
149
0.18% |
309
0.37% |
51
0.06% |
177
0.21% |
528
0.64% |
412
0.50% |
150
0.18% |
81
0.10% |
4,322
5.23% |
| Dubăsari District | 36,734 | 18,080
49.22% |
7,125
19.40% |
10,594
28.84% |
92
0.25% |
134
0.36% |
46
0.13% |
46
0.13% |
53
0.14% |
185
0.50% |
63
0.17% |
126
0.34% |
190
0.52% |
| Grigoriopol District | 48,000 | 31,118
64.83% |
7,332
15.28% |
8,333
17.36% |
123
0.26% |
240
0.50% |
13
0.03% |
26
0.05% |
100
0.21% |
187
0.39% |
327
0.68% |
62
0.13% |
139
0.29% |
| Slobozia District | 86,742 | 36,651
42.25% |
20,636
23.79% |
19,872
22.91% |
512
0.59% |
7,323
8.44% |
133
0.15% |
35
0.04% |
137
0.16% |
475
0.55% |
496
0.57% |
140
0.16 |
332
0.38% |
| Subtotal Transnistria | 439,528 | 147,416
33.54% |
117,138
26.65% |
140,241
31.91% |
2,907
0.66% |
10,515
2.39% |
368
0.08% |
867
0.20% |
1,589
0.36% |
3,056
0.70% |
1,763
0.40% |
785
0.18% |
12,883
2.93% |
| Bender (w/o Protegailovca) | 97,027 | 24,374
25.12% |
41,949
43.23% |
17,348
17.88% |
1,066
1.10% |
3,001
3.09% |
132
0.14% |
383
0.39% |
190
0.21% |
713
0.73% |
258
0.27% |
173
0.18% |
7,440
7.67% |
| Proteagailovca | 3,142 | 756–761
24.12% |
1,482
47.17% |
658
20.94% |
25
0.80% |
163
5.19% |
0–5
0.06% |
2
0.06% |
0–12
0.19% |
19
0.60% |
6
0.19% |
0–16
0.25% |
0–31
0.48% |
| Gîsca | 4,841 | 819–824
16.98% |
2,956
61.06% |
719
14.85% |
91
1.88% |
168
3.47% |
0–5
0.04% |
7
0.14% |
0–12
0.12% |
8
0.17% |
22
0.45% |
0–16
0.17% |
13–44
0.60% |
| Chițcani (incl. Merenești and Zahorna) | ~9,000 | ~3,100
~35% |
~4,800
~53% |
~900
~10% |
N/A
90% |
N/A
90% |
N/A
90% |
N/A
90% |
N/A
90% |
N/A
90% |
N/A
90% |
N/A
90% |
~200
~2% |
| Cremenciug | 1,094 | 465
42.50% |
353
32.27% |
203
18.56% |
7
0.64% |
11
1.01% |
2
0.18% |
-
- |
-
- |
15
1.37% |
22
2.01% |
6
0.55% |
10
0.91% |
| Roghi | 715[20] | ~700
~95% |
N/A
90% |
N/A
90% |
N/A
90% |
N/A
90% |
N/A
90% |
N/A
90% |
N/A
90% |
N/A
90% |
N/A
90% |
N/A
90% |
~15
~5% |
| Subotal other localities | 115,819 | 30,219
26.09% |
51,540
44.50% |
19,828
17.12% |
1,189
1.03% |
3,343
2.89% |
139
0.12% |
392
0.34% |
202
0.17% |
755
0.65% |
308
0.27% |
195
0.17% |
7,709
6.66% |
| Total Tiraspol-controlled areas | 555,347 | 177,635
31.99% |
168,678
30.37% |
160,069
28.82% |
4,096
0.74% |
13,858
2.50% |
507
0.09% |
1,259
0.23% |
1,791
0.32% |
3,811
0.69% |
2,071
0.37% |
980
0.18% |
20,592
3.71% |
Notes:
- The exact numbers in the above table are taken from the data published by the Transnistrian breakaway authorities after the 2004 Census in Transnistria, except the population of Roghi, which was taken from website of the Dubăsari District of Transnistria.
- The number of inhabitants of Slobozia District + that of the commune Chițcani was given by Transnistrian authorities as 95,742. Other sources indicate ~9,000 for Chițcani. In this table it is assumed there are 9,000 inhabitants in Chițcani, and 86,742 in Slobozia District. Should the exact data of the census for Chițcani be available, the entries in the lines of Slobozia District and of Chițcani should be corrected accordingly.
- Transnistrian authorities have published the ethnic composition for the combined population of the Dubăsari District and the village of Roghi in Molovata Nouă commune. Other sources indicate that the latter is almost entirely Moldovan. In this table it is assumed that of the 715 inhabitants of this village, 700 are Moldovan and 15 are others. Should the exact ethnicity data of the census for Roghi be available, the entries for ethnicities in the lines of Dubăsari District and of Roghi should be corrected accordingly.
- Percentages are calculated from the absolute numbers
Languages
Romanian is the official language of Moldova. However, many speakers use the term Moldovan to describe the language they speak, despite the fact that its literary standard is virtually identical to Romanian. Officially since 1990, it is written in the Latin Alphabet.
Native language
Currently, 2,184,065 people or 80.2% of those covered by the 2014 census on the right bank of the Dniester or Moldova (proper) have Moldovan/Romanian as native language, of which 1,544,726 (55.1%) declared Moldovan and 639.339 (22.8%) declared it Romanian. 263,523 people or 9.4% have Russian as native language, 107,252 or 3.8% – Ukrainian, 114,532 or 4.1% – Gagauz, 41,756 or 1.5% – Bulgarian, 12,187 or 0.5% – another language. Only 2,723,315 declared their native language out of the 2,804,801 covered by the 2014 census.[8]
First language in daily use (2014 census)
According to the 2014 census, 2,720,377 answered to the question on "language usually used for communication". 2,138,964 people or 78.63% of the inhabitants of Moldova (proper) have Moldovan/Romanian as first language, of which 1,486,570 (53%) declared it Moldovan and 652,394 (23.3%) declared it Romanian. 394,133 people or 14.1% have Russian as language of daily use, 73.802 or 2.6% – Ukrainian, 74.167 or 2.6% – Gagauz, 26,577 or 0.9% – Bulgarian, and 12,734 or 0.5% – another language.[8]
First language in daily use (2004 census)
| Ethnic group \ First language | Moldovan | Romanian | Russian | Ukrainian | Gagauzian | Bulgarian | other language | did non declare | Total |
|---|---|---|---|---|---|---|---|---|---|
| Moldovans | 1,949,318 | 475,126 | 128,372 | 9,170 | 799 | 1,113 | 951 | - | 2,564,849 |
| Romanians | 1,597 | 69,936 | 1,537 | 81 | 5 | 4 | 116 | - | 73,276 |
| Russians | 8,852 | 2,805 | 187,526 | 1,224 | 329 | 344 | 138 | – | 201,218 |
| Ukrainians | 17,491 | 4,158 | 141,206 | 118,699 | 427 | 294 | 131 | – | 282,406 |
| Gagauzians | 2,756 | 609 | 40,445 | 413 | 102,395 | 821 | 61 | – | 147,500 |
| Bulgarians | 4,652 | 1,046 | 23,259 | 188 | 673 | 35,808 | 36 | – | 65,662 |
| other ethnic groups | 3,828 | 1,133 | 18,610 | 339 | 262 | 181 | 9,856 | 192 | 34,401 |
| did non declare | 46 | 1 | 35 | – | – | – | 29 | 13,909 | 14,020 |
| Total by language of first use | 1,988,540 58.77% |
554,814 16.4% |
540,990 15.99% |
130,114 3.85% |
104,890 3.10% |
38,565 1.14% |
11,318 0.34% |
14,101 0.41% |
3,383,332 100% |
Usage of own language by the ethnic groups of Moldova (2004 census)
| ethnic group | own language | Moldovan and Romanian | Russian |
|---|---|---|---|
| Moldovans | 94.52% | – | 5% |
| Romanians | 97.62% | – | 2.1% |
| Russians | 93.20% | 5.79% | – |
| Ukrainians | 42.03% | 7.66% | 50.00% |
| Gagauzians | 69.42% | 2.28% | 27.42% |
| Bulgarians | 54.53% | 8.68% | 35.42% |
| others | up to 28.65% | 14.42% | 54.10% |
Urban areas
| ethnic group | own language | Moldovan and Romanian | Russian |
|---|---|---|---|
| Moldovans | 86.71% | – | 13.07% |
| Romanians | 96.88% | – | 2.85% |
| Russians | 95.85% | 3.82% | – |
| Ukrainians | 13.06% | 6.56% | 80.19% |
| Gagauzians | 40.10% | 2.19% | 57.23% |
| Bulgarians | 36.81% | 7.93% | 54.45% |
| others | up to 28.11% | 8.35% | 62.05% |
Rural areas
| ethnic group | own language | Moldovan and Romanian | Russian |
|---|---|---|---|
| Moldovans | 98.24% | – | 1.17% |
| Romanians | 98.76% | – | 0.94% |
| Russians | 80.52% | 15.25% | – |
| Ukrainians | 72.99% | 8.85% | 17.74% |
| Gagauzians | 86.16% | 2.33% | 10.40% |
| Bulgarians | 68.95% | 9.29% | 19.95% |
| others | up to 30.34% | 33.39% | 29.25% |
Soviet era data
In the Soviet census of 1989 members of most of the ethnic groups in Moldavian SSR claimed the language of their ethnicity as their mother tongue: Moldovans (95%), Ukrainians (62%), Russians (99%), Gagauz (91%), Bulgarians (79%), and Gipsies (82%). The exceptions were Jews (26% citing Yiddish), Belarusians (43%), Germans (31%), and Poles (10%).
In the Soviet census of 1989, 62% of the total population claimed Moldovan as their native language. Only 4% of the entire population claimed Moldovan as a second language.
In 1979, Russian was claimed as a native language by a large proportion of Jews (66%) and Belarusians (62%), and by a significant proportion of Ukrainians (30%). Proportions of other ethnicities naming Russian as a native language ranged from 17% of Bulgarians to 3% of Moldovans (Russian was more spoken by urban Moldovans than by rural Moldovans). Russian was claimed as a second language by a sizeable proportion of all ethnicities: Moldovans (46%), Ukrainians (43%), Gagauz (68%), Jews (30%), Bulgarians (67%), Belarusians (34%), Germans (53%), Roma (36%), and Poles (24%).
Religion (2004 census)
According to the 2004 census, the population of Moldova has the following religious composition:
| Religion | Adherents | % of total |
|---|---|---|
| Eastern Orthodox Christians | 3,158,015 | 93.3% |
|
Newer Protestant faiths
|
|
1.79% |
|
Traditional Protestant
|
|
0.19% |
| Old-Rite Christians b | 5,094 | 0.15% |
| Roman Catholics | 4,645 | 0.14% |
| Other religions | 29,813 | 0.88% |
| Non-religious | 33,207 | 0.98% |
| Atheists | 12,724 | 0.38% |
Notes: 75,727 (2.24% of population) did not answer that question.
a Known as Creștini după Evanghelie, Pentecostal group.
b Traditionally Orthodox Lipovans.
History
In 1940–1941, and 1944–1991, the Soviet government strictly limited the activities of the Orthodox Church (and all religions) and at times sought to exploit it, with the ultimate goal of abolishing it and all religious activity altogether. Most Orthodox churches and monasteries in Moldova were demolished or converted to other uses, such as administrative buildings or warehouses, and clergy were sometimes punished for leading services. Still, many believers continued to practice their faith.
People in the independent Moldova have much greater religious freedom than they did in Soviet times. Legislation passed in 1992 guarantees religious freedom, but requires all religious groups to be officially recognized by the government.
Orthodox Christians
In 1991, Moldova had 853 Orthodox churches and eleven Orthodox monasteries (four for monks and seven for nuns). In 1992 construction or restoration of 221 churches was underway, but clergy remained in short supply. As of 2004, Christian Orthodox constitute the vast majority of the population in all districts of Moldova.
In the interwar period, the vast majority of ethnic Moldovans belonged to the Romanian Orthodox Church (Bucharest Patriarchate), but today both Romanian and Russian Orthodox Church (Moscow Patriarchate) have jurisdiction in Moldova, with the latter having more parishes. According to the local needs, liturgy is performed in Romanian, Russian, and Turkic (Gagauz). After the revival of religious activity in the last 20 years, a minority of the clergy and the faithful wanted to return to the Bucharest Patriarchate (Metropolis of Bessarabia). Because higher-level church authorities were unable to resolve the matter, Moldova now has two episcopates, one for each patriarchate. After the Soviet occupation in 1940, the Metropolis was downgraded to a Bishopric. In late 1992, the Patriarch of Moscow and All Russia issued a decree upgrading its eparchy of Chișinău and Moldova to a Metropolis.
Greek Catholics
Moldova also has a Greek Catholic minority, mainly among ethnic Ukrainians, although the Soviet government declared the Greek Catholic Churches illegal in 1946 and forcibly united them with the Russian Orthodox Church. However, the Greek Catholic Churches had survived underground until the dissolution of the Soviet Union.
Roman Catholics
Half of Moldova's Roman Catholics are in Chișinău, and 1/5 in Bălți.
Old Believers
In addition, the Old Russian Orthodox Church (Old Believers) had fourteen churches and one monastery in Moldova in 1991.
Half of Moldova's Old Believers are in Florești district, and 1/5 in Sîngerei district.
Judaism
Despite the Soviet government's suppression and harassment, Moldova's practicing Jews managed to retain their religious identity. About a dozen Jewish newspapers were started in the early 1990s, and religious leaders opened a synagogue in Chișinău; there were six Jewish communities of worship throughout the country. In addition, Moldova's government created the Department of Jewish Studies at Chișinău State University, mandated the opening of a Jewish high school in Chișinău, and introduced classes in Judaism in high schools in several cities. The government also provides financial support to the Society for Jewish Culture.
Protestants
There are around 65,000 Protestants of all sects in Moldova today. There are more than 1,000 Baptists in the cities of Chișinău and Bălți, in Cahul, Fălești, Hîncești, Sîngerei, Ștefan Vodă, and Ungheni districts, and in Găgăuzia. There are more than 1,000 Seventh-day Adventists in Cahul, Hîncești and Sîngerei districts, and in Găgăuzia, there are more than 1,000 Pentecostals in Chișinău and in Briceni district. There are more than 1,000 members of Brethren assemblies only in Chișinău. There are more than 1,000 Evangelical Synod-Presbyterians only in Chișinău.
Others
Other religious denominations in Moldova include:
- Armenian Apostolic Church
- Molokans (a Russian Orthodox sect).
Urban and rural population

| An | Urban population | % | Rural population | % |
|---|---|---|---|---|
| 2000 | 1.486.410 | 40,89 | 2.148.702 | 59,11 |
| 2001 | 40,94 | 59,06 | ||
| 2002 | 41,02 | 58,98 | ||
| 2003 | 40,97 | 59,03 | ||
| 2004 | 41,00 | 59,00 | ||
| 2005 | 40,94 | 59,06 | ||
| 2006 | 41,27 | 58,73 | ||
| 2007 | 41,32 | 58,68 | ||
| 2008 | 41,37 | 58,63 | ||
| 2009 | 41,44 | 58,56 | ||
| 2010 | 41,62 | 58,38 | ||
| 2011 | 41,74 | 58,26 | ||
| 2012 | 41,92 | 58,08 | ||
| 2013 | 42,25 | 57,75 | ||
| 2014 | 42,40 | 57,60 | ||
| 2015 | 42,53 | 57,47 | ||
| 2016 | 42,71 | 57,47 |
Secondary demographic indices
Average age
| The year | 1992 | 1995 | growth | 2000 | growth | 2005 | growth | 2010 | growth | 2015 | growth |
|---|---|---|---|---|---|---|---|---|---|---|---|
Years | 32,0 | 32,4 | +0.4 | 33,4 | +1.0 | 34,9 | +1.5 | 36,2 | +1.3 | 37,5 | +1.3 |
Life expectancy at birth
Since 2000, there has been a continuous increase in life expectancy, except for 2005, a year in which there was a high level of general and infant mortality. In 2013, this indicator recorded the maximum value of the given period - 71.85 years, including men - 68.1 and women - 75.5 years.[25] The significant increase in life expectancy was influenced by the decrease in the overall mortality rate to 10.7 deaths per 1000 inhabitants, and the infant death rate, which constituted 9.4 deaths under one year per 1,000 live births.
| The year | 1960 | 1970 | 1980 | 1990 | 1995 | 2000 | 2005 | 2010 | 2015 | 2016 |
|---|---|---|---|---|---|---|---|---|---|---|
| Ladies: | ||||||||||
| Average time: | ||||||||||
| Men: |
Population by sex
| Year | 1970 | 1980 | 1990 | 2000 | 2010 | 2015 |
|---|---|---|---|---|---|---|
| Men | 46,76% | 47,25% | 47,64% | 47,87% | 48,08% | 48,10% |
| Ladies | 53,24% | 52,75% | 52,36% | 52,13% | 51,92% | 51,90% |
| Men la 1.000 ladies | 878 | 896 | 910 | 918 | 926 | 927 |
Infant mortality
Children under 1 year old in 1,000 newborns:[28]
| The Year | 1980 | 1985 | 1990 | 1995 | 2000 | 2005 | 2010 | 2015 | 2017 |
|---|---|---|---|---|---|---|---|---|---|
| Children |
Marriage
| Year | Number marriages |
per 1000 inhabitants | Number divorce |
per 1000 inhabitants |
|---|---|---|---|---|
| 1980 | 46.083 | 11,5 | 11.273 | 2,8 |
| 1985 | 40.901 | 11.176 | ||
| 1990 | 40.809 | 13.135 | ||
| 1995 | 32.775 | 14.617 | ||
| 2000 | 21.684 | 9.707 | ||
| 2005 | 27.187 | 14.521 | ||
| 2010 | 26.483 | 11.504 | ||
| 2011 | 25.900 | 11.120 | ||
| 2012 | 24.262 | 10.637 | ||
| 2013 | 24.449 | 10.775 | ||
| 2014 | 25.624 | 11.130 | ||
| 2015 | 24.709 | 11.199 | ||
| 2016 | 21.992 | 10.605 |
- References:[29]
References
Inline:
- http://statistica.gov.md/newsview.php?l=ro&id=6416&idc=168
- 2014 Moldovan census
- Key results of the 2014 Population and Housing Census
- "В Приднестровье проживают 475 007 человек". Archived from the original on 7 November 2017. Retrieved 4 November 2017.
- (in English) The World Factbook, CIA (2008)
- (in English) UN (2001/2002)
- (in English) UN (2000)
- Rezultatele Recensămîntului Populației și al Locuințelor 2014
- В ПРИДНЕСТРОВЬЕ ПРОЖИВАЕТ БОЛЕЕ 475 ТЫС. ЧЕЛОВЕК
- "Statistical Yearbooks of the Russian Empire". Archived from the original on 16 December 2014. Retrieved 24 December 2014.
- http://unstats.un.org/unsd/demographic/products/dyb/dyb2.htm#2001 United nations. Demographic Yearbooks
- Statistica Moldovei
- "BULETIN STATISTIC 2019/IV" (PDF).
- (in Romanian) Biroul Național de Statistică prezintă numărul revizuit al populației Republicii Moldova și datele despre migrația internațională | Infografice cu privire la numărul revizuit al populației și indicatori demografici
- (in Romanian) Numărul populaţiei cu reședința obișnuită în Republica Moldova pe sexe şi grupe de vârstă la începutul anului 2019
- "Archived copy". Archived from the original on 14 January 2014. Retrieved 21 April 2014.CS1 maint: archived copy as title (link)
- http://www.dhsprogram.com/
- Statistică, Biroul Naţional de. "// Recensămîntul populației și al locuințelor 2014". Statistica.md. Retrieved 2 August 2017.
- Partidul Liberal despre datele Recensamantului din 2014, prezentate abia astazi, in 2017: "Sunt viciate si nu reflecta realitatea din Republica Moldova"
- Webpage of Dubăsari District of Transnistria
- "Popula?ia stabila pe sexe ?i medii, la оnceputul anului, 1970-2013". Archived from the original on 12 March 2016. Retrieved 25 August 2019.
- Structura popula?iei stabile a Republicii Moldova pe sexe ?i vоrste la 1 ianuarie 2014 statistica.md Accesat la 20.05.2014
- BNS: Vоrsta medie a popula?iei dupa ani, medii ?i sexe
- Durata medie a vietii оn Republica Moldova оn anul 2013
- BNS: Speran?a de via?a la na?tere dupa ani, medii ?i sexe
- Populația stabilă, la începutul anului după Ani, Medii și Sexe, 1970 - 2013
- "Mortalitatea infantilă pe sexe și medii, 1980-2012". Archived from the original on 12 March 2016. Retrieved 25 August 2019.
- Populația și procesele demografice. Căsătorii și Divorțuri statistica.md
General:
![]()
External links
- Arianna Montanari, Rumanian national identity in the Republic of Moldova
- Disaster by Depopulation, a Red Cross report about impact of demographic changes on family structure and child care
Moldova articles | |||||
|---|---|---|---|---|---|
| History |
|  | |||
| Geography |
| ||||
| Politics | |||||
| Economy | |||||
| Society |
| ||||
| |||||