Demographics of Cuba
The demographic characteristics of Cuba are known through census which have been conducted and analyzed by different bureaus since 1774. The National Office of Statistics of Cuba (ONE) since 1953. The most recent census was conducted in September 2012. The population of Cuba at the 2012 census was 11.2 million. The population density is 100.7 inhabitants per square kilometer, and the overall life expectancy in Cuba is 78.0 years. The population has always increased from one census to the next, with the exception of the 2012 census, when the count decreased by 10,000. Since 1740, Cuba's birth rate has surpassed its death rate; the natural growth rate of the country is positive. Cuba is in the fourth stage of demographic transition. In terms of age structure, the population is dominated (71.1%) by the 15- to 64-year-old segment. The median age of the population is 39.5, and the gender ratio of the total population is 0.99 males per female.
| Demographics of Cuba | |
|---|---|
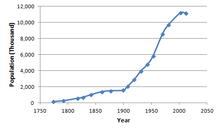 Scatter plot of the population of Cuba (in thousands), 1774–2012 | |
| Population | 11,167,325 (2012) 11,210,064 (2013) 11,238,317 (2014) 11,239,004 (2015) 11,239,224 (2016) 11,221,060 (2017) 11,209,628 (2018) 11,193,470 (2019) |
| Density | 263.9 per squ. mile/ 101.9 per squ. km (2019) |
| Growth rate | -0.1% (2002–12) |
| Birth rate | 9.92 births/1,000 inhabitants (2013 est.) |
| Death rate | 7.58 deaths/1,000 inhabitants(2013 est.) |
| Life expectancy | 78.0 years (2013 est.) |
| • male | 75.8 years (2013 est.) |
| • female | 80.4 years (2013 est.) |
| Fertility rate | 1.45 children/women (2013 est.) |
| Infant mortality rate | 4.76 deaths/1000 live births (2013 est.) |
| Age structure | |
| 0–14 years | 16.6% (2013 est.) |
| 15–64 years | 71.1% (2013 est.) |
| 65 and over | 12.3% (2013 est.) |
| Sex ratio | |
| Total | 0.99 (2013 est.) |
| At birth | 1.06 (2013 est.) |
| Under 15 | 1.06 (2013 est.) |
| 15–64 years | 1.01 (2013 est.) |
| 65 and over | 0.82 (2013 est.) |
| Nationality | |
| Nationality | Cuban |
| Language | |
| Official | Spanish |
Population
| Historical population | ||
|---|---|---|
| Year | Pop. | ±% p.a. |
| 1774 | 171,620 | — |
| 1792 | 272,300 | +2.60% |
| 1817 | 572,363 | +3.02% |
| 1827 | 704,487 | +2.10% |
| 1841 | 1,007,624 | +2.59% |
| 1861 | 1,396,530 | +1.65% |
| 1877 | 1,509,291 | +0.49% |
| 1899 | 1,572,797 | +0.19% |
| 1907 | 2,048,980 | +3.36% |
| 1919 | 2,889,004 | +2.90% |
| 1931 | 3,962,344 | +2.67% |
| 1943 | 4,778,583 | +1.57% |
| 1953 | 5,829,029 | +2.01% |
| 1970 | 8,569,121 | +2.29% |
| 1981 | 9,723,605 | +1.16% |
| 2002 | 11,177,743 | +0.67% |
| 2012 | 11,167,325 | −0.01% |
| Source: [1] | ||
According to the 2002 census, Cuba's population was 11,177,743, whereas the 2012 census numbered the population at 11,167,325.[2] The drop between the 2002 and 2012 censuses was the first drop in Cuba's population since Cuba's war of independence. This drop was due to low fertility and emigration, as during this time (fiscal years 2003-2012), 332,028 Cubans received legal permanent residence in the United States.[3] In the last few years before the end of the wet feet, dry feet policy on January 12, 2017, the number of Cubans moving to the United States significantly outnumbered the natural increase during those years.
Population by region (2015)
| Population and Area by region | |||||
|---|---|---|---|---|---|
| Province | Area (km²) | Area (%) | Population | Population (%) | Density |
| Cuba Total | 109,886.19 | 100 | 11 232 305 | 100 | 101.72 |
| Pinar del Río | 10,904.03 | 9.92 | 726,574 | 6.50 | 66.63 |
| La Habana | 5,791.59 | 5.22 | 711,066 | 6.36 | 124.06 |
| Ciudad de la Habana | 721.01 | 0.66 | 2,201,610 | 19.70 | 3053.49 |
| Matanzas | 11,802.72 | 10.74 | 670,427 | 6.00 | 56.80 |
| Villa Clara | 8,412.41 | 7.06 | 817,395 | 7.31 | 97.17 |
| Cienfuegos | 4,180.02 | 3.80 | 395,183 | 3.54 | 94.54 |
| Sancti Spíritus | 6,736.51 | 6.13 | 460,328 | 4.12 | 68.33 |
| Ciego de Ávila | 6,783.13 | 6.17 | 411,766 | 3.68 | 60.70 |
| Camagüey | 15,615.02 | 14.21 | 784,178 | 7.02 | 50.22 |
| Las Tunas | 6,587.75 | 6.00 | 525,485 | 4.70 | 79.77 |
| Holguín | 9,292.83 | 8.46 | 1,021,321 | 9.14 | 109.90 |
| Granma | 8,375.49 | 7.62 | 822,452 | 7.36 | 98,20 |
| Santiago de Cuba | 6,156.44 | 5.60 | 1,036,281 | 9.27 | 168.32 |
| Guantánamo | 6,167.97 | 5.61 | 507,118 | 4.54 | 82.22 |
| Isla de la Juventud | 2,419.27 | 2.20 | 86,559 | 0.77 | 35.78 |
Largest cities
See Also List of cities in Cuba
Nº, City, Population, Province
- 1 Havana, 2,131,480, Havana
- 2 Santiago de Cuba, 433,581, Santiago de Cuba
- 3 Camagüey, 308,902, Camagüey
- 4 Holguín, 297,433, Holguín
- 5 Santa Clara, 216,855, Villa Clara
- 6 Guantánamo, 216,003, Guantánamo
- 7 Las Tunas, 173,552, Las Tunas
- 8 Bayamo, 159,966, Granma
- 9 Cienfuegos, 151,838, Cienfuegos
- 10 Pinar del Río, 145,193, Pinar del Río
- 11 Matanzas, 143,363, Matanzas
- 12 Ciego de Ávila, 120,446, Ciego de Ávila
Vital statistics
| Average population [5][6] | Live births | Deaths | Natural change | Crude birth rate (per 1000) | Crude death rate (per 1000) | Natural change (per 1000) | Total fertility rate | Infant mortality rate | |
|---|---|---|---|---|---|---|---|---|---|
| 1950 | 5,920,000 | 163,122 | 39,190 | 123,932 | 27.9 | 6.7 | 21.2 | — | — |
| 1951 | 6,051,000 | 142,693 | 40,939 | 101,754 | 23.9 | 6.9 | 17.0 | — | — |
| 1952 | 6,180,000 | 143,750 | 37,221 | 106,529 | 23.6 | 6.1 | 17.5 | — | — |
| 1953 | 6,305,000 | 150,000 | 37,161 | 112,839 | 24.2 | 6.0 | 18.2 | — | — |
| 1954 | 6,424,000 | 160,000 | 35,712 | 124,288 | 25.4 | 5.7 | 19.7 | — | — |
| 1955 | 6,539,000 | 170,000 | 37,264 | 132,736 | 26.5 | 5.8 | 20.7 | — | — |
| 1956 | 6,652,000 | 180,000 | 36,321 | 143,679 | 27.6 | 5.6 | 22.0 | — | — |
| 1957 | 6,765,000 | 188,100 | 40,572 | 147,528 | 28.4 | 6.1 | 22.3 | — | — |
| 1958 | 6,881,000 | 200,000 | 42,508 | 157,492 | 29.7 | 6.3 | 23.4 | — | — |
| 1959 | 7,005,000 | 204,300 | 44,043 | 160,257 | 29.8 | 6.4 | 23.4 | — | — |
| 1960 | 7,141,000 | 214,900 | 43,164 | 171,736 | 30.8 | 6.2 | 24.6 | — | — |
| 1961 | 7,290,000 | 234,600 | 45,945 | 188,655 | 32.9 | 6.4 | 26.5 | — | — |
| 1962 | 7,450,000 | 260,900 | 51,580 | 209,320 | 35.9 | 7.1 | 28.8 | — | — |
| 1963 | 7,618,000 | 256,900 | 49,624 | 207,276 | 34.6 | 6.7 | 27.9 | — | — |
| 1964 | 7,787,000 | 264,300 | 47,922 | 216,378 | 34.8 | 6.3 | 28.5 | — | — |
| 1965 | 7,952,000 | 263,975 | 50,027 | 213,948 | 34.0 | 6.5 | 27.6 | — | — |
| 1966 | 8,110,000 | 255,413 | 50,846 | 204,567 | 32.3 | 6.4 | 25.9 | — | — |
| 1967 | 8,264,000 | 255,311 | 51,030 | 204,281 | 31.7 | 6.3 | 25.3 | — | — |
| 1968 | 8,413,000 | 246,807 | 53,920 | 192,887 | 30.1 | 6.6 | 23.5 | — | — |
| 1969 | 8,563,000 | 238,095 | 55,654 | 182,441 | 28.5 | 6.7 | 21.8 | — | — |
| 1970 | 8,715,000 | 237,019 | 53,761 | 183,258 | 27.8 | 6.3 | 21.5 | — | — |
| 1971 | 8,870,000 | 256,014 | 54,109 | 201,905 | 29.5 | 6.2 | 23.2 | — | — |
| 1972 | 9,025,000 | 247,997 | 48,534 | 199,463 | 28.0 | 5.5 | 22.5 | — | — |
| 1973 | 9,176,000 | 226,005 | 51,238 | 174,767 | 25.1 | 5.7 | 19.4 | — | — |
| 1974 | 9,315,000 | 203,066 | 51,724 | 151,342 | 22.1 | 5.6 | 16.5 | — | — |
| 1975 | 9,438,000 | 192,941 | 50,961 | 142,958 | 20.7 | 5.5 | 15.4 | — | — |
| 1976 | 9,544,000 | 187,555 | 53,080 | 134,475 | 19.9 | 5.6 | 14.3 | — | — |
| 1977 | 9,634,000 | 168,960 | 56,084 | 112,876 | 17.8 | 5.9 | 11.9 | — | — |
| 1978 | 9,710,000 | 148,249 | 55,100 | 93,149 | 15.5 | 5.8 | 9.7 | — | — |
| 1979 | 9,776,000 | 143,551 | 54,838 | 88,713 | 14.9 | 5.7 | 9.2 | — | — |
| 1980 | 9,835,000 | 136,900 | 55,707 | 81,193 | 14.1 | 5.7 | 8.4 | — | — |
| 1981 | 9,886,000 | 136,211 | 57,941 | 78,397 | 13.9 | 5.9 | 8.0 | — | — |
| 1982 | 9,931,000 | 159,759 | 56,224 | 103,274 | 16.2 | 5.7 | 10.5 | — | — |
| 1983 | 9,975,000 | 165,284 | 58,348 | 106,938 | 16.6 | 5.9 | 10.8 | — | — |
| 1984 | 10,029,000 | 166,281 | 59,801 | 106,386 | 16.6 | 6.0 | 10.6 | — | — |
| 1985 | 10,097,000 | 182,067 | 64,415 | 117,637 | 18.0 | 6.4 | 11.6 | — | — |
| 1986 | 10,184,000 | 166,049 | 63,145 | 102,904 | 16.3 | 6.2 | 10.1 | — | — |
| 1987 | 10,286,000 | 179,477 | 65,079 | 114,398 | 17.4 | 6.3 | 11.1 | — | — |
| 1988 | 10,396,000 | 187,911 | 67,944 | 119,967 | 18.0 | 6.5 | 11.5 | — | — |
| 1989 | 10,504,000 | 184,891 | 67,356 | 117,535 | 17.6 | 6.4 | 11.2 | — | — |
| 1990 | 10,662,000 | 186,658 | 72,144 | 114,514 | 17.6 | 6.8 | 10.8 | — | — |
| 1991 | 10,756,000 | 173,896 | 71,709 | 102,187 | 16.3 | 6.7 | 9.6 | — | — |
| 1992 | 10,829,000 | 157,349 | 75,457 | 81,892 | 14.6 | 7.0 | 7.6 | — | — |
| 1993 | 10,895,000 | 152,226 | 78,531 | 73,695 | 14.1 | 7.3 | 6.8 | — | — |
| 1994 | 10,912,000 | 147,265 | 78,648 | 68,617 | 13.5 | 7.2 | 6.3 | — | — |
| 1995 | 10,947,000 | 147,170 | 77,937 | 69,233 | 13.5 | 7.1 | 6.3 | — | — |
| 1996 | 10,983,000 | 148,276 | 79,662 | 68,614 | 13.5 | 7.3 | 6.2 | — | — |
| 1997 | 11,033,000 | 152,681 | 77,316 | 75,365 | 13.8 | 7.0 | 6.8 | — | — |
| 1998 | 11,076,000 | 151,080 | 77,565 | 73,515 | 13.7 | 7.0 | 6.6 | — | — |
| 1999 | 11,113,000 | 150,871 | 79,499 | 71,372 | 13.6 | 7.2 | 6.4 | — | — |
| 2000 | 11,146,000 | 143,528 | 76,463 | 67,065 | 12.9 | 6.9 | 6.0 | — | — |
| 2001 | 11,168,000 | 138,718 | 79,395 | 59,323 | 12.4 | 7.1 | 5.3 | — | — |
| 2002 | 11,200,000 | 141,276 | 73,882 | 67,394 | 12.6 | 6.6 | 6.0 | — | — |
| 2003 | 11,215,000 | 136,795 | 78,434 | 58,361 | 12.2 | 7.0 | 5.2 | — | — |
| 2004 | 11,217,000 | 127,192 | 81,110 | 46,082 | 11.3 | 7.2 | 4.1 | — | — |
| 2005 | 11,218,000 | 120,716 | 84,824 | 35,892 | 10.7 | 7.5 | 3.2 | — | |
| 2006 | 11,202,000 | 111,323 | 80,831 | 30,492 | 9.9 | 7.2 | 2.7 | — | |
| 2007 | 11,188,000 | 112,472 | 81,927 | 30,545 | 10.0 | 7.2 | 2.7 | — | |
| 2008 | 11,173,000 | 122,569 | 86,423 | 36,146 | 10.9 | 7.7 | 3.2 | 1.60 | 4.7 |
| 2009 | 11,174,000 | 130,036 | 86,943 | 43,093 | 11.6 | 7.7 | 3.8 | 1.70 | 4.8 |
| 2010 | 11,167,000 | 127,746 | 91,065 | 36,681 | 11.4 | 8.1 | 3.3 | 1.69 | 4.5 |
| 2011 | 11,175,000 | 133,067 | 87,044 | 46,023 | 11.8 | 7.7 | 4.1 | 1.77 | 4.9 |
| 2012 | 11,173,000 | 125,674 | 89,372 | 36,302 | 11.3 | 8.0 | 3.3 | 1.69 | |
| 2013 | 11,210,000 | 125,880 | 92,273 | 33,607 | 11.2 | 8.3 | 2.9 | 1.71 | 4.2 |
| 2014 | 11,238,000 | 122,643 | 96,330 | 26,313 | 10.9 | 8.6 | 2.3 | 1.68 | 4.2 |
| 2015 | 11,239,000 | 125,064 | 99,693 | 25,371 | 11.1 | 8.9 | 2.2 | 1.72 | 4.3 |
| 2016 | 11,239,000 | 116,872 | 99,399 | 17,473 | 10.4 | 8.8 | 1.6 | 1.63 | 4.3 |
| 2017 | 11,221,000 | 114,971 | 106,941 | 8,030 | 10.2 | 9.5 | 0.7 | 1.61 | 4.0 |
| 2018 | 11,209,000 | 116,333 | 106,201 | 10,132 | 10.4 | 9.5 | 0.9 | 1.65 | 4.0 |
| 2019 | 11,193,000 | 109,716 | 109,080 | 636 | 9.8 | 9.7 | 0.1 | 1.57 | 5.0 |
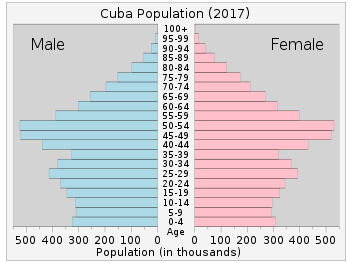
Structure of the population (2012)
| Age Group | Male | Female | Total | % |
|---|---|---|---|---|
| Total | 5 570 825 | 5 596 500 | 11 167 325 | 100 |
| 0-4 | 321 422 | 303 770 | 625 192 | 5,60 |
| 5-9 | 305 672 | 288 427 | 594 099 | 5,32 |
| 10-14 | 362 252 | 341 019 | 703 271 | 6,30 |
| 15-19 | 363 986 | 340 140 | 704 126 | 6,31 |
| 20-24 | 426 956 | 399 702 | 826 658 | 7,40 |
| 25-29 | 388 961 | 366 768 | 755 729 | 6,77 |
| 30-34 | 318 339 | 305 141 | 623 480 | 5,58 |
| 35-39 | 421 389 | 417 242 | 838 631 | 7,51 |
| 40-44 | 504 738 | 510 284 | 1 015 022 | 9,09 |
| 45-49 | 511 501 | 529 712 | 1 041 213 | 9,32 |
| 50-54 | 378 808 | 395 691 | 774 499 | 6,94 |
| 55-59 | 302 073 | 321 940 | 624 013 | 5,59 |
| 60-64 | 274 261 | 290 374 | 564 635 | 5,06 |
| 65-69 | 230 423 | 250 494 | 480 917 | 4,31 |
| 70-74 | 182 623 | 198 274 | 380 897 | 3,41 |
| 75-79 | 123 987 | 140 936 | 264 923 | 2,37 |
| 80-84 | 82 067 | 97 603 | 179 670 | 1,61 |
| 85+ | 71 367 | 98 983 | 170 350 | 1,53 |
| Age group | Male | Female | Total | Percent |
|---|---|---|---|---|
| 0-14 | 989 346 | 933 216 | 1 922 562 | 17,22 |
| 15-64 | 3 891 012 | 3 876 994 | 7 768 006 | 69,56 |
| 65+ | 690 467 | 786 290 | 1 476 757 | 13,22 |
Structure of the population (01.07.2013) (Estimates):[8]
| Age Group | Male | Female | Total | % |
|---|---|---|---|---|
| Total | 5 580 810 | 5 610 798 | 11 191 608 | 100 |
| 0-4 | 321 478 | 303 526 | 625 004 | 5,58 |
| 5-9 | 301 959 | 284 488 | 586 447 | 5,24 |
| 10-14 | 359 531 | 338 675 | 698 206 | 6,24 |
| 15-19 | 363 489 | 340 163 | 703 652 | 6,29 |
| 20-24 | 422 593 | 395 300 | 817 893 | 7,31 |
| 25-29 | 395 116 | 372 190 | 767 305 | 6,86 |
| 30-34 | 323 405 | 309 400 | 632 805 | 5,65 |
| 35-39 | 404 654 | 400 360 | 805 014 | 7,19 |
| 40-44 | 504 560 | 508 992 | 1 013 551 | 9,06 |
| 45-49 | 510 718 | 528 487 | 1 039 204 | 9,29 |
| 50-54 | 397 073 | 414 802 | 811 875 | 7,25 |
| 55-59 | 300 439 | 320 991 | 621 430 | 5,55 |
| 60-64 | 278 891 | 296 070 | 574 961 | 5,14 |
| 65-69 | 233 904 | 255 751 | 489 654 | 4,38 |
| 70-74 | 185 892 | 202 686 | 388 578 | 3,47 |
| 75-79 | 125 408 | 143 251 | 268 659 | 2,40 |
| 80-84 | 81 997 | 98 823 | 180 819 | 1,62 |
| 85+ | 69 707 | 96 849 | 166 556 | 1,49 |
| Age group | Male | Female | Total | Percent |
|---|---|---|---|---|
| 0-14 | 982 968 | 926 689 | 1 909 657 | 17,06 |
| 15-64 | 3 900 934 | 3 886 749 | 7 787 683 | 69,59 |
| 65+ | 696 908 | 797 360 | 1 494 268 | 13,35 |
Racial groups
| Year | White | Mulatto and Mestizo | Black |
|---|---|---|---|
| 2002[7] | 65.06% | 24.86% | 10.08% |
| 2012[7] | 64.12% | 26.62% | 9.26% |
| Age group | Cuba 100% (percent of the population) | White 64,12% (percent in the race/percent in the age group) | Black 9,26% (percent in the race/percent in the age group) | Mulatto/Mestizo 26,62% (percent in the race/percent in the age group) |
|---|---|---|---|---|
| Population | 11 167 325 | 7 160 399 | 1 034 044 | 2 972 882 |
| 0 | 131 419 (1,18%) | 91 432 (1,28%/69,57%) | 5 368 (0,52%/4,08%) | 34 619 (1,16%/26,34%) |
| 0-4 | 625 192 (5,60%) | 412 604 (5,76%/66,00%) | 31 828 (3,08%/5,09%) | 180 760 (6,08%/28,91%) |
| 5-9 | 594 099 (5,32%) | 372 304 (5,20%/62,67%) | 38 481 (3,72%/6,48%) | 183 314 (6,17%/30,86%) |
| 10-14 | 703 271 (6,30%) | 439 406 (6,14%/62,48%) | 52 121 (5,04%/7,41%) | 211 744 (7,12%/30,11%) |
| 15-19 | 704 126 (6,31%) | 434 944 (6,07%/61,77%) | 57 638 (5,57%/8,19%) | 211 544 (7,12%/30,04%) |
| 20-24 | 826 658 (7,40%) | 511 488 (7,14%/61,87%) | 71 570 (6,92%/8,66%) | 243 600 (8,19%/29,47%) |
| 25-29 | 755 729 (6,77%) | 463 004 (6,47%/61,27%) | 69 282 (6,70%/9,17%) | 223 443 (7,52%/29,57%) |
| 30-34 | 623 480 (5,58%) | 380 742 (5,32%/61,07%) | 61 368 (5,93%/9,84%) | 181 370 (6,10%/29,09%) |
| 35-39 | 838 631 (7,51%) | 520 668 (7,27%/62,09%) | 82 640 (7,99%/9,85%) | 235 323 (7,92%/28,06%) |
| 40-44 | 1 015 022 (9,09%) | 635 473 (8,87%/62,61%) | 103 827 (10,04%/10,23%) | 275 722 (9,27%/27,16%) |
| 45-49 | 1 041 213 (9,32%) | 662 297 (9,25%/63,61%) | 111 934 (10,82%/10,75%) | 266 982 (8,98%/25,64%) |
| 50-54 | 774 499 (6,94%) | 492 046 (6,87%/63,53%) | 85 145 (8,23%/10,99%) | 197 308 (6,64%/25,48%) |
| 55-59 | 624 013 (5,59%) | 401 361 (5,61%/64,32%) | 68 511 (6,63%/10,98%) | 154 141 (5,18%/24,70%) |
| 60-64 | 564 635 (5,06%) | 383 286 (5,35%/67,88%) | 58 247 (5,63%/10,32%) | 123 102 (4,14%/21,80%) |
| 65-69 | 480 917 (4,31%) | 335 144 (4,68%/69,69%) | 46 826 (4,53%/9,74%) | 98 947 (3,33%/20,57%) |
| 70-74 | 380 897 (3,41%) | 269 331 (3,76%/70,71%) | 36 701 (3,55%/9,64%) | 74 865 (2,52%/19,65%) |
| 75-79 | 264 923 (2,37%) | 188 653 (2,63%/71,21%) | 25 867 (2,50%/9,76%) | 50 403 (1,70%/19,03%) |
| 80-84 | 179 670 (1,61%) | 131 158 (1,83%/73,00%) | 17 011 (1,65%/9,47%) | 31 501 (1,06%/17,53%) |
| 85+ | 170 350 (1,53%) | 126 490 (1,77%/74,25%) | 15 047 (1,46%/8,83%) | 28 813 (0,97%/16,91%) |
| Age group | Cuba (percent of the population) | White (percent in the race/percent in the age group) | Black (percent in the race/percent in the age group) | Mulatto/Mestizo (percent in the race/percent in the age group) |
|---|---|---|---|---|
| 0-14 | 1 922 562 (17,22%) | 1 224 314 (17,10%/63,68%) | 122 430 (11,84%/6,37%) | 575 818 (19,37%/29,95%) |
| 15-64 | 7 768 006 (69,56%) | 4 885 309 (68,23%/62,89%) | 770 162 (74,48%/9,91%) | 2 112 535 (71,06%/27,20%) |
| 65+ | 1 476 757 (13,22%) | 1 050 776 (14,67%/71,15%) | 141 452 (13,68%/9,58%) | 284 529 (9,57%/19,27%) |
Ancestral origins
| Official census 1775-1899[9] | ||||||||
|---|---|---|---|---|---|---|---|---|
| White | Non-white | |||||||
| Census | Number | Percentage | Number | Percentage | ||||
| 1775 | 96,440 | 56.2 | 75,180 | 43.8 | ||||
| 1792 | 153,559 | 56.4 | 118,741 | 43.6 | ||||
| 1817 | 257,380 | 45.0 | 314,983 | 55.0 | ||||
| 1827 | 311,051 | 44.2 | 393,435 | 55.8 | ||||
| 1841 | 418,291 | 41.5 | 589,333 | 58.5 | ||||
| 1861 | 793,484 | 56.8 | 603,046 | 43.2 | ||||
| 1877 | 1,023,394 | 67.8 | 485,897 | 32.2 | ||||
| 1887 | 1,102,889 | 67.6 | 528,798 | 32.4 | ||||
| 1899 | 1,067,354 | 67.9 | 505,443 | 32.1 | ||||
According to the previous censuses, the Chinese were counted as white.[10] The ancestry of Cubans comes from many sources:

During the 18th, 19th and early part of the 20th century, large waves of Spanish immigrants from Canary Islands, Catalonia, Andalusia, Galicia, and Asturias emigrated to Cuba. Between 1820 and 1898, a total of 508,455 people left Spain, and more than 750,000 Spanish immigrants left for Cuba between 1899 and 1930, with many returning to Spain.[11] There are 139,851 Spanish citizens living in Cuba on January 1, 2018.
The Slave trade brought Africans to Cuba during its early history: Between 1842 and 1873, 221,000 African slaves entered Cuba.[11]
People of the Americas:
Other European people that have contributed include:


People from Asia:
Between 1842 and 1873, 124,800 Chinese arrived.[11]
There are also a small number of Jews living in Cuba.
Genetics
An autosomal study from 2014 has found out the genetic average ancestry in Cuba to be 72% European, 20% African and 8% Native American with different proportions depending on the self-reported ancestry (White, Mulatto or Mestizo, and Black):[12]
| Self-reported ancestry | European | African | Native American |
| White | 86% | 6.7% | 7.8% |
| Mulatto/Mestizo | 63.8% | 25.5% | 10.7% |
| Black | 29% | 65.5% | 5.5% |
A 1995 study done on the population of Pinar del Rio, found that 50% of the Mt-DNA lineages (female lineages) could be traced back to Europeans, 46% to Africans and 4% to Native Americans. This figure is consistent with both the historical background of the region, and the current demographics of it.[13]
According to another study in 2008, the Native American contribution to present-day Cubans accounted for 33% of the maternal lineages, whereas Africa and Eurasia contributed 45% and 22% of the lineages, respectively. Haplogroup A2 is the main Native American haplogroup in Cuba (21.9% of the total sample), accounting for 67% of the Native American mtDNA gene pool. Regarding Y-chromosome haplogroups (male lineages), 78.8% of the sequences found in Cubans are of West Eurasian origin, 19.7% of African origin and 1.5% of East Asian origin. Among the West Eurasian fraction, the vast majority of individuals belong to West European haplogroup R1b. The African lineages found in Cubans have a Western (haplogroups E1, E2, E1b1a ) and Northern (E1b1b-M81 ) African origin. The "Berber" haplogroup E1b1b1b (E-M81), is found at a frequency of 6.1%.[14]
According to Fregel et al. (2009), the fact that autochthonous male North African E-M81 and female U6 lineages from the Canaries have been detected in Cuba and Iberoamerica, demonstrates that Canary Islanders with indigenous ancestors actively participated in the American colonization.[15]
Y-DNA
| N[16] | E-M33 | E-M75 | E-M2 | E1b1b-M35 | E1b1b-M78 | E1b1b-M81 | E1b1b-M123 | G | I | J2 | T | R1a | R1b | N/O | O-P31 |
| 132 | 0.8% | 1.5% | 9.8% | 1.5% | 4.5% | 6.1% | 1.5% | 6.1% | 8.3% | 6.1% | 1.5% | 1.5% | 50.8% | 0.8% | 0.8% |
mtDNA
| N[16] | L | U6 | A | B | C | D | H | I1 | J* | J2a | J1b | J2 | K | T* | T1a | T2 | T | U* | U4 | U4a2 | U5a | V | W |
| 245 | 43.3% | 2% | 22.4% | 2% | 5.3% | 3.3% | 9% | 0.4% | 2.4% | 0.4% | 0.4% | 0.4% | 0.8% | 0.4% | 0.8% | 0.8% | 0.8% | 0.8% | 0.8% | 1.2% | 0.8% | 0.8% | 0.4% |
Other demographics statistics
Demographic statistics according to the World Population Review in 2019.[17]
- One birth every 4 minutes
- One death every 6 minutes
- One net migrant every 26 minutes
- Net gain of one person every 85 minutes
Demographic statistics according to the CIA World Factbook, unless otherwise indicated.[18]
- Population
- 11,209,628 (2018)
- Ethnic groups
- white 64.1%, mulatto or mixed 26.6%, black 9.3% (2012 est.)
- note: data represent racial self-identification from Cuba's 2012 national census
- Age structure
- 0-14 years: 16.44% (male 940,787 /female 886,996)
- 15-24 years: 12.1% (male 698,220 /female 646,684)
- 25-54 years: 43.69% (male 2,443,190 /female 2,414,119)
- 55-64 years: 12.54% (male 677,304 /female 716,704)
- 65 years and over: 15.22% (male 773,636 /female 918,756) (2018 est.)
- Median age
- total: 41.8 years. Country comparison to the world: 36th
- male: 40.2 years
- female: 43.1 years (2018 est.)
- Birth rate
- 10.6 births/1,000 population (2018 est.) Country comparison to the world: 185th
- Death rate
- 8.9 deaths/1,000 population (2018 est.) Country comparison to the world: 63rd
- Total fertility rate
- 1.71 children born/woman (2018 est.) Country comparison to the world: 170th
- Net migration rate
- -4.5 migrant(s)/1,000 population (2018 est.) Country comparison to the world: 188th
- Population growth rate
- -0.27% (2018 est.) Country comparison to the world: 215th
- Contraceptive prevalence rate
- 73.7% (2014)
- Religions
- Christian 59.2%, folk 17.4%, other .4%, none 23% (2010 est.)
- note: data is estimative because no authoritative source on religious affiliation in Cuba
- Dependency ratioS
- total dependency ratio: 43.3 (2015 est.)
- youth dependency ratio: 23.3 (2015 est.)
- elderly dependency ratio: 19.9 (2015 est.)
- potential support ratio: 5 (2015 est.)
- Urbanization
- urban population: 77% of total population (2018)
- rate of urbanization: 0.14% annual rate of change (2015-20 est.)
- Life expectancy at birth
- total population: 78.9 years. Country comparison to the world: 56th
- male: 76.6 years
- female: 81.4 years (2018 est.)
- Literacy
definition: age 15 and over can read and write (2015 est.)
- total population: 99.8%
- male: 99.9%
- female: 99.8% (2015 est.)
- School life expectancy (primary to tertiary education)
- total: 14 years
- male: 14 years
- female: 14 years (2016)
- Unemployment, youth ages 15–24
- total: 6.1%. Country comparison to the world: 150th
- male: 6.4%
- female: 5.6% (2010 est.)
- Languages
- Spanish (official)
Language
Spanish is the official language of Cuba. Of all the regional variations of Spanish, Cuban Spanish is most similar to, and originates largely from, the dialect spoken in the Canary Islands. This is a consequence of Canarian migration, which in the 19th and early 20th century was heavy and continuous. There were also migrations of Galicians and Asturians as well, but they did not impact Cuban Spanish to the same degree.
Much of the typical Cuban replacements for standard Spanish vocabulary stems from Canarian lexicon. For example, guagua (bus) differs from standard Spanish autobús the former originated in the Canaries and is an onomatopoeia stemming from the sound of a Klaxon horn (wah-wah!). An example of Canarian usage for a Spanish word is the verb fajarse[19] ("to fight"). In standard Spanish the verb would be pelearse, while fajar exists as a non-reflexive verb related to the hemming of a skirt.
The second most spoken language of Cuba is Haitian Creole, used mainly by Haitian immigrants and its descendants going back since the late 18th century, of whom fled the Haitian Revolution.
Other languages of Cuba are Cuban Sign Language, and English is commonly studied as a foreign language.
There are also reports of Lucumi, "Lengua Conga" (Kongo-based liturgical language of the Palo religion) and Bozal Spanish (an "African" socio-dialect of Spanish; now used only in folk religion).[20] Historically, the Ciboney and Classic dialects of Taino and the unattested Guanahatabey were spoken.
Religion
Cuba has a multitude of faiths reflecting the island's diverse cultural elements. Catholicism, which was brought to the island by Spanish colonialists at the beginning of the 16th century, is the most prevalent professed faith. After the revolution, Cuba became an officially atheistic state and restricted religious practice. Since the Fourth Cuban Communist Party Congress in 1991, restrictions have been eased and, according to the National Catholic Observer, direct challenges by state institutions to the right to religion have all but disappeared,[21] though the church still faces restrictions of written and electronic communication, and can only accept donations from state-approved funding sources.[21] The Roman Catholic Church is made up of the Cuban Catholic Bishops' Conference (COCC), led by Jaime Lucas Ortega y Alamino, Cardinal Archbishop of Havana. It has eleven dioceses, 56 orders of nuns and 24 orders of priests. In January 1998, Pope John Paul II paid a historic visit to the island, invited by the Cuban government and Catholic Church.
Afro-Cuban religions, a blend of native African religions and Roman Catholicism, are widely practiced in Cuba. This diversity derives from West and Central Africans who were transported to Cuba, and in effect reinvented their African religions. They did so by combining them with elements of the Catholic belief system, with a result very similar to Brazil. One of these Afro-Cuban religions is Santeria.
Protestantism, introduced from the United States in the 18th century, has seen a steady increase in popularity. 300,000 Cubans belong to the island's 54 Protestant denominations. Pentecostalism has grown rapidly in recent years, and the Assemblies of God alone claims a membership of over 100,000 people. The Episcopal Church of Cuba claims 10,000 adherents. Cuba has small communities of Jews, Muslims, Buddhists and members of the Bahá'í Faith.
Demographic statistics from the CIA World Factbook
| Part of a series on |
| Life in Cuba |
|---|
  |
| Age structure |
|
|---|---|
| Median age: |
|
| Sex ratio |
|
| Life expectancy at birth |
|
| Ethnic groups | |
| Religions | nominally Roman Catholic 85%, Protestant, Jehovah's Witnesses, Jewish, Santeria |
| Languages |
|
| Literacy | Total population:99.8% (2002 census)
Definition: age 15 and over can read and write |
Illicit migration is a continuing problem. Cubans attempt to depart the island and enter the US using homemade rafts, alien smugglers, direct flights, or falsified visas; Cubans also use non-maritime routes to enter the US including direct flights to Miami and overland via the southwest US/Mexican border, and islands adjacent to Puerto Rico and the US Virgin Islands.
See also
- Cuban American
- Afro-Cuban
- Haitian Cuban
- Isleños
- Chinese Cuban
- Jewish Cuban
- Women in Cuba
- Provinces of Cuba
References
- "Censos en Cuba" [Census in Cuba] (PDF) (in Spanish). National Office of Statistics of Cuba. Retrieved 24 February 2014.
- "Oficina Nacional de Estadísticas. Cuba". One.cu. Retrieved 2 November 2017.
- "PERSONS OBTAINING LEGAL PERMANENT RESIDENT STATUS BY REGION AND COUNTRY OF BIRTH: FISCAL YEARS 2003 TO 2012" (XLS). Dhs.gov. Retrieved 2 November 2017.
- http://citypopulation.de/en/cuba/cities/
- United nations. Demographic Yearbooks
- Estadísticas, Oficina Nacional de (28 April 2006). "Oficina Nacional de Estadísticas. Cuba". One.cu. Retrieved 2 November 2017.
- "Archived copy" (PDF). Archived from the original (PDF) on 2014-06-03. Retrieved 2017-08-09.CS1 maint: archived copy as title (link)
- "United Nations Statistics Division - Demographic and Social Statistics". Unstats.un.org. Retrieved 2 November 2017.
- "Report on the Census of Cuba, 1899 :: Census of Cuba 1899". Digital.tcl.sc.edu. Retrieved 2 November 2017.
- "Report on the Census of Cuba, Census of Cuba 1899". Digital.tcl.sc.edu. Retrieved 5 April 2020.
- La inmigración entre 1902 y 1930 Archived June 6, 2009, at the Wayback Machine
- Marcheco-Teruel et al. 2014, Cuba: Exploring the History of Admixture and the Genetic Basis of Pigmentation Using Autosomal and Uniparental Markers
- Torroni, Antonio; Brown, Michael D.; Lott, Marie T.; Newman, Nancy J.; Wallace, Douglas C. (1995). "African, Native American, and European mitochondrial DNAs in Cubans from Pinar del Rio Province and implications for the recent epidemic neuropathy in Cuba". Human Mutation. 5 (4): 310–7. doi:10.1002/humu.1380050407. PMID 7627185.
- Y-chromosome haplogroup frequencies found in Cuba (132 individuals) grouped according to their phylogeographic origin Mendizabal, I; Sandoval, K; Berniell-Lee, G; et al. (2008). "Genetic origin, admixture, and asymmetry in maternal and paternal human lineages in Cuba". BMC Evol. Biol. 8: 213. doi:10.1186/1471-2148-8-213. PMC 2492877. PMID 18644108.
- Fregel, Rosa; Gomes, Verónica; Gusmão, Leonor; González, Ana M; Cabrera, Vicente M; Amorim, António; Larruga, Jose M; et al. (2009). "Demographic history of Canary Islands male gene-pool: replacement of native lineages by European". BMC Evolutionary Biology. 9: 181. doi:10.1186/1471-2148-9-181. PMC 2728732. PMID 19650893.
- Mendizabal et al (2008).Genetic origin, admixture, and asymmetry in maternal and paternal human lineages in Cuba
- "Cuba Population 2019", World Population Review
- "World Factbook CENTRAL AMERICA : CUBA", The World Factbook, July 12, 2018

- fajar at Diccionario de la Real Academia Española.
- Wirtz, Kristina. 2014. Performing Afro-Cuba: Image, Voice, Spectacle in the Making of Race and History. Chicago: University of Chicago Press. ISBN 978-0-226-11905-2
- Catholic church in Cuba strives to reestablish the faith National Catholic Observer
- Statoids (July 2003). "Municipios of Cuba". Retrieved 2007-02-15.
- Matanzas Portal (2004). "Population gowth by municipality and province". Archived from the original on 2006-07-14. Retrieved 2007-02-21.
- The Peninsular (May 2007). Population, birth rate falling in Cuba: Official
External links
| Africa |
|
|---|---|
| Americas | |
| Asia |
|
| Europe | |
| Others | |
Portal | |