Demographics of Bangladesh
Bangladesh is the eighth-most populated country in the world with almost 2.2% of the world's population. According to the 2019 revision of the World Population Prospects[3][4], the population stood at 161,376,708 in 2016.
| Demographics of Bangladesh | |
|---|---|
 Map showing the population density of each district in Bangladesh. | |
| Population | 161,376,708 (2016 est.)[1] |
| Growth rate | 1% (2017 est.)[2] |
| Birth rate | 18.80 births/1,000 population (2017 est.)[2] |
| Death rate | 5.40 deaths/1,000 population (2017 est.)[2] |
| Life expectancy | 72.7 years (2018)[2] |
| • male | 71.1 years |
| • female | 74.4 years |
| Fertility rate | 2.17 children born/woman (2017 est.)[2] |
| Infant mortality rate | 31.70 deaths/1,000 live births (2017 est.)[2] |
| Age structure | |
| 0–14 years | 27.76 (2017 est.)[2] |
| 15–64 years | 66.02 |
| 65 and over | 6.23 |
| Sex ratio | |
| Total | 0.97 male(s)/female (2017 est.)[2] |
| At birth | 1.04 male(s)/female |
| Under 15 | 1.03 male(s)/female |
| 15–64 years | 0.91 male(s)/female |
| 65 and over | 0.97 male(s)/female |
| Nationality | |
| Nationality | Bangladeshi |
| Major ethnic | Bengali |
| Minor ethnic | Chakma, Marma, Mundas, Garos (Achiks), Oraons, Santhals, Mro, Manipuri, Zomi, Bihari (Stranded Pakistani) |
| Language | |
| Official | Bengali |
| Spoken | Bengali, Chittagonian language, Sylheti, Santali, Chakma, Tripuri, Khasi, Mundari |
| Part of a series on |
| Bengalis |
|---|
 |
|
Bengali homeland |
|
Bengali culture
|
|
Bengali symbols |
Bangladesh (Previously East Pakistan between 1947 and 1971 and East Bengal before 1947) is largely ethnically homogeneous, and its name derives from the Bengali ethno-linguistic group which comprises 98% of the population. The Chittagong Hill Tracts, Sylhet, Mymensingh and North Bengal regions are home to diverse indigenous peoples. There are many dialects of Bengali spoken throughout the region. The dialect spoken by those in Chittagong and Sylhet are particularly distinctive. The population is estimated at 161 million (2018[3][4]). About 89% of Bangladeshis are Muslims, followed by Hindus (10 .7%), Buddhists (0.6%) and Christians (0.4%) and others.
Bangladesh has one of the highest population densities in the world. The total fertility rate (TFR) has been reduced by more than two thirds since Independence. Current TFR in Bangladesh is 2.1 which means that women have 2.1 children on average in their lifetime. At this TFR and without migration, country's population will eventually be neither growing nor shrinking, once the top of its age pyramid fills in.[5]
Population
The 2020 total population was 168,827,626 which makes Bangladesh the eighth-most populous country in the world.
Census

| Census date | census population (thousands) | adjusted population (thousands) |
|---|---|---|
| 1901 | 28 928 | |
| 1911 | 31 555 | |
| 1921 | 33 255 | |
| 1931 | 35 602 | |
| 1941 | 41 997 | |
| 1951 | 41 932 | |
| 1961 | 50 840 | |
| 1974 | 71 479 | 76 398 |
| 1981 | 87 120 | 89 912 |
| 1991 | 106 313 | 111 455 |
| 2001 | 124 355 | 130 523 |
| 15 Mar 2011 | 142 319 | 152 518 |
p=provisional figure
UN estimates[7]
| Total population (thousands) | Population aged 0–14 (%) | Population aged 15–64 (%) | Population aged 65+ (%) | |
|---|---|---|---|---|
| 1950 | 37 895 | 41.2 | 54.8 | 3.9 |
| 1955 | 43 444 | 42.4 | 54.1 | 3.5 |
| 1960 | 50 102 | 43.6 | 53.1 | 3.3 |
| 1965 | 57 792 | 44.7 | 52.0 | 3.3 |
| 1970 | 66 881 | 44.7 | 51.8 | 3.4 |
| 1975 | 70 582 | 45.8 | 50.7 | 3.5 |
| 1980 | 80 624 | 45.0 | 51.4 | 3.6 |
| 1985 | 92 284 | 43.9 | 52.5 | 3.6 |
| 1990 | 105 256 | 42.5 | 53.8 | 3.7 |
| 1995 | 117 487 | 40.3 | 55.9 | 3.8 |
| 2000 | 129 592 | 37.3 | 58.7 | 4.0 |
| 2005 | 140 588 | 34.3 | 61.4 | 4.3 |
| 2010 | 148 692 | 31.3 | 64.1 | 4.6 |
| 2015 | 160 996 | 28 | 65 | 6 |
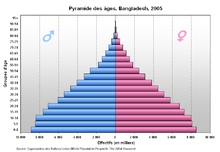
Structure of the population
Structure of the population (15 March 2011) (Census) :
| Age Group | Male | Female | Total | % |
|---|---|---|---|---|
| Total | 72 109 796 | 71 933 901 | 144 043 697 | 100 |
| 0-4 | 7 638 523 | 7 423 447 | 15 061 970 | 10.46 |
| 5-9 | 9 322 514 | 8 850 715 | 18 173 229 | 12.62 |
| 10-14 | 8 614 889 | 8 031 726 | 16 646 615 | 11.56 |
| 15-19 | 6 509 492 | 6 352 398 | 12 861 890 | 8.93 |
| 20-24 | 5 777 370 | 7 522 419 | 13 299 789 | 9.23 |
| 25-29 | 6 225 252 | 7 254 256 | 13 479 508 | 9.36 |
| 30-34 | 5 079 106 | 5 420 659 | 10 499 765 | 7.29 |
| 35-39 | 4 697 349 | 4 859 079 | 9 556 428 | 6.63 |
| 40-44 | 4 280 923 | 3 980 739 | 8 261 662 | 5.74 |
| 45-49 | 3 363 273 | 3 016 800 | 6 380 073 | 4.43 |
| 50-54 | 2 952 596 | 2 599 675 | 5 552 271 | 3.85 |
| 55-59 | 1 923 534 | 1 577 463 | 3 500 997 | 2.43 |
| 60-64 | 2 081 306 | 1 852 708 | 3 934 014 | 2.73 |
| 65-69 | 1 149 569 | 963 921 | 2 113 490 | 1.47 |
| 70-74 | 1 206 398 | 1 025 314 | 2 231 712 | 1.55 |
| 75-79 | 488 338 | 386 389 | 874 727 | 0.61 |
| 80-84 | 443 239 | 436 840 | 880 079 | 0.61 |
| 85-89 | 138 268 | 124 343 | 262 611 | 0.18 |
| 90-94 | 116 916 | 133 273 | 250 189 | 0.17 |
| 95+ | 100 941 | 121 737 | 222 678 | 0.15 |
| Age group | Male | Female | Total | % |
|---|---|---|---|---|
| 0-14 | 25 575 926 | 24 305 888 | 49 881 814 | 34,63 |
| 15-64 | 42 890 201 | 44 436 196 | 87 326 397 | 60,62 |
| 65+ | 3 643 669 | 3 191 817 | 6 835 486 | 4,75 |
Structure of the population (DHS 2014) Male: 37 672, Female: 39 641, Total: 77 313 :
| Age Group | Male | Female | Total |
|---|---|---|---|
| 0-4 | 11.0 | 9.6 | 10.3 |
| 5-9 | 11.8 | 10.7 | 11.2 |
| 10-14 | 12.3 | 11.5 | 11.9 |
| 15-19 | 9.4 | 11.5 | 10.5 |
| 20-24 | 6.7 | 9.8 | 8.3 |
| 25-29 | 7.6 | 9.1 | 8.3 |
| 30-34 | 6.7 | 7.9 | 7.3 |
| 35-39 | 6.3 | 6.0 | 6.2 |
| 40-44 | 5.7 | 5.4 | 5.6 |
| 45-49 | 4.6 | 4.6 | 4.6 |
| 50-54 | 4.5 | 3.1 | 3.8 |
| 55-59 | 3.4 | 3.6 | 3.5 |
| 60-64 | 3.4 | 2.6 | 3.0 |
| 65-69 | 2.4 | 1.6 | 2.0 |
| 70-74 | 1.9 | 1.2 | 1.5 |
| 75-79 | 1.0 | 0.5 | 0.8 |
| 80+ | 1.3 | 1.2 | 1.3 |
| Age group | Male | Female | Total |
|---|---|---|---|
| 0-14 | 35.1 | 31.8 | 33.4 |
| 15-64 | 58.3 | 63.7 | 61.0 |
| 65+ | 6.6 | 4.5 | 5.6 |
Other sources
The following table lists various recent estimates of the population.
| Source | Year | Population (millions) |
| US State Dept[10] | 2005 | 144 |
| Population Reference Bureau[11] | 2005 | 144 |
| World Bank[12] | 2008 | 160 |
| CIA World FactBook[13] | 2010 | 156 |
| World Population Reference[14] | 2010 | 164 |
According to the OECD/World Bank population in Bangladesh increased from 1990 to 2008 with 44 million and 38% growth in population compared to 34% growth in India and 54% growth in Pakistan. The annual population growth 2007-2008 was 1.4% compared to India 1.35%, Pakistan 2.2%, Dem. Rep. of Congo 2.9%, Tanzania 2.9%, Syria 3.5% or Yemen 4.0%. According to the OECD/World Bank population statistics between 1990-2008 the world population growth was 27% and 1,423 million persons.[15]
Population growth rate
.jpg)
Bangladesh had high rates of population growth in the 1960s and 1970s. Since then however it has seen significant reduction in its total fertility rate. Over a period of three decades it dropped from almost 7 to 2.4 in 2005-2010.[7]
Gender ratio
| Age range (years) | Sex ratio (males/females) (2015 est.)[16] |
|---|---|
| at birth | 1.04 |
| 0–14 | 1.03 |
| 15–24 | 0.89 |
| 25–54 | 0.90 |
| 55–64 | 1.01 |
| 65 and over | 0.97 |
| total population | 0.95 |
Urban and rural
The sprawling mega-city of Dhaka has a huge population, but the majority of the people nonetheless still live in villages in rural areas.
- Urban population: 27% of total population (2009 est.)
- Rate of urbanization: 3.5% annual rate of change (2005-2010 est.)
- Bangladesh is considered an urban country based on their population density (hrsa.gov)
Population Density
Based on the CIA World Fact Book 2012 figures for population (161,083,804) and land area (130,168 km2), Bangladesh has the highest population density among large countries, 1,237.51 persons per square kilometre, and 12th overall, when small countries and city-states are included.[17]
Vital statistics
Births and deaths[7]
| Period | Live births per year | Deaths per year | Natural change per year | CBR1 | CDR1 | NC1 | TFR1 | IMR1 |
|---|---|---|---|---|---|---|---|---|
| 1950-1955 | 1 963 000 | 852 000 | 1 111 000 | 48.3 | 20.9 | 27.4 | 6.36 | 165.0 |
| 1955-1960 | 2 252 000 | 921 000 | 1 332 000 | 48.2 | 19.7 | 28.5 | 6.62 | 156.5 |
| 1960-1965 | 2 560 000 | 994 000 | 1 566 000 | 47.5 | 18.4 | 29.1 | 6.80 | 151.2 |
| 1965-1970 | 2 950 000 | 1 090 000 | 1 860 000 | 47.3 | 17.5 | 29.8 | 6.92 | 144.4 |
| 1970-1975 | 3 193 000 | 1 847 000 | 1 346 000 | 46.5 | 26.9 | 19.6 | 6.91 | 175.6 |
| 1975-1980 | 3 381 000 | 1 165 000 | 2 229 000 | 44.7 | 15.2 | 29.5 | 6.63 | 138.3 |
| 1980-1985 | 3 670 000 | 1 181 000 | 2 519 000 | 42.4 | 13.3 | 29.1 | 5.98 | 122.5 |
| 1985-1990 | 3 773 000 | 1 131 000 | 2 652 000 | 38.1 | 11.3 | 26.8 | 4.98 | 104.4 |
| 1990-1995 | 3 711 000 | 1 047 000 | 2 653 000 | 33.3 | 9.5 | 23.8 | 4.06 | 90.6 |
| 1995-2000 | 3 669 000 | 942 000 | 2 612 000 | 29.3 | 7.5 | 21.8 | 3.43 | 73.8 |
| 2000-2005 | 3 575 000 | 896 000 | 2 498 000 | 26.0 | 6.5 | 19.5 | 2.94 | 59.3 |
| 2005-2010 | 3 327 000 | 869 000 | 2 202 000 | 22.5 | 5.9 | 16.6 | 2.48 | 49.0 |
| 2010-2015 | 20.2 | 5.4 | 14.8 | 2.22 | ||||
| 2015-2020 | 18.5 | 5.3 | 13.2 | 2.07 | ||||
| 2020-2025 | 16.8 | 5.3 | 11.5 | 1.94 | ||||
| 2025-2030 | 15.1 | 5.4 | 9.7 | 1.84 | ||||
| 2030-2035 | 13.7 | 5.8 | 7.9 | 1.76 | ||||
| 2035-2040 | 12.6 | 6.2 | 6.4 | 1.70 | ||||
| 1 CBR = crude birth rate (per 1000); CDR = crude death rate (per 1000); NC = natural change (per 1000); TFR = total fertility rate (number of children per woman); IMR = infant mortality rate per 1000 births | ||||||||
Sample Vital Registration System
| Year | Population | Live births | Deaths | Natural change | Crude birth rate (per 1000): National (Urban/Rural) | Crude death rate (per 1000): National (Urban/Rural) | Natural change (per 1000): National (Urban/Rural) | Fertility rates: National (Urban/Rural) |
|---|---|---|---|---|---|---|---|---|
| 2005 | 138,600,000 | 2,879,000 | 20.7 (17.8/21.7) | 5.8 (4.9/6.1) | 14.9 (12.9/15.6) | 2.46 (1.87/2.65) | ||
| 2006 | 140,600,000 | 2,901,000 | 20.6 (17.5/21.7) | 5.6 (4.4/6.0) | 15.0 (13.1/15.7) | 2.41 (1.81/2.63) | ||
| 2007 | 142,600,000 | 2,986,000 | 20.9 (17.4/22.1) | 6.2 (5.1/6.6) | 14.7 (12.3/15.5) | 2.39 (1.79/2.61) | ||
| 2008 | 144,700,000 | 3,022,000 | 20.5 (17.2/22.4) | 6.0 (5.1/6.5) | 14.5 (12.1/15.9) | 2.30 (1.79/2.60) | ||
| 2009 | 146,700,000 | 2,832,000 | 19.4 (16.8/20.4) | 5.8 (4.7/6.1) | 13.6 (12.1/14.3) | 2.15 (1.65/2.28) | ||
| 2010 | 148,600,000 | 2,868,494 | 842,095 | 2,026,399 | 19.2 (17.1/20.1) | 5.6 (4.9/5.9) | 13.6 (12.2/14.2) | 2.12 (1.72/2.26) |
| 2011 | 150,600,000 | 2,891,000 | 828,000 | 2,063,000 | 19.2 (17.4/20.2) | 5.5 (4.8/5.8) | 13.7 (12.6/14.4) | 2.11 (1.71/2.25) |
| 2012 | 152,700,000 | 2,933,000 | 826,000 | 2,107,000 | 18.9 (17.1/20.0) | 5.3 (4.6/5.7) | 13.6 (12.5/14.3) | 2.12 (1.84/2.30) |
| 2013 | 154,700,000 | 19.0 (18.2/19.3) | 5.3 (4.6/5.6) | 13.7 (13.6/13.7) | 2.11 (1.84/2.19) | |||
| 2014 | 156,800,000 | 18.9 (17.2/19.4) | 5.2 (4.1/5.6) | 13.7 (13.1/13.8) | 2.11 (1.77/2.22) | |||
| 2017 | 3,009,950 | 829,770 | 2,180,180 | |||||
Fertility
Total Fertility Rate (TFR):[20]
| Year | TFR (Total) | TFR (Rural) | TFR (Urban) |
|---|---|---|---|
| 2018 | 2.05 | 2.38 | 1.68 |
Total fertility rate by divisions
| Division | TFR (total fertility rate) | Crude birth rate | Death rate |
|---|---|---|---|
| Mymensingh | 2,44 | 19.5 | 4.9 |
| Barishal | 2,34 | 18.2 | 5.4 |
| Chittagong | 2.09 | 18.9 | 4.8 |
| Dhaka | 2,17 | 19.9 | 5.4 |
| Rajshahi | 2,04 | 17.9 | 5.3 |
| Rangpur | 2,22 | 19.3 | 5.1 |
| Sylhet | 2,09 | 19.0 | 4.9 |
Fertility Rate (The Demographic Health Survey)
[21] Fertility Rate (TFR) (Wanted Fertility Rate) and CBR (Crude Birth Rate):
| Year | CBR (Total) | TFR (Total) | CBR (Urban) | TFR (Urban) | CBR (Rural) | TFR (Rural) |
|---|---|---|---|---|---|---|
| 1993-1994 | 29.1 | 3.44 (2.1) | 25.3 | 2.69 (1.7) | 29.5 | 3.54 (2.2) |
| 1996-1997 | 29.4 | 3.27 (2.1) | 22.6 | 2.10 (1.5) | 30.2 | 3.43 (2.2) |
| 1999-2000 | 30.2 | 3.31 (2.2) | 25.3 | 2.45 (1.7) | 31.3 | 3.54 (2.4) |
| 2001 | 28.4 | 3.22 | 26.0 | 2.69 | 28.9 | 3.36 |
| 2004 | 28.7 | 3.0 (2.0) | 25.8 | 2.5 (1.6) | 29.5 | 3.2 (2.1) |
| 2007 | 26.1 | 2.7 (1.9) | 24.7 | 2.4 (1.7) | 26.5 | 2.8 (1.9) |
| 2011 | 22.6 | 2.3 (1.6) | 20.6 | 2.0 (1.5) | 23.3 | 2.5 (1.6) |
| 2014 | 22.2 | 2.3 (1.6) | 20.8 | 2.0 (1.5) | 22.8 | 2.4 (1.7) |
| 2017-18 | 21.9 | 2.3 | 21.1 | 2.0 | 22.3 | 2.3 |
Health
Life expectancy at birth
- Total population: 72.7 years (2018)[22]
- Male: 71.1 years
- Female: 74.4 years
| Period | Life expectancy in Years |
Period | Life expectancy in Years |
|---|---|---|---|
| 1950–1955 | 40.7 | 1985–1990 | 57.0 |
| 1955–1960 | 44.2 | 1990–1995 | 60.0 |
| 1960–1965 | 47.2 | 1995–2000 | 63.7 |
| 1965–1970 | 49.3 | 2000–2005 | 66.7 |
| 1970–1975 | 46.3 | 2005–2010 | 69.1 |
| 1975–1980 | 52.2 | 2010–2015 | 71.2 |
| 1980–1985 | 54.3 |
Source: UN World Population Prospects[23]
HIV/AIDS
- Prevalence rate: less than 0.1% (adults, 102nd in world, 2001 est.); 0.01% (2014 est.)
- People living with HIV/AIDS: 12,000 (85th in world, 2007 est.)
- Deaths: fewer than 500 (87th in world, 2007 est.); about 700 (2014 est.).
Major infectious diseases
- Degree of risk: high
- Food or waterborne diseases: bacterial and protozoal diarrhea, hepatitis A and E, and typhoid fever
- Vectorborne diseases: dengue fever and malaria are high risks in some locations
- Water contact disease: leptospirosis
- Animal contact disease: rabies (2005)
Ethnic groups
The vast majority (about 98.5%) of Bangladeshis are of the Bengali ethno-linguistic group. This group also spans the neighboring Indian province of West Bengal. Minority ethnic groups include Meitei, Tripura, Marma, Tanchangya, Barua, Khasi, Santhals, Chakma, Rakhin people, Garo, Biharis, Oraons, Mundas and Rohingyas.
Communities of Persian and Iranic peoples mainly reside in the city of Chittagong and are the descendants of migrants that immigrated during the Pakistani dominion over Bangladesh, and also from the British Partition of 1947. Some are descendants of the Persian settlers during the medieval era of the Bengal Sultanate, most Iranic peoples living in Chittagong are either mainly or fully integrated into Bengali society, and have even influenced the Chittagonian language as a whole.[25][26][27]
Biharis are Urdu-speaking, non-Bengalis who emigrated from the state of Bihar and other parts of northern India during the 1947 partition. They are concentrated in the Dhaka and Rangpur areas and number some 300,000.[28][29] In the 1971 independence war many of them sided with Pakistan, as they stood to lose their positions in the upper levels of society.[30] Hundreds of thousands went to Pakistan and those that remained were interned in refugee camps. Their population declined from about 1 million in 1971 to 600,000 in the late 1980s.[30] Refugees International has called them a "neglected and stateless" people as they are denied citizenship by the governments of Bangladesh and Pakistan.[31] As nearly 40 years has passed, two generations of Biharis have been born in these camps. Biharis were granted Bangladeshi citizenship and voting rights in 2008.[32]
Bangladesh's tribal population was enumerated at 897,828 in the 1981 census.[30] These tribes are concentrated in the Chittagong Hill Tracts and around Mymensingh, Sylhet, and Rajshahi. They are of Sino-Tibetan descent and differ markedly in their social customs, religion, language and level of development. They speak Tibeto-Burman languages and most are Buddhist or Hindu.[30] The four largest tribes are Chakmas, Marmas, Tipperas, Tanchangya, and Mros. Smaller groups include the Santals in Rajshahi and Dinajpur, and Khasis, Garos, and Khajons in Mymensingh and Sylhet regions.[30]
There are small communities of Meitei people in the Sylhet district, which is close to the Meitei homeland across the border in Manipur, India.
There is a small population of Rohingya refugees from Myanmar near the border in the southeast. There are 28,000 living in two UN refugee camps in Cox's Bazar as well as some 200,000 "unregistered people of concern" living outside of the camps.[33] The refugee crisis originated in the early 1990s when the first wave numbering some 250,000 of the predominantly Muslim ethnic group fled persecution from their home in Rakhaine—Myanmar's western-most state. Bangladesh seeks to repatriate the refugees back to Myanmar.[34]
Language
- Official language: Bengali (also known as Bangla)
- Other languages often considered dialects of Bengali: Chittagonian, Sylheti, Rohingya, Tangchangya, Chakma, and Rangpuri.[35]
- Other Indic languages: Bishnupriya Manipuri, Assamese, various Bihari languages
- Tibeto-Burman languages: A'Tong, Chak, Koch, Garo, Megam, Meitei Manipuri, Mizo, Mru, Pangkhua, Rakhine/Marma, (Tipra/Tripura/Tripuri), Riang, Tippera, Usoi/Uchoi, various Chin languages[35]
- Austroasiatic languages: Khasi, Koda, Mundari, Pnar, Santali, War[35]
- Dravidian languages: Kurukh[35]
- Other languages: English (spoken and known widely in upper-class & politics), Arabic ( sometimes spoken and known by many Muslims, due to Islam being the primary religion), Hindi/Urdu (understood by some, and spoken by Biharis)
Religion
- Population trends for major religious groups in Bangladesh (1951–2011)
| Religious group |
Population % 1951.[36] |
Population % 1961[36] |
Population % 1974[36] |
Population % 1981[36] |
Population % 1991[36] |
Population % 2001[37] |
Population % 2011[38] |
|---|---|---|---|---|---|---|---|
| Islam | 78.9 % | 80.4 % | 85.4 % | 86.6 % | 88.3 % | 89.7% | 90.39 |
| Hinduism | 22 % | 18.5% | 13.5% | 12.1 % | 10.5 % | 9.2% | 8.3% |
| Buddhism | 0.7 % | 0.7 % | 0.6 % | 0.6 % | 0.6 % | 0.7 % | 0.6% |
| Christianity | 0.3 % | 0.3 % | 0.2 % | 0.3 % | 0.3 % | 0.3% | 0.4% |
| Other religions/No religion | 0.1 % | 0.1 % | 0.2 % | 0.3 % | 0.3 % | 0.1% | 0.1% |
Genetics
Bangladesh has the world's highest frequency of the M form of mitochondrial DNA. This genetic variant spans many continents, and is the single most common mtDNA haplogroup in Asia.[39] In Bangladesh it represents about 83% of maternal lineages.[40]
Education
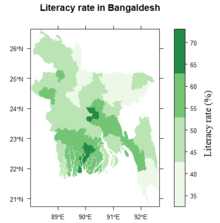
Bangladesh has a literacy rate of 72.9 percent as of 2018. 75.7 percent for males and 70.09 percent for females.
Migrants
According to the United Nations, there were 1,500,921 international migrants in Bangladesh in 2017.
Their most common countries of origin were as follows:
| International migrants in Bangladesh in 2017 | |
|---|---|
| 239,742 | |
| 208,406 | |
| 166,646 | |
| 156,500 | |
| 90,253 | |
| 47,103 | |
| 39,988 | |
| 35,250 | |
| 34,266 | |
| 30,877 | |
| 28,176 | |
| 20,109 | |
At the same time, the United Nations also enumerated the Bangladesh diaspora as 4,499,919 persons.
The most common countries where Bangladeshi migrants are located were as follows:
| International migrants from Bangladesh in 2017 | |
|---|---|
| 1,377,072 | |
| 1,044,505 | |
| 381,669 | |
| 365,600 | |
| 276,518 | |
| 228,353 | |
| 279,021 | |
| 183,386 | |
| 100,743 | |
| 83,279 | |
| 80,457 | |
| 65,698 | |
| 48,888 | |
| 38,620 | |
References
- "UNFPA - United Nations Population Fund". Unfpa.org. Retrieved 23 June 2019.
- "The World Factbook: Bangladesh: People and Society". Central Intelligence Agency. Retrieved 26 April 2018.
- ""World Population prospects – Population division"". population.un.org. United Nations Department of Economic and Social Affairs, Population Division. Retrieved 9 November 2019.
- ""Overall total population" – World Population Prospects: The 2019 Revision" (xslx). population.un.org (custom data acquired via website). United Nations Department of Economic and Social Affairs, Population Division. Retrieved 9 November 2019.
- Najma Rizvi (16 June 2018). "Healthy Change". Dandc.eu. Retrieved 29 October 2018.
- "2016 Population & Housing Census: Preliminary Results" (PDF). 203.112.218.65. Archived from the original (PDF) on 25 April 2012. Retrieved 23 June 2019.
- "World Population Prostpects 2017". Population Division of the Department of Economic and Social Affairs of the United Nations Secretariat. Archived from the original on 6 May 2011. Retrieved 30 October 2011.
- "7. Population by age, sex and urban/rural residence: latest available year, 2004 - 2013" (PDF). UN Stats.
- "Bangladesh : Demographic and Health Survey 2014" (PDF). Dhsprogram.com. Retrieved 22 June 2019.
- "Background Note: Bangladesh". U.S. Department of State. August 2005.
- "Country Profiles: Bangladesh". Population Reference Bureau. Archived from the original on 15 June 2006. Retrieved 28 July 2006.
- "World Development Indicators". World Bank. Archived from the original on 19 March 2011. Retrieved 29 August 2010.
- "CIA World Factbook 2010". CIA.
- "World Population Highlights: Key Findings From PRB's 2010 World Population Data Sheet". World Population Reference. Archived from the original on 4 September 2010. Retrieved 29 August 2010.
- CO2 Emissions from Fuel Combustion Population 1971-2008 (pdf Archived 6 January 2012 at the Wayback Machine pages 83-85) IEA (OECD/ World Bank) original population ref e.g. in IEA Key World Energy Statistics 2010 page 57
- "The World Factbook: Bangladesh: People and Society". Central Intelligence Agency. Retrieved 17 September 2016.
- "Population density – Persons per sq km 2012 Country Ranks". Retrieved 16 January 2013.
- http://unstats.un.org/unsd/demographic/products/vitstats/serATab3.pdf
- "Report on Bangladesh Sample Vital Statistics 2018" (PDF). Bangladesh Bureau of Statistics. p. 31.
- "The DHS Program - Quality information to plan, monitor and improve population, health, and nutrition programs". Dhsprogram.com. Retrieved 23 June 2019.
- "The Daily Star". Thedailystar.net. April 2017. Retrieved 26 April 2017.
- "World Population Prospects – Population Division – United Nations". Esa.un.org. Archived from the original on 19 September 2016. Retrieved 15 July 2017.
- "South Asia ::BANGLADESH". CIA The World Factbook.
- "The Role of the Persian Language in Bengali and the World Civilization: An Analytical Study" (PDF). Uits.edu. Archived from the original (PDF) on 31 October 2017. Retrieved 4 August 2018.
- "Bangladesh - Ethnic groups". Encyclopedia Britannica.
- "Chittagong City - Banglapedia". En.banglapedia.org.
- "Socio-economic Problems of the Urdu Speaking Residents at Mohammadpur" (PDF). Democracy Watch. Retrieved 12 April 2011.
- Persoob, Tasmia. "The Forgotten Community: Camp Based Urdu Speaking People in Bangladesh" (PDF). Jahangirnagar University. Archived from the original (PDF) on 22 March 2012. Retrieved 12 April 2011.
- Ethnic and Linguistic Diversity, Bangladesh: A Country Study, Edited by James Heitzman and Robert Worden, Washington: GPO for the Library of Congress, 1989.
- "Refugees of Nowhere: The Stateless Biharis of Bangladesh". Refugees International. 15 February 2006. Archived from the original on 14 June 2007.
- "Citizenship for Bihari refugees". BBC News. 19 May 2008. Retrieved 21 May 2008.
- 2010 Regional Operations Profile - South-East Asia, UNHCR, 2010.
- "Rohingya refugees in Bangladesh refuse repatriation". AFP. 30 December 2009.
- "Bangladesh". Ethnologue. Retrieved 23 June 2019.
- "Bangladesh- Population census 1991: Religious Composition 1901-1991". Bangladeshgov.org. 2 August 2016.
- "Bangladesh: at a glance". Bangladesh Bureau of Educational Information and Statistics (BANBEIS). Archived from the original on 3 April 2016. Retrieved 13 April 2016.
- "Population & Housing Census 2011". Bangladesh Bureau of Statistics (BBS). Archived from the original on 3 June 2016. Retrieved 13 April 2016.
- Ghezzi et al. (2005), Mitochondrial DNA haplogroup K is associated with a lower risk of Parkinson's disease in Italians, European Journal of Human Genetics (2005) 13, 748–752.
- Mait Metspalu et al., Most of the extant mtDNA boundaries in South and Southwest Asia were likely shaped during the initial settlement of Eurasia by anatomically modern humans. BMC Genetics, 2004
External links

| Indo-Aryans |
|  |
|---|---|---|
| Austro-Asiatic |
| |
| Dravidian |
| |
| Tibeto-Burman | ||
| Others | ||
| Sovereign states |
|
|---|---|
| States with limited recognition | |
| Dependencies and other territories |
|
| |
| Sovereign states |
|
|---|---|
| States with limited recognition |
|
| Dependencies and other territories |
|
| |