Demographics of Zimbabwe
This article is about the demographic features of the population of Zimbabwe, including population density, ethnicity, education level, health of the populace, economic status, religious affiliations and other aspects of the population.
 | |
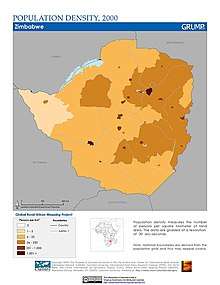 Population Density Map of Zimbabwe | |
| Languages | |
|---|---|
| English and Regional languages | |
| Religion | |
| Christianity |
Population
The population of Zimbabwe has grown during the 20th century in accordance with the model of a developing country with high birth rates and falling death rates, resulting in relatively high population growth rate (around 3% or above in the 1960s and early 1970s). After a spurt in the period 1980-1983 following independence, a decline in birth rates set in. Since 1991, however, there has been a jump in death rates from a low of 10 per 1000 in 1985 to a high of 25 per 1000 in 2002/2003. It has since subsided to just under 22 per 1000 (estimate for 2007) a little below the birth rate of around 27 per 1000.[1][2]
The high death rate is a result of poor medical facilities. This leads to a small natural increase of around 0.5%. Deaths due to HIV/AIDS have reduced due to improved methods of protection. However, outward migration rates of around 1.5% or more have been experienced for over a decade, therefore actual population changes are uncertain. Because of the high number of unaccounted emigrants, the recent increase of emigration and the death toll from AIDS, the total population might be declining to as low as 8 million according to some estimates.[3]
Census data
Historical data of Southern Rhodesia
| Year | Black | White | Coloured | Asian |
|---|---|---|---|---|
| 1911 | 744,558 | 23,606 | 2,912 | |
| 1921 | 862,319 | 33,620 | 1,998 | 1,250 |
| Year | Black | White |
|---|---|---|
| 1890 | 700,000 | |
| 1910 | 900,000 | 20,000 |
| 1927 | 922,000 | 38,200 |
| 1930 | 1,300,000 | |
| 1945 | 1,400,000? | 140,000 |
| 1946 | 1,640,000 | 80,500 |
Current estimates
Based on the 2019 revision of the World Population Prospects[4][5], the population of Zimbabwe was estimated by the United Nations at 14,438,802 in 2018. About 38.9% comprised youths under 15, while another 56.9% grouped persons aged between 15 and 65 years. Only around 4.2% of citizens were apparently over 65.[6]
| Total population | Population aged 0–14 (%) | Population aged 15–64 (%) | Population aged 65+ (%) | |
|---|---|---|---|---|
| 1950 | 2 747 000 | 42.0 | 54.8 | 3.2 |
| 1955 | 3 204 000 | 43.8 | 52.9 | 3.3 |
| 1960 | 3 752 000 | 45.3 | 51.4 | 3.4 |
| 1965 | 4 422 000 | 47.7 | 49.0 | 3.3 |
| 1970 | 5 206 000 | 48.1 | 48.7 | 3.2 |
| 1975 | 6 170 000 | 48.4 | 48.5 | 3.1 |
| 1980 | 7 289 000 | 48.9 | 48.1 | 3.0 |
| 1985 | 8 855 000 | 47.9 | 49.1 | 3.0 |
| 1990 | 10 469 000 | 46.1 | 50.9 | 3.0 |
| 1995 | 11 685 000 | 44.3 | 52.5 | 3.2 |
| 2000 | 12 509 000 | 41.7 | 54.9 | 3.4 |
| 2005 | 12 710 000 | 40.1 | 56.1 | 3.8 |
| 2010 | 13 080 000 | 38.9 | 56.9 | 4.2 |
Vital statistics
Registration of vital events in Zimbabwe is not complete. The Population Department of the United Nations prepared the following estimates. [6]
| Period | Live births per year | Deaths per year | Natural change per year | CBR* | CDR* | NC* | TFR* | IMR* |
|---|---|---|---|---|---|---|---|---|
| 1950-1955 | 144 000 | 52 000 | 92 000 | 48.3 | 17.4 | 30.9 | 6.80 | 115 |
| 1955-1960 | 167 000 | 56 000 | 111 000 | 48.1 | 16.2 | 31.8 | 7.00 | 105 |
| 1960-1965 | 197 000 | 61 000 | 136 000 | 48.2 | 15.0 | 33.3 | 7.30 | 97 |
| 1965-1970 | 229 000 | 66 000 | 162 000 | 47.5 | 13.7 | 33.7 | 7.40 | 90 |
| 1970-1975 | 271 000 | 72 000 | 199 000 | 47.6 | 12.6 | 35.0 | 7.40 | 83 |
| 1975-1980 | 320 000 | 76 000 | 244 000 | 47.6 | 11.3 | 36.3 | 7.30 | 74 |
| 1980-1985 | 363 000 | 78 000 | 285 000 | 44.9 | 9.6 | 35.3 | 6.74 | 64 |
| 1985-1990 | 381 000 | 83 000 | 299 000 | 39.5 | 8.6 | 30.9 | 5.66 | 56 |
| 1990-1995 | 390 000 | 108 000 | 281 000 | 35.2 | 9.8 | 25.4 | 4.77 | 55 |
| 1995-2000 | 381 000 | 176 000 | 205 000 | 31.5 | 14.5 | 16.9 | 4.05 | 65 |
| 2000-2005 | 372 000 | 220 000 | 152 000 | 29.7 | 17.5 | 12.1 | 3.74 | 68 |
| 2005-2010 | 370 000 | 190 000 | 180 000 | 29.4 | 15.1 | 14.3 | 3.47 | 59 |
| * CBR = crude birth rate (per 1000); CDR = crude death rate (per 1000); NC = natural change (per 1000); IMR = infant mortality rate per 1000 births; TFR = total fertility rate (number of children per woman) | ||||||||
Fertility and births
Total Fertility Rate (TFR) (Wanted Fertility Rate) and Crude Birth Rate (CBR):[7][8]
| Year | CBR (Total) | TFR (Total) | CBR (Urban) | TFR (Urban) | CBR (Rural) | TFR (Rural) |
|---|---|---|---|---|---|---|
| 1982-1984 | 6.66 | 5.33 | 7.28 | |||
| 1985-1988 | 5.31 | 3.86 | 6.06 | |||
| 1994 | 31.6 | 4.29 (3.5) | 30.5 | 3.09 (2.6) | 32.0 | 4.85 (3.9) |
| 1999 | 30.8 | 3.96 (3.4) | 31.3 | 2.96 (2.6) | 30.5 | 4.57 (3.8) |
| 2005-2006 | 31.0 | 3.8 (3.3) | 28.5 | 2.6 (2.3) | 32.0 | 4.6 (3.9) |
| 2010-2011 | 34 | 4.1 (3.4) | 34 | 3.1 (2.7) | 34 | 4.8 (4.0) |
| 2015 | 32.0 | 4.0 (3.6) | 31.1 | 3.0 (2.7) | 32.7 | 4.7 (4.1) |
Fertility data as of 2010-2011 (DHS Program):[9]
| Province | Total fertility rate | Percentage of women age 15-49 currently pregnant | Mean number of children ever born to women age 40-49 |
|---|---|---|---|
| Manicaland | 4.8 | 8.8 | 4.9 |
| Mashonaland Central | 4.5 | 9.1 | 5.0 |
| Mashonaland East | 4.5 | 7.3 | 4.2 |
| Mashonaland West | 4.5 | 8.5 | 5.0 |
| Matabeleland North | 4.1 | 7.7 | 5.2 |
| Matabeleland South | 4.2 | 6.6 | 4.6 |
| Midlands | 4.2 | 7.6 | 4.8 |
| Masvingo | 4.7 | 11.1 | 4.6 |
| Harare | 3.1 | 8.4 | 3.5 |
| Bulawayo | 2.8 | 4.8 | 3.2 |
Life expectancy at birth
Life expectancy from 1950 to 2015 (UN World Population Prospects)[10]:
| Period | Life expectancy in Years |
|---|---|
| 1950–1955 | 48.54 |
| 1955–1960 | |
| 1960–1965 | |
| 1965–1970 | |
| 1970–1975 | |
| 1975–1980 | |
| 1980–1985 | |
| 1985–1990 | |
| 1990–1995 | |
| 1995–2000 | |
| 2000–2005 | |
| 2005–2010 | |
| 2010–2015 |
Ethnic groups
According to 2012 Census report, 99.6% of the population is of African origin.[11] Of the rest of the population, the great bulk—perhaps 30,000 persons[12][13][14]—are white Zimbabweans of European ancestry, a minority which had diminished in size prior to independence.[15]
The vast black majority has grown at a projected annual rate of 4.3% since 1980.[16] Although present figures are difficult to ascertain, the white community once reproduced itself at an annual rate (under 1.5%) similar to that of most totals in developed nations.[17] Of the two major ethnolinguistic categories, Shona speakers formed a decisive plurality and occupied the eastern two-thirds of Zimbabwe.[18] Ndebele speakers constitute about 16%, and none of the other indigenous ethnic groups came to as much as 2% in recent decades.[19] African speakers of nonindigenous languages included migrant workers from Malawi, Zambia, and Mozambique.[20]
Three-quarters of white Zimbabweans are of British or British diasporan origin; at various times many emigrated from South Africa and elsewhere.[17] After World War II, Zimbabwe (then Southern Rhodesia) received a substantial influx of emigrants from the United Kingdom—a handful previously resided in other colonies such as Pakistan and Kenya. Also represented on a much smaller scale were individuals of Afrikaner, Greek, and Portuguese origin.[15] After Rhodesia's Unilateral Declaration of Independence in 1965, Ian Smith's administration removed technical obstacles to immigration from southern Europe.[17]
A heavily urbanised Coloured population is descended, partially, from early unions between White Rhodesian settlers and local Black African females. Many, however, can also trace their ancestry to the Dutch/Khoisan mulatto clans of the Cape.
With the exception of a select few who were brought to Zimbabwe as railroad workers, most Asians in Zimbabwe arrived from India pursuing employment or entrepreneurship. An educated class, they have traditionally engaged in retail trade or manufacturing.[17]
Languages
Zimbabwe has 16 official languages: Chewa, Tonga, Chibarwe, English, Kalanga, Koisan, Nambya, Ndau, Ndebele, Shangani, Shona, sign language, Sotho, Tonga, Tswana, Venda, Xhosa.[21] English is widely used in administration, law and schools, though less than 2.5%, mainly the white and Coloured (mixed race) minorities, consider it their native language. The rest of the population speak Shona (70%) and Ndebele (20%), Kalanga (2%), etc.[22] Shona has a rich oral tradition, which was incorporated into the first Shona novel, Feso by Solomon Mutswairo, published in 1956.[23] English is spoken primarily in the cities, but less so in rural areas. Television news is broadcast in English, Shona and Ndebele though the local languages time slot falls out of prime viewing time, but radio broadcasts in English, Ndebele, Shona, Kalanga, Nambya, Venda, Suthu and Tonga. English, Ndebele and Shona are given far more airtime.
Religions
85 percent of Zimbabweans are Christian, and of that number, 61 percent regularly attend Christian churches.[24] The largest Christian churches are Anglican, Roman Catholic, Seventh Day Adventist and Methodist. However like most former European colonies, Christianity is often mixed with enduring traditional beliefs. Besides Christianity, ancestral worship (Amadlozi) is the most practised non-Christian religion which involves ancestor worship and spiritual intercession. Under 1% of the population is Muslim, although many Zimbabweans are influenced by Islamic food laws.
Health
According to the United Nations World Health Organization, the average life expectancy for men in 2006 was 37 years and for women was 34 years of age, the lowest in the world at the time.[25] An association of doctors in Zimbabwe have made calls for President Mugabe to make moves to assist the ailing health service.[26] Since then it has recovered, and the figures for 2010 to 2015 were 53 and 54 for men and women respectively.[27]
Other demographic statistics
The following demographic statistics of Zimbabwe in 2019 are from the World Population Review.[28]
- One birth every 59 seconds
- One death every 4 minutes
- One net migrant every 27 minutes
- Net gain of one person every 1 minute
The following demographic statistics are from the CIA World Factbook, unless otherwise indicated.[29]
Ethnic groups [30]
- African 99.4% (predominantly Shona; Ndebele is the second largest ethnic group)
- Other 0.4%
- Unspecified 0.2% (2012 est.)
Languages[30]
- Shona (official; most widely spoken), Ndebele (official, second most widely spoken), English (official; traditionally used for official business), 13 minority languages (official; includes Chewa, Chibarwe, Kalanga, Koisan, Nambya, Ndau, Shangani, sign language, Sotho, Tonga, Tswana, Venda, and Xhosa)
Religions[30]
Protestant 74.8% (includes Apostolic 37.5%, Pentecostal 21.8%, other 15.5%), Roman Catholic 7.3%, other Christian 5.3%, traditional 1.5%, Muslim 0.5%, other 0.1%, none 10.5% (2015 est.)
Population
- 14,030,368 (July 2018 est.)
- 13,805,084 (July 2017 est.)
Age structure

- 0-14 years: 38.62% (male 2,681,192 /female 2,736,876)
- 15-24 years: 20.42% (male 1,403,715 /female 1,461,168)
- 25-54 years: 32.22% (male 2,286,915 /female 2,234,158)
- 55-64 years: 4.24% (male 233,021 /female 361,759)
- 65 years and over: 4.5% (male 255,704 /female 375,860) (2018 est.)
Median age
- total: 20.2 years. Country comparison to the world: 190th
- male: 19.9 years
- female: 20.4 years (2018 est.)
Birth rate
- 34 births/1,000 population (2018 est.) Country comparison to the world: 25th
- 34.2 births/1,000 population (2017 est.)
Death rate
- 9.9 deaths/1,000 population (2018 est.) Country comparison to the world: 41st
- 10.2 deaths/1,000 population (2017 est.)
Total fertility rate
- 3.97 children born/woman (2018 est.) Country comparison to the world: 33rd
Population growth rate
- 1.68% (2018 est.) Country comparison to the world: 60th
- 1.56% (2017 est.)
Mother's mean age at first birth
- 20 years (2015 est.)
- note: median age at first birth among women 25-29
Contraceptive prevalence rate
- 66.8% (2015)
Net migration rate
- -7.3 migrant(s)/1,000 population (2018 est.) Country comparison to the world: 208th
- -8.5 migrants/1,000 population (2017).There is an increasing flow of Zimbabweans into South Africa and Botswana in search of better economic opportunities.
Dependency ratios
- total dependency ratio: 79.5 (2015 est.)
- youth dependency ratio: 74.4 (2015 est.)
- elderly dependency ratio: 5.1 (2015 est.)
- potential support ratio: 19.7 (2015 est.)
Urbanization
- urban population: 32.2% of total population (2018)
- rate of urbanization: 2.19% annual rate of change (2015-20 est.)
Sex ratio
(2011 est.)
- at birth: 1.03 male(s)/female
- under 15 years: 1.02 male(s)/female
- 15-64 years: 0.92 male(s)/female
- 65 years and over: 0.70 male(s)/female
- total population: 0.95 male(s)/female
AIDS
- Adult prevalence rate
- 13.3% (2017 est.)
- 15.3% (2007)
- 33.7% (2001 est.)
- 25% (1999 estimate).
- People living with HIV/AIDS
- 1.3 million (2017 est.)
- 1.3 million (2007 est.)
- 2.3 million (2001 est.)
- Deaths
- 22,000 (2017 est.)
- 140,000 (2007 est.)
- 200,000 (2001 est.)
- 160,000 annually (1999 estimate).
Life expectancy at birth
- total population: 61.1 years
- male
- 59 years
- female: 63.2 years (2018 est.)
- total population 60.4 years
- male 58.3 years
- female 62.5 years (2017 est.)
total population 47.55 years male 47.98 years female 47.11 years (2010 est.)
Physicians density
- 0.08 physicians/1,000 population (2014)
Hospital bed density
- 1.7 beds/1,000 population (2011)
Obesity - adult prevalence rate
- 15.5% (2015)
Children under the age of 5 years underweight
- 8.4% (2015)
Education expenditures
- 7.5% of GDP (2014) Country comparison to the world: 10th
Literacy
definition* age 15 and over can read and write English
- total population: 86.5%
- male: 88.5%
- female: 84.6% (2015 est.)
- total population* 90.7% (2003 est.), 85% (2000 est.)
- male* 94.2% (2003 est.), 90% (2000 est.)
- female* 87.2% (2003 est.), 80% (1995 est.)
School life expectancy (primary to tertiary education)
Basic Education: Primary and Secondary school: 12 years Primary to High School (Including A-Level): 14 Years Primary to Tertiary (inc 4-year college degree) 18 Years
Unemployment, youth ages 15-24
- total: 16.5%
- male: 11.7%
- female: 21.1% (2014 est.)
Nationality
- noun: Zimbabwean(s)
- adjective: Zimbabwean
References
| Wikimedia Commons has media related to Demographics of Zimbabwe. |
- Statesman's Yearbook 2007, Palgrave Macmillan, New York
- CIA Factbook 2007, CIA Publications, Washington D.C.
- "The Independent".
- ""World Population prospects – Population division"". population.un.org. United Nations Department of Economic and Social Affairs, Population Division. Retrieved November 9, 2019.
- ""Overall total population" – World Population Prospects: The 2019 Revision" (xslx). population.un.org (custom data acquired via website). United Nations Department of Economic and Social Affairs, Population Division. Retrieved November 9, 2019.
- "World Population Prospects, the 2012 Revision". United Nations. Archived from the original on 2011-05-06.
- "Cambodia - Demographic and Health Survey 2010". Worldbank.org. Retrieved 2017-08-27.
- "National Health Survey 1958" (PDF). Dhsprogram.com. Retrieved 2017-08-27.
- "Zimbabwe Demographic and Health Survey : 2010-11" (PDF). Dhsprogram.com. Retrieved 2017-08-27.
- "World Population Prospects – Population Division – United Nations". Retrieved 2017-07-15.
- "Archived copy" (PDF). Archived from the original (PDF) on 2014-09-01. Retrieved 2015-02-16.CS1 maint: archived copy as title (link)
- "Zimbabwe's only white minster [sic] says insults against whites continue at top government level". Fox News. 2015-03-26.
- United Nations High Commissioner for Refugees. "Refworld - Zimbabwe: Dual citizenship". Refworld.
- "Teens assaulted in police raid on nightclub". newzimbabwe.com. Archived from the original on 2012-08-19.
- Raeburn, Michael. We are everywhere: Narratives from Rhodesian guerillas. pp. 1–209.
- "Zimbabwe Population growth rate". indexmundi.com.
- Nelson, Harold. Zimbabwe: A Country Study. pp. 80–137.
- "The People of Zimbabwe". Archived from the original on 2007-07-12. Retrieved 2007-11-13.
- Famighetti, Robert. The World Almanac and Book of Facts, 1996. p. 837.
- "The Land Act's Losers". postcolonialweb.org.
- The following languages, namely Chewa, Chibarwe, English, Kalanga, Koisan, Nambya, Ndau, Ndebele, Shangani, Shona, sign language, Sotho, Tonga, Tswana, Venda and Xhosa, are the officially recognised languages of Zimbabwe. (CONSTITUTION OF ZIMBABWE (final draft) Archived 2013-10-02 at the Wayback Machine).
- "Archived copy" (PDF). Archived from the original (PDF) on 2009-03-25. Retrieved 2016-06-01.CS1 maint: archived copy as title (link)
- Mother Tongue: Interviews with Musaemura B. Zimunya and Solomon Mutswairo University of North Carolina at Chapel Hill
- "MSN Encarta". Archived from the original on 2009-10-31. Retrieved 2007-11-13.
- The World Health Organization. "Annex Table 1 - Basic indicators for all Member States" (PDF). The World Health Report 2006.
- Peta Thornycroft (2006-04-10). "In Zimbabwe, life ends before 40". Sydney Morning Herald. Harare. Retrieved 2006-04-10.
- "United Nations Statistics Division". Retrieved 17 January 2015.
- "Zimbabwe Population 2019", World Population Review, June 6, 2018
- Uganda: People, CIA World Factbook, 2018

- "Africa :: ZIMBABWE". CIA The World Factbook.
- "Archived copy" (PDF). Archived from the original (PDF) on 2015-04-02. Retrieved 2014-01-27.CS1 maint: archived copy as title (link)
- "Archived copy" (PDF). Archived from the original (PDF) on 2015-04-02. Retrieved 2014-01-27.CS1 maint: archived copy as title (link)
![]()