Demographics of Dominica
This article is about the demographic features of the population of Dominica, including population density, ethnicity, religious affiliations and other aspects of the population.
| Census population and average annual growth rate | ||
|---|---|---|
| Year | Pop. | ±% p.a. |
| 1871 | 27,178 | — |
| 1881 | 28,211 | +0.37% |
| 1891 | 26,841 | −0.50% |
| 1901 | 28,894 | +0.74% |
| 1911 | 33,863 | +1.60% |
| 1921 | 37,059 | +0.91% |
| 1946 | 47,624 | +1.01% |
| 1960 | 59,916 | +1.65% |
| 1970 | 69,549 | +1.50% |
| 1981 | 73,795 | +0.54% |
| 1991 | 71,183 | −0.36% |
| 2001 | 71,242 | +0.01% |
| 2011 | 71,293 | +0.01% |
| 2018[1][2] | 71,625 | +0.07% |
| Source:[3] | ||
Population
According to the preliminary 2011 census results Dominica has a population of 71,293.[3] The population growth rate is very low, due primarily to emigration to more prosperous Caribbean Islands, the United Kingdom, the United States, Canada, and Australia. The estimated mid-year population of 2018 is 71,625 (the 2019 revision of the World Population Prospects[1][2]).
Population by parishes
| Name | Population | Percentage of national population | Total area (km²) | Population density |
|---|---|---|---|---|
| Saint Andrew | 10,461 | 14.77% | 178.27 | 59 |
| Saint David | 6,789 | 9.58% | 131.6 | 52 |
| Saint George | 20,211 | 28.54% | 56.1 | 360 |
| Saint John | 5,897 | 8.33% | 59 | 100 |
| Saint Joseph | 5,765 | 8.14% | 120.1 | 48 |
| Saint Luke | 1,576 | 2.22% | 7.77 | 203 |
| Saint Mark | 1,891 | 2.67% | 9.9 | 191 |
| Saint Patrick | 8,383 | 11.84% | 84.4 | 99 |
| Saint Paul | 8,397 | 11.86% | 67.4 | 125 |
| Saint Peter | 1,452 | 2.05% | 27.7 | 52 |
| 70,822 | 100% | 742.24 | 105 |
Vital statistics
| Average population (x 1000) | Live births | Deaths | Natural change | Crude birth rate (per 1000) | Crude death rate (per 1000) | Natural change (per 1000) | Total fertility rate | Infant mortality rate | |
|---|---|---|---|---|---|---|---|---|---|
| 1950 | 51 | 1 848 | 948 | 900 | 36.2 | 18.6 | 17.6 | ||
| 1951 | 52 | 1 965 | 874 | 1 091 | 38.0 | 16.9 | 21.1 | ||
| 1952 | 52 | 2 091 | 1 108 | 983 | 40.0 | 21.2 | 18.8 | ||
| 1953 | 53 | 2 080 | 779 | 1 301 | 39.3 | 14.7 | 24.6 | ||
| 1954 | 54 | 2 345 | 759 | 1 586 | 43.7 | 14.1 | 29.5 | ||
| 1955 | 55 | 2 543 | 870 | 1 673 | 46.6 | 15.9 | 30.7 | ||
| 1956 | 56 | 2 416 | 927 | 1 489 | 43.5 | 16.7 | 26.8 | ||
| 1957 | 57 | 2 557 | 870 | 1 687 | 45.2 | 15.4 | 29.8 | ||
| 1958 | 58 | 2 724 | 929 | 1 795 | 47.1 | 16.1 | 31.1 | ||
| 1959 | 59 | 2 770 | 826 | 1 944 | 47.0 | 14.0 | 33.0 | ||
| 1960 | 60 | 2 812 | 922 | 1 890 | 46.9 | 15.4 | 31.5 | ||
| 1961 | 61 | 2 655 | 799 | 1 856 | 43.5 | 13.1 | 30.4 | ||
| 1962 | 62 | 2 566 | 658 | 1 908 | 41.4 | 10.6 | 30.8 | ||
| 1963 | 63 | 2 493 | 835 | 1 658 | 39.6 | 13.3 | 26.4 | ||
| 1964 | 64 | 2 703 | 606 | 2 097 | 42.3 | 9.5 | 32.8 | ||
| 1965 | 65 | 2 820 | 584 | 2 236 | 43.4 | 9.0 | 34.4 | ||
| 1966 | 66 | 2 639 | 556 | 2 083 | 39.8 | 8.4 | 31.4 | ||
| 1967 | 68 | 2 934 | 516 | 2 418 | 43.3 | 7.6 | 35.7 | ||
| 1968 | 69 | 2 686 | 626 | 2 060 | 38.9 | 9.1 | 29.8 | ||
| 1969 | 70 | 2 694 | 744 | 1 950 | 38.4 | 10.6 | 27.8 | ||
| 1970 | 71 | 2 503 | 583 | 1 920 | 35.2 | 8.2 | 27.0 | ||
| 1971 | 72 | 2 677 | 664 | 2 013 | 37.4 | 9.3 | 28.1 | ||
| 1972 | 72 | 2 591 | 543 | 2 048 | 36.1 | 7.6 | 28.5 | ||
| 1973 | 72 | 2 298 | 505 | 1 793 | 32.0 | 7.0 | 25.0 | ||
| 1974 | 72 | 2 062 | 511 | 1 551 | 28.7 | 7.1 | 21.6 | ||
| 1975 | 72 | 1 783 | 483 | 1 300 | 24.7 | 6.7 | 18.0 | ||
| 1976 | 73 | 1 758 | 532 | 1 226 | 24.2 | 7.3 | 16.9 | ||
| 1977 | 73 | 1 745 | 521 | 1 224 | 23.8 | 7.1 | 16.7 | ||
| 1978 | 74 | 1 735 | 417 | 1 318 | 23.4 | 5.6 | 17.8 | ||
| 1979 | 75 | 1 521 | 304 | 1 217 | 20.3 | 4.1 | 16.2 | ||
| 1980 | 75 | 1 819 | 387 | 1 432 | 24.2 | 5.1 | 19.0 | ||
| 1981 | 75 | 1 661 | 338 | 1 323 | 22.0 | 4.5 | 17.6 | ||
| 1982 | 75 | 1 753 | 412 | 1 341 | 23.3 | 5.5 | 17.8 | ||
| 1983 | 75 | 1 864 | 349 | 1 515 | 24.9 | 4.7 | 20.3 | ||
| 1984 | 74 | 1 716 | 432 | 1 284 | 23.1 | 5.8 | 17.3 | ||
| 1985 | 74 | 1 703 | 466 | 1 237 | 23.1 | 6.3 | 16.8 | ||
| 1986 | 73 | 1 721 | 488 | 1 233 | 23.6 | 6.7 | 16.9 | ||
| 1987 | 72 | 1 621 | 455 | 1 166 | 22.4 | 6.3 | 16.1 | ||
| 1988 | 72 | 1 731 | 424 | 1 307 | 24.1 | 5.9 | 18.2 | ||
| 1989 | 71 | 1 657 | 497 | 1 160 | 23.3 | 7.0 | 16.3 | ||
| 1990 | 71 | 1 604 | 512 | 1 092 | 22.6 | 7.2 | 15.4 | ||
| 1991 | 71 | 1 712 | 518 | 1 194 | 24.2 | 7.3 | 16.9 | ||
| 1992 | 71 | 1 836 | 566 | 1 270 | 25.9 | 8.0 | 17.9 | ||
| 1993 | 71 | 1 757 | 558 | 1 199 | 24.7 | 7.8 | 16.8 | ||
| 1994 | 71 | 1 605 | 530 | 1 075 | 22.5 | 7.4 | 15.1 | ||
| 1995 | 71 | 1 501 | 584 | 917 | 21.0 | 8.2 | 12.8 | ||
| 1996 | 71 | 1 426 | 583 | 843 | 20.0 | 8.2 | 11.8 | ||
| 1997 | 71 | 1 340 | 513 | 827 | 18.9 | 7.3 | 11.7 | ||
| 1998 | 70 | 1 236 | 595 | 641 | 17.6 | 8.5 | 9.1 | ||
| 1999 | 70 | 1 291 | 631 | 660 | 18.5 | 9.0 | 9.4 | ||
| 2000 | 70 | 1 199 | 503 | 696 | 17.2 | 7.2 | 10.0 | 1.75 | |
| 2001 | 70 | 1 213 | 510 | 703 | 17.4 | 7.3 | 10.1 | 1.77 | |
| 2002 | 70 | 1 081 | 594 | 487 | 15.5 | 8.5 | 7.0 | 1.74 | |
| 2003 | 70 | 1 056 | 557 | 499 | 15.1 | 8.0 | 7.1 | 1.69 | |
| 2004 | 70 | 1 066 | 557 | 509 | 15.2 | 7.9 | 7.2 | 1.67 | |
| 2005 | 70.564 | 1 009 | 489 | 520 | 14.6 | 6.9 | 7.7 | 1.64 | 20.8 |
| 2006 | 70.693 | 1 035 | 538 | 497 | 12.8 | 7.6 | 5.2 | 1.65 | 12.6 |
| 2007 | 70.729 | 904 | 567 | 337 | 13.6 | 8.0 | 5.6 | 1.57 | 19.9 |
| 2008 | 70.726 | 964 | 545 | 419 | 13.4 | 7.7 | 5.7 | 1.61 | 10.4 |
| 2009 | 70.747 | 943 | 559 | 384 | 13.4 | 7.9 | 5.5 | 1.58 | 22.3 |
| 2010 | 70.730 | 933 | 579 | 354 | 13.2 | 8.2 | 5.0 | 1.56 | 13.9 |
| 2011 | 70.755 | 944 | 592 | 352 | 13.3 | 8.4 | 4.9 | 1.55 | 29.7 |
| 2012 | 71.042 | 951 | 603 | 348 | 13.4 | 8.5 | 4.9 | 1.56 | 16.8 |
| 2013 | 71.221 | 931 | 630 | 301 | 13.1 | 8.8 | 4.3 | 1.53 | 22.6 |
| 2014 | 71.575 | 858 | 590 | 268 | 12.0 | 8.2 | 3.8 | 1.46 | 19.8 |
| 2015 | |||||||||
| 2016 | |||||||||
| 2017 | 647 | 686 | -39 | 9.6 | 9.6 | -0.0 |
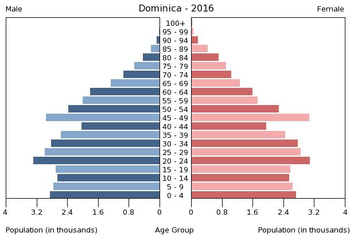
Structure of the population
Structure of the population (31.12.2006) (Estimates) :
| Age Group | Male | Female | Total | % |
|---|---|---|---|---|
| Total | 36 238 | 34 942 | 71 180 | 100 |
| 0-4 | 3 250 | 3 067 | 6 317 | 8,87 |
| 5-9 | 3 951 | 3 603 | 7 554 | 10,61 |
| 10-14 | 3 558 | 3 547 | 7 105 | 9,98 |
| 15-19 | 3 452 | 3 366 | 6 818 | 9,58 |
| 20-24 | 2 438 | 2 140 | 4 578 | 6,43 |
| 25-29 | 2 601 | 2 520 | 5 121 | 7,19 |
| 30-34 | 2 886 | 2 777 | 5 663 | 7,96 |
| 35-39 | 2 841 | 2 455 | 5 296 | 7,44 |
| 40-44 | 2 417 | 2 059 | 4 476 | 6,29 |
| 45-49 | 1 947 | 1 614 | 3 561 | 5,00 |
| 50-54 | 1 467 | 1 353 | 2 820 | 3,96 |
| 55-59 | 1 209 | 1 182 | 2 391 | 3,36 |
| 60-64 | 1 022 | 1 233 | 2 255 | 3,17 |
| 65-69 | 1 091 | 1 233 | 2 324 | 3,26 |
| 70-74 | 871 | 973 | 1 844 | 2,59 |
| 75-79 | 596 | 736 | 1 332 | 1,87 |
| 80-84 | 354 | 547 | 901 | 1,27 |
| 85+ | 288 | 537 | 825 | 1,16 |
| Age group | Male | Female | Total | Percent |
|---|---|---|---|---|
| 0-14 | 10 759 | 10 217 | 20 976 | 29,47 |
| 15-64 | 22 279 | 20 699 | 42 978 | 60,38 |
| 65+ | 3 200 | 4 026 | 7 226 | 10,15 |
Ethnic groups
The vast majority of Dominicans are of African descent (75% at the 2014 census).[7] There is a significant mixed population (19%) at the 2014 census due to intermarriage, along with a small European origin minority (0.8%; descendants of French, British, and Irish colonists), East Indians (0.1%) groups, and there are small numbers of Lebanese/Syrians (0.1%) and Asians.
Amerindians
Dominica is the only Eastern Caribbean island that still has a population of pre-Columbian native Caribs (also known as Kalinago), who were exterminated, driven from neighbouring islands, or mixed with Africans and/or Europeans. According to the 2001 census there are only 2,001 Caribs remaining (2.9% of the total population). A considerable growth occurred since the 1991 census when 1,634 Caribs were counted (2.4% of the total population). The Caribs live in eight villages on the east coast of Dominica. This special Carib Territory was granted by the British Crown in 1903.[8] The present number of Kalinago is estimated at 4% more than 3,000.
Other demographic statistics
Demographic statistics according to the CIA World Factbook, unless otherwise indicated.[9]
- Nationality
- noun: Dominican(s)
- adjective: Dominican
- Population
- 74,027 (July 2018 est.)
- Ethnic groups
- African descent 86.6%, mixed 9.1%, indigenous 2.9%, other 1.3%, unspecified 0.2% (2001 est.)
- People - note: 3,000-3,500 Kalinago (Carib) still living on Dominica are the only pre-Columbian population remaining in the Caribbean; only 70-100 may be "pure" Kalinago because of years of integration into the broader population
- Age structure
- 0-14 years: 21.62% (male 8,187 /female 7,815)
- 15-24 years: 14.37% (male 5,473 /female 5,167)
- 25-54 years: 42.59% (male 15,985 /female 15,541)
- 55-64 years: 9.99% (male 3,927 /female 3,470)
- 65 years and over: 11.43% (male 3,814 /female 4,648) (2018 est.)
- Median age
- total: 34 years. Country comparison to the world: 88th
- male: 33.5 years
- female: 34.5 years (2018 est.)
- Birth rate
- 15 births/1,000 population (2018 est.) Country comparison to the world: 125th
- Death rate
- 7.9 deaths/1,000 population (2018 est.) Country comparison to the world: 92nd
- Total fertility rate
- 2.03 children born/woman (2018 est.) Country comparison to the world: 114th
- Net migration rate
- -5.4 migrant(s)/1,000 population (2018 est.) Country comparison to the world: 196th
- Population growth rate
- 0.17% (2018 est.) Country comparison to the world: 182nd
- Languages
- English (official), French patois
- Religions
- Roman Catholic 61.4%, Protestant 28.6% (includes Evangelical 6.7%, Seventh Day Adventist 6.1%, Pentecostal 5.6%, Baptist 4.1%, Methodist 3.7%, Church of God 1.2%, other 1.2%), Rastafarian 1.3%, Jehovah's Witness 1.2%, other 0.3%, none 6.1%, unspecified 1.1% (2001 est.)
- Life expectancy at birth
- total population: 77.4 years
- male: 74.4 years
- female: 80.5 years (2018 est.)
- Urbanization
- urban population: 70.5% of total population (2018)
- rate of urbanization: 0.94% annual rate of change (2015-20 est.)
- Obesity - adult prevalence rate
- 27.9% (2016) Country comparison to the world: 33rd
Languages
English is the official language and universally understood; however, because of historic French domination, Antillean Creole, a French-lexified creole language, is also widely spoken.
Religion
According to the 2001 census, 91.2% percent of the population of Dominica is considered Christian, 1.6% has a non-Christian religion and 6.1% has no religion or did not state a religion (1.1%).[7]
Roughly two thirds of Christians are Roman Catholics (61.4% of the total population), a reflection of early French influence on the island, and one third are Protestant. The Evangelicals constitute the largest Protestant group, with 6.7% of the population. Seventh-day Adventists are the second largest group (6.1%). The next largest group are Pentecostals (5.6% of the population), followed by Baptists (4.1%). Other Christians include Methodists (3.7%), Church of God (1.2%), Jehovah's Witnesses (1.2%), Anglicanism (0.6%) and Brethren Christian (0.3%). During the past decades the number of Roman Catholics and Anglicans has decreased, while the number of other Protestants has increased, especially Evangelicals, Seventh-day Adventists, Pentecostals (5.6% of the population) and Baptists).[7]
The number of non-Christians is small. These religious groups include the Rastafarian Movement (1.3% of the population), Hinduism (0.1%) and Muslims (0.2%).
References
- ""World Population prospects – Population division"". population.un.org. United Nations Department of Economic and Social Affairs, Population Division. Retrieved November 9, 2019.
- ""Overall total population" – World Population Prospects: The 2019 Revision" (xslx). population.un.org (custom data acquired via website). United Nations Department of Economic and Social Affairs, Population Division. Retrieved November 9, 2019.
- "2011 POPULATION AND HOUSING CENSUS" (PDF). Dominica.gov.dm. Retrieved 29 August 2017.
- "United Nations. Demographic Yearbooks". Unstats.un.org. Retrieved 29 August 2017.
- "DEMOGRAPHIC PROFILE: DOMINICA" (PDF). Caricomstats.org. Retrieved 29 August 2017.
- "United Nations Statistics Division - Demographic and Social Statistics". Unstats.un.org. Retrieved 29 August 2017.
- "DOMINICA NATIONAL CENSUS REPORT 2000 ROUND OF POPULATION AND HOUSING CENSUS SUB-PROJECT" (PDF). Caricomstats.org. Retrieved 29 August 2017.
- "The Carib Indians". Avirtualdominica.com. Retrieved 2010-06-27.
- "World Factbook CENTRAL AMERICA : DOMINICA", The World Factbook, July 12, 2018
