Demographics of Burkina Faso
This article is about the demographic features of the population of Burkina Faso, including population density, ethnicity, education level, health of the populace, economic status, religious affiliations and other aspects of the population.

Burkina Faso's 19.8 million people belong to two major West African cultural groups—the Gur (Voltaic) and the Mandé. The Voltaic are far more numerous and include the Mossi, who make up about one-half of the population. The Mossi claim descent from warriors who migrated to present-day Burkina Faso and established an empire that lasted more than 800 years. Predominantly farmers, the Mossi are still bound by the traditions of the Mogho Naba, who hold court in Ouagadougou.
About 12,000 Europeans reside in Burkina Faso, the majority of whom are French.
Most of Burkina Faso's population is concentrated in the south and center of the country, with a population density sometimes exceeding 48 inhabitants per square kilometer (120 inhabitants per square mile). This population density, high for Africa, causes annual migrations of hundreds of thousands of Burkinabé to Ivory Coast and Ghana for seasonal agricultural work. About a third of Burkinabé adhere to traditional African religions. The introduction of Islam to Burkina Faso was initially resisted by the Mossi rulers. Christians, predominantly Roman Catholics, are largely concentrated among the urban elite.
Few Burkinabé have had formal education. Schooling is free but not compulsory, and only about 29% of Burkina's primary school-age children receive a basic education. The University of Ouagadougou, founded in 1974, was the country's first institution of higher education. The Polytechnic University of Bobo-Dioulasso in Bobo-Dioulasso was opened in 1995.
Population
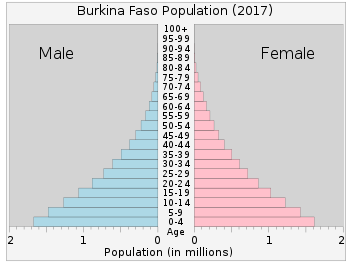
According to the 2019 revision of the World Population Prospects[1][2] the total population was 19,751,466 in 2018, compared to only 4,284,000 in 1950. The proportion of children below the age of 15 in 2010 was 45.3%, 52.4% was between 15 and 65 years of age, while 2.2% was 65 years or older .[3]
| Total population | Population aged 0–14 (%) | Population aged 15–64 (%) | Population aged 65+ (%) | |
|---|---|---|---|---|
| 1950 | 4 284 000 | 40.7 | 57.3 | 2.0 |
| 1955 | 4 535 000 | 40.9 | 56.9 | 2.2 |
| 1960 | 4 882 000 | 41.3 | 56.4 | 2.3 |
| 1965 | 5 284 000 | 41.9 | 55.7 | 2.4 |
| 1970 | 5 807 000 | 43.6 | 53.9 | 2.5 |
| 1975 | 6 435 000 | 44.9 | 52.5 | 2.6 |
| 1980 | 7 212 000 | 46.4 | 50.9 | 2.7 |
| 1985 | 8 170 000 | 47.4 | 49.9 | 2.7 |
| 1990 | 9 324 000 | 47.7 | 49.7 | 2.6 |
| 1995 | 10 692 000 | 47.2 | 50.3 | 2.5 |
| 2000 | 12 294 000 | 46.5 | 51.2 | 2.3 |
| 2005 | 14 198 000 | 45.9 | 51.9 | 2.2 |
| 2010 | 16 469 000 | 45.3 | 52.4 | 2.2 |
Vital statistics
Registration of vital events is in Burkina Faso not complete. The Population Departement of the United Nations prepared the following estimates. [3]
| Period | Live births per year | Deaths per year | Natural change per year | CBR* | CDR* | NC* | TFR* | IMR* |
|---|---|---|---|---|---|---|---|---|
| 1950-1955 | 208 000 | 138 000 | 70 000 | 47.3 | 31.3 | 16.0 | 6.10 | 308 |
| 1955-1960 | 225 000 | 135 000 | 90 000 | 47.7 | 28.6 | 19.1 | 6.24 | 258 |
| 1960-1965 | 243 000 | 134 000 | 109 000 | 47.9 | 26.4 | 21.5 | 6.35 | 217 |
| 1965-1970 | 269 000 | 135 000 | 134 000 | 48.4 | 24.3 | 24.1 | 6.56 | 184 |
| 1970-1975 | 294 000 | 135 000 | 160 000 | 48.1 | 22.0 | 26.1 | 6.70 | 157 |
| 1975-1980 | 335 000 | 136 000 | 199 000 | 49.1 | 20.0 | 29.1 | 7.02 | 136 |
| 1980-1985 | 373 000 | 138 000 | 235 000 | 48.5 | 18.0 | 30.6 | 7.06 | 121 |
| 1985-1990 | 417 000 | 149 000 | 268 000 | 47.7 | 17.1 | 30.6 | 6.94 | 111 |
| 1990-1995 | 469 000 | 165 000 | 304 000 | 46.8 | 16.5 | 30.3 | 6.71 | 101 |
| 1995-2000 | 527 000 | 179 000 | 348 000 | 45.8 | 15.6 | 30.3 | 6.40 | 93 |
| 2000-2005 | 594 000 | 189 000 | 406 000 | 44.9 | 14.2 | 30.6 | 6.14 | 86 |
| 2005-2010 | 672 000 | 193 000 | 479 000 | 43.9 | 12.6 | 31.2 | 5.95 | 79 |
| * CBR = crude birth rate (per 1000); CDR = crude death rate (per 1000); NC = natural change (per 1000); IMR = infant mortality rate per 1000 births; TFR = total fertility rate (number of children per woman) | ||||||||
Fertility and births
Total Fertility Rate (TFR) (Wanted Fertility Rate) and Crude Birth Rate (CBR):[4][5] [6] [7][8]
| Year | CBR (Total) | TFR (Total) | CBR (Urban) | TFR (Urban) | CBR (Rural) | TFR (Rural) |
|---|---|---|---|---|---|---|
| 1993 | 43.0 | 6.9 (6.0) | 39.0 | 5.0 (3.9) | 43.0 | 7.3 (6.5) |
| 1998-99 | 45.1 | 6.8 (6.0) | 32.6 | 4.1 (3.4) | 47.0 | 7.3 (6.5) |
| 2003 | 42.6 | 6.2 (5.4) | 32.4 | 3.7 (3.2) | 44.5 | 6.9 (6.0) |
| 2010 | 41.2 | 6.0 (5.2) | 33.3 | 3.9 (3.3) | 43.3 | 6.7 (5.9) |
| 2014 | 38.6 | 5.5 | 33.6 | 4.0 | 40.2 | 6.1 |
| 2017-18 | 35.1 | 5.2 | 30.9 | 3.7 | 36.1 | 5.6 |
Fertility data as of 2013 (DHS Program):[9]
| Region | Total fertility rate | Percentage of women age 15-49 currently pregnant | Mean number of children ever born to women age 40-49 |
|---|---|---|---|
| Centre | 3.7 | 6.8 | 5.3 |
| Boucle du Mouhoun | 6.8 | 10.8 | 7.1 |
| Cascades | 6.0 | 10.4 | 7.0 |
| Centre-Est | 6.3 | 8.1 | 6.6 |
| Centre-Nord | 6.7 | 10.7 | 7.1 |
| Centre-Ouest | 6.4 | 10.4 | 7.1 |
| Centre-Sud | 5.6 | 9.4 | 6.8 |
| Est | 7.5 | 15.0 | 7.9 |
| Hauts Bassins | 5.2 | 9.3 | 5.9 |
| Nord | 6.2 | 10.3 | 7.0 |
| Plateau Central | 5.8 | 9.4 | 6.8 |
| Sahel | 7.5 | 12.9 | 7.6 |
| Sud-ouest | 6.4 | 10.8 | 7.1 |
Life expectancy
| Period | Life expectancy in Years[10] |
|---|---|
| 1950–1955 | 30.94 |
| 1955–1960 | |
| 1960–1965 | |
| 1965–1970 | |
| 1970–1975 | |
| 1975–1980 | |
| 1980–1985 | |
| 1985–1990 | |
| 1990–1995 | |
| 1995–2000 | |
| 2000–2005 | |
| 2005–2010 | |
| 2010–2015 |
Other demographic statistics
Demographic statistics according to the World Population Review in 2019.[11]
- One birth every 42 seconds
- One death every 3 minutes
- One net migrant every 21 minutes
- Net gain of one person every 55 seconds
The following demographic statistics are from the CIA World Factbook, unless otherwise indicated.[12]
Demographic profile
Burkina Faso has a young age structure – the result of declining mortality combined with steady high fertility – and continues to experience rapid population growth, which is putting increasing pressure on the country's limited arable land. More than 65% of the population is under the age of 25, and the population is growing at 3% annually. Mortality rates, especially those of infants and children, have decreased because of improved health care, hygiene, and sanitation, but women continue to have an average of almost 6 children. Even if fertility were substantially reduced, today's large cohort entering their reproductive years would sustain high population growth for the foreseeable future. Only about a third of the population is literate and unemployment is widespread, dampening the economic prospects of Burkina Faso's large working-age population.[12]
Population
- 20,107,509 (July 2017 est.)
- Note: estimates for this country explicitly take into account the effects of excess mortality due to AIDS; this can result in lower life expectancy, higher infant mortality and death rates, lower population and growth rates, and changes in the distribution of population by age and sex than would otherwise be expected
Age structure
- 0-14 years: 44.28% (male 4,434,908 /female 4,307,438)
- 15-24 years: 20.19% (male 1,980,755 /female 2,004,763)
- 25-54 years: 28.82% (male 2,639,235 /female 3,051,333)
- 55-64 years: 3.55% (male 304,642 /female 396,072)
- 65 years and over: 3.16% (male 273,031 /female 350,538) (2018 est.)
- 0-14 years: 44.88% (male 4,519,960/female 4,503,937)
- 15-24 years: 20.07% (male 2,024,501/female 2,012,053)
- 25-54 years: 29.42% (male 2,999,941/female 2,915,264)
- 55-64 years: 3.2% (male 284,374/female 359,159)
- 65 years and over: 2.43% (male 181,996/female 306,324) (2017 est.)
Median age
- total: 17.4 years Country comparison to the world: 218th
- male: 16.6 years
- female: 18.2 years (2018 est.)
- Total: 17.3 years
- Male: 17.1 years
- Female: 17.4 years (2017 est.)
Population growth rate
- 2.76% (2018 est.) Country comparison to the world: 12th
- 3% (2017 est.)
Birth rate
- 36.9 births/1,000 population (2018 est.) Country comparison to the world: 14th
Death rate
- 8.7 deaths/1,000 population (2018 est.) Country comparison to the world: 72nd
Net migration rate
- 0 migrant(s)/1,000 population (2017 est.) Country comparison to the world: 76th
Mother's mean age at first birth
- 19.4 years (2010 est.)
- note: median age at first birth among women 25-29
Total fertility rate
- 4.77 children born/woman (2018 est.) Country comparison to the world: 19th
Contraceptive prevalence rate
- 25.4% (2016/17)
Urbanization
- urban population: 29.4% of total population (2018)
- rate of urbanization: 4.99% annual rate of change (2015-20 est.)
Sex ratio
- At birth: 1.03 male(s)/female
- Under 15 years: 1.01 male(s)/female
- 15-64 years: 0.99 male(s)/female
- 65 years and over: 0.65 male(s)/female
- Total population: 0.99 male(s)/female (2009 est.)
Life expectancy at birth
- total population: 61.8 years (2018 est.)
- male: 60.1 years (2018 est.)
- female: 63.6 years (2018 est.)
HIV/AIDS
- Adult prevalence rate: 1.6% (2007 est.)
- People living with HIV/AIDS: 130,000 (2007 est.)
- Deaths: 9,200 (2007 est.)
Major infectious diseases
- Degree of risk: very high
- Food or waterborne diseases: bacterial and protozoal diarrhea, hepatitis A, and typhoid fever
- Vectorborne disease: malaria and yellow fever
- Water contact disease: schistosomiasis
- Respiratory disease: meningococcal meningitis
- Animal contact diseases: rabies (2009)
Nationality
- Noun: Burkinabé (singular and plural)
- Adjective: Burkinabé
Ethnic groups
Religions
Languages
- French[13] (official), native African languages belonging to Sudanic family spoken by 90% of the population [13]
Literacy
- Definition: age 15 and over can read and write
- Total population: 36%
- Male: 43%
- Female: 29.3% (2015 est.)
Slavery
In 2018, an estimated 82,000 people in the country were living under "modern slavery" according to the Global Slavery Index.[14] News reports also indicate that "most child slaves on cocoa farms (Ivory Coast and Ghana) come from Mali and Burkina Faso, two of the poorest nations on Earth. The children, some as young as ten, are sent by their families or trafficked by agents with the promise of money. They are made to work long hours for little or no money."[15]
Education expenditure
- 4.2% of GDP (2015)
References
| Wikimedia Commons has media related to Demographics of Burkina Faso. |
- ""World Population prospects – Population division"". population.un.org. United Nations Department of Economic and Social Affairs, Population Division. Retrieved November 9, 2019.
- ""Overall total population" – World Population Prospects: The 2019 Revision" (xslx). population.un.org (custom data acquired via website). United Nations Department of Economic and Social Affairs, Population Division. Retrieved November 9, 2019.
- "Population Division of the Department of Economic and Social Affairs of the United Nations Secretariat, World Population Prospects: The 2010 Revision". Esa.un.org. Retrieved 2017-08-27.
- "Enquête Démographique et de Santé 1993" (PDF). Dhsprogram.com. Retrieved 2017-08-27.
- "Enquête Démographique et de Santé 1998-99" (PDF). Dhsprogram.com. Retrieved 2017-08-27.
- "Enquête Démographique et de Santé 2003" (PDF). Dhsprogram.com. Retrieved 2017-08-27.
- "Enquête Démographique et de Santé 2010" (PDF). Dhsprogram.com. Retrieved 2017-08-27.
- "STATcompiler". www.statcompiler.com. Retrieved 2020-02-17.
- "Nigeria Demographic and Health Survey 2013" (PDF). Dhsprogram.com. Retrieved 2017-08-27.
- "World Population Prospects - Population Division - United Nations". esa.un.org. Retrieved 2018-08-26.
- "Burkina Faso Population 2019", World Population Review
- "The World FactBook - Burkina Faso", The World Factbook, July 12, 2018

- "Africa :: BURKINA FASO". CIA The World Factbook.
- https://www.globalslaveryindex.org/2018/data/country-data/burkina-faso/
- http://theconversation.com/the-modern-slavery-bill-is-a-start-but-it-wont-guarantee-us-sweeter-chocolate-102765
![]()