Demographics of Peru
This article is about the demographic features of the population of Peru, including population density, ethnicity, education level, the health of the populace, economic status, religious affiliations and other aspects of the population.
.svg.png)
| Historical population | ||
|---|---|---|
| Year | Pop. | ±% |
| 1940 | 7,023,111 | — |
| 1961 | 10,420,357 | +48.4% |
| 1972 | 14,121,564 | +35.5% |
| 1981 | 17,762,231 | +25.8% |
| 1993 | 22,639,443 | +27.5% |
| 2007 | 28,220,764 | +24.7% |
| 2017 | 31,237,385 | +10.7% |
| 2018 Estimate | 32,162,184 | +3.0% |
| 2020 Estimate | 32,950,901 | +2.5% |
| 2025 Estimate | 34,817,495 | +5.7% |
| 2030 Estimate | 36,530,592 | +4.9% |
| 2050 Estimate | 40,373,420 | +10.5% |
| Source: [1][2] | ||
Peru is a multiethnic country, which means that it is home to people of many different historical backgrounds. Therefore, it is a multicultural country as well. Since it is a multiethnic society, Peruvian people usually treat their nationality as a citizenship instead of an ethnicity. The Peruvian census does not contain information about ethnicity so only rough estimates are available.
Population
According to the 2019 revision of the World Population Prospects[3][4] the total population was 31,989,260 in 2018, compared to only 7,728,000 in 1950. The proportion of children below the age of 15 in 2010 was 27.9%, 65.3% were between 15 and 65 years of age, while 6.8% were 65 years or older.[5]
| Total population (x 1000) | Population aged 0–14 (%) | Population aged 15–64 (%) | Population aged 65+ (%) | |
|---|---|---|---|---|
| 1950 | 7728 | 41.6 | 55.0 | 3.5 |
| 1955 | 8787 | 42.1 | 54.5 | 3.4 |
| 1960 | 10062 | 43.0 | 53.6 | 3.5 |
| 1965 | 11608 | 43.9 | 52.5 | 3.5 |
| 1970 | 13341 | 43.8 | 52.6 | 3.5 |
| 1975 | 15230 | 43.1 | 53.3 | 3.6 |
| 1980 | 17359 | 41.8 | 54.5 | 3.7 |
| 1985 | 19545 | 40.3 | 55.9 | 3.8 |
| 1990 | 21827 | 38.5 | 57.5 | 4.0 |
| 1995 | 24039 | 36.3 | 59.3 | 4.4 |
| 2000 | 25915 | 34.3 | 60.8 | 4.9 |
| 2005 | 27610 | 31.6 | 62.8 | 5.6 |
| 2010 | 29374 | 29.3 | 64.5 | 6.2 |
| 2015 | 31115 | 27.9 | 65.3 | 6.8 |
| 2020 | 32950 | 25.7 | 65.4 | 6.7 |
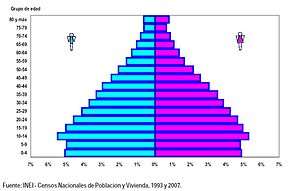
Structure of the population[6]
Structure of the population (01.07.2013) (Estimates based on the 2007 Population Census) :
| Age Group | Male | Female | Total | % |
|---|---|---|---|---|
| Total | 15 271 062 | 15 204 082 | 30 475 144 | 100 |
| 0-4 | 1 480 990 | 1 421 071 | 2 902 061 | 9,52 |
| 5-9 | 1 494 879 | 1 439 049 | 2 933 928 | 9,63 |
| 10-14 | 1 484 138 | 1 434 336 | 2 918 474 | 9,58 |
| 15-19 | 1 468 223 | 1 425 272 | 2 893 495 | 9,49 |
| 20-24 | 1 416 897 | 1 382 963 | 2 799 860 | 9,19 |
| 25-29 | 1 306 593 | 1 283 240 | 2 589 833 | 8,50 |
| 30-34 | 1 195 857 | 1 179 479 | 2 375 336 | 7,79 |
| 35-39 | 1 093 901 | 1 083 633 | 2 177 534 | 7,15 |
| 40-44 | 949 209 | 947 326 | 1 896 535 | 6,22 |
| 45-49 | 823 574 | 829 474 | 1 653 048 | 5,42 |
| 50-54 | 691 250 | 705 667 | 1 396 917 | 4,58 |
| 55-59 | 554 524 | 576 245 | 1 130 769 | 3,71 |
| 60-64 | 436 614 | 462 886 | 899 500 | 2,95 |
| 65-69 | 327 821 | 357 853 | 685 674 | 2,25 |
| 70-74 | 240 978 | 275 844 | 516 822 | 1,70 |
| 75-79 | 166 611 | 204 668 | 371 279 | 1,22 |
| 80+ | 139 003 | 195 076 | 334 079 | 1,10 |
| Age group | Male | Female | Total | Percent |
|---|---|---|---|---|
| 0-14 | 4 460 007 | 4 294 456 | 8 754 463 | 28,73 |
| 15-64 | 9 936 642 | 9 876 185 | 19 812 827 | 65,01 |
| 65+ | 874 413 | 1 033 441 | 1 907 854 | 6,26 |
| Period | Life expectancy in Years |
Period | Life expectancy in Years |
|---|---|---|---|
| 1950–1955 | 43.9 | 1985–1990 | 64.3 |
| 1955–1960 | 46.3 | 1990–1995 | 66.7 |
| 1960–1965 | 49.1 | 1995–2000 | 69.3 |
| 1965–1970 | 51.5 | 2000–2005 | 71.7 |
| 1970–1975 | 55.6 | 2005–2010 | 73.1 |
| 1975–1980 | 58.5 | 2010–2015 | 74.2 |
| 1980–1985 | 61.6 |
Source: UN World Population Prospects[7]
Vital statistics
Registration of vital events is in Peru not complete. The Population Departement of the United Nations prepared the following estimates.[5]
| Period | Live births per year | Deaths per year | Natural change per year | CBR* | CDR* | NC* | TFR* | IMR* |
|---|---|---|---|---|---|---|---|---|
| 1950–1955 | 394000 | 179000 | 215000 | 47.8 | 21.7 | 26.1 | 6.95 | 164 |
| 1955–1960 | 446000 | 187000 | 259000 | 47.3 | 19.8 | 27.5 | 6.95 | 152 |
| 1960–1965 | 506000 | 191000 | 315000 | 46.7 | 17.6 | 29.1 | 6.95 | 138 |
| 1965–1970 | 552000 | 195000 | 357000 | 44.3 | 15.7 | 28.6 | 6.70 | 128 |
| 1970–1975 | 577000 | 182000 | 395000 | 40.4 | 12.7 | 27.7 | 6.00 | 111 |
| 1975–1980 | 623000 | 177000 | 446000 | 38.3 | 10.9 | 27.4 | 5.40 | 99 |
| 1980–1985 | 628000 | 167000 | 461000 | 34.0 | 9.1 | 24.9 | 4.65 | 82 |
| 1985–1990 | 654000 | 161000 | 493000 | 31.6 | 7.8 | 23.8 | 4.10 | 68 |
| 1990–1995 | 658000 | 157000 | 501000 | 28.7 | 6.9 | 21.8 | 3.57 | 48 |
| 1995–2000 | 635000 | 152000 | 483000 | 25.4 | 6.1 | 19.3 | 3.10 | 39 |
| 2000–2005 | 615000 | 150000 | 465000 | 22.4 | 5.4 | 17.0 | 2.72 | 30 |
| 2005–2010 | 608000 | 158000 | 450000 | 21.9 | 5.3 | 16.6 | 2.68 | 21 |
| 2010–2015 | 619000 | 171000 | 448000 | 19.2 | 5.3 | 13.9 | 2.40 | 16 |
| 2015–2020 | 605000 | 181000 | 424000 | 18.1 | 5.5 | 12.6 | 2.27 | 13 |
| 2020–2025 | 16.9 | 5.9 | 11.0 | 2.16 | ||||
| 2025–2030 | 15.4 | 6.1 | 9.3 | 2.07 | ||||
| * CBR = crude birth rate (per 1000); CDR = crude death rate (per 1000); NC = natural change (per 1000); IMR = infant mortality rate per 1000 births; TFR = total fertility rate (number of children per woman) | ||||||||
Fertility and births
Total Fertility Rate (TFR) (Wanted Fertility Rate) and Crude Birth Rate (CBR):[8]
| Year | CBR (Total) | TFR (Total) | CBR (Urban) | TFR (Urban) | CBR (Rural) | TFR (Rural) |
|---|---|---|---|---|---|---|
| 1950–55 | 47.1 | 6.9 | ||||
| 1955–60 | 48.8 | 6.9 | ||||
| 1960–1965 | 46.3 | 6.9 | ||||
| 1965–70 | 43.6 | 6.6 | ||||
| 1970–1975 | 40.5 | 6.0 | ||||
| 1975–1980 | 38.0 | 5.4 | ||||
| 1980–1985 | 36.7 | 5.0 | ||||
| 1985–1990 | 34.3 | 4.5 | ||||
| 1986 | 4.12 (2.64) | 6.34 (3.66) | ||||
| 1991–1992 | 27.8 | 3.5 (2.0) | 23.5 | 2.8 (1.7) | 38.7 | 6.2 (3.0) |
| 1996 | 27.4 | 3.5 (2.2) | 24.2 | 2.8 (1.9) | 33.5 | 5.6 (3.1) |
| 2000 | 22 | 2.9 (1.8) | 19 | 2.2 (1.5) | 27 | 4.3 (2.5) |
| 2004–2006 | 19.2 | 2.6 (1.7) | 17.3 | 2.1 (1.5) | 22.6 | 3.7 (2.2) |
| 2007–2008 | 18.6 | 2.5 (1.6) | 16.8 | 2.1 (1.5) | 22.2 | 3.7 (2.0) |
| 2009 | 19.9 | 2.6 (1.8) | 18.7 | 2.3 (1.7) | 22.8 | 3.6 (2.1) |
| 2010 | 19.0 | 2.5 (1.8) | 17.6 | 2.2 (1.6) | 22.3 | 3.5 (2.1) |
| 2011 | 19.7 | 2.6 (1.8) | 18.5 | 2.3 (1.7) | 22.5 | 3.5 (2.1) |
| 2012 | 19.6 | 2.6 (1.8) | 18.5 | 2.3 (1.7) | 22.3 | 3.5 (2.1) |
| 2013 | 18.4 | 2.4 (1.7) | 17.1 | 2.1 (1.6) | 22.3 | 3.4 (2.1) |
| 2014 | 19.1 | 2.5 (1.8) | 18.3 | 2.3 (1.7) | 21.7 | 3.3 (2.2) |
Metropolitan areas
The metropolitan areas of Peru have been formed from the urban growth of Peruvian cities more populated and they are formed by the integration of two or more municipalities.[9] The most populated Peruvian metropolises by districts are:[10] Lima,[11] Trujillo,[12] Chiclayo[13] and Arequipa.[14]
Ethnic groups
Peru is a multiethnic country formed by the amalgamation of different cultures and ethnicities over thousands of years. Amerindians inhabited the land for over ten millennia before the Spanish conquest in the 16th century; their cultures and influence represent the foundation of today's Peru.
As a result of European contact and conquest, the population of the area now known as Peru decreased from an estimated 9 million in the 1520s to around 600000 in 1620.[16] This happened mostly because of the unintended spread of germs and infectious diseases. In fact, the spread of smallpox greatly weakened the Inca empire, even before the Spanish arrival. The Amerindians did not have as much natural immunity to the disease as did the Europeans.[17] For this reason, several Amerindian populations were decimated. Furthermore, the disease killed Inca ruler Wayna Capac, triggering a civil war in the Inca empire that preceded the conquest efforts the Spaniards. Thus, the conquest was facilitated by the weakness of the Inca empire which was recovering from both a civil war and epidemics of unknown diseases.

However, other reasons for the decrease of Amerindian population include violence during the conquest followed by the breakdown of the Inca social system and famine. The Amerindian population suffered further decrease as the Spanish exploited an Inca communal labor system called mita for mining purposes, thus killing thousands in forced labor.
Spaniards arrived in large numbers under colonial rule. After the independence, there has been a gradual European immigration from Austria, England, Scotland, France, Germany, Italy, Croatia and Spain.[18] [19] Polynesians also came to the country lured to work in the Guano islands during the boom years of this commodity around the 1860s. Chinese arrived in the 1850s as a replacement for slave workers in the sugar plantations of the north coast and have since become a major influence in Peruvian society.[20] Other immigrant groups include Arabs, South Asians, Japanese and Americans from the United States and Colombia (75,000).
Mestizos compose about 60%[15] of the total population. The term traditionally denotes Amerindian (mostly Quechua ancestry) and European ancestry (mostly Spaniard ancestry). This term, was part of the caste classification during colonial times, whereby people of exclusive Spanish descent but born in the colonies were called criollos, people of mixed Amerindian and Spanish descent were called mestizos, those of African and Spanish descent were called mulatos and those of Amerindian and African descent were called Zambos. Nowadays, these terms have racist connotations.
Most Peruvian mestizos are of Amerindian and European descent, but other ethnic backgrounds (such as Asian, Arab and African) are also present, in varying degrees, in some segments of the mestizo population. Most mestizos are urban dwellers and show stronger European inheritance in regions like Lima Region, La Libertad Region, Callao Region, San Martín Region, Cajamarca Region, Piura Region, Amazonas Region, Lambayeque Region, and Arequipa Region.
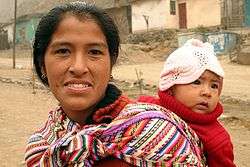
Amerindians constitute around 26%[15] of the total population. The two major indigenous or ethnic groups are the Quechuas (belonging to various cultural subgroups), followed by the Aymaras, mostly found in the extreme southern Andes. A large proportion of the indigenous population who live in the Andean highlands still speak Quechua and have vibrant cultural traditions, some of which were part of the Inca Empire. Dozens of indigenous cultures are also dispersed throughout the country beyond the Andes Mountains in the Amazon basin. This region is rapidly becoming urbanized. Important urban centers include Iquitos, Nauta, Puerto Maldonado, Pucallpa and Yurimaguas. This region is home to numerous indigenous peoples, though they do not constitute a large proportion of the total population. Examples of indigenous peoples residing in eastern Peru include the Shipibo, Urarina,[21] Cocama, and Aguaruna, to name just a few.
European descendants constitute around 6%[15] of the total population. They are descendants of the Spanish colonizers and other Europeans such as Germans, Italians, British, French, and Croatians (see also Croats) who arrived in the 19th and 20th centuries. The majority of them live also in the largest cities (like mestizos), usually in the North and Center of Peru: Lima, Trujillo, Chiclayo, Piura, and through all the highlands of Northwest, like Amazonas, Cajamarca and San Martin. The only southern city with a significant white population is Arequipa. Recently, Peru has seen a migration of American retirees and businessmen come to settle in the country, due to lower cost of living and economic booms in the 1990s and 2000s, though Peru experiences busts in between.
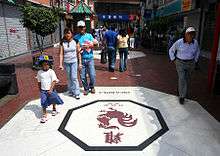
There is also the presence of Asian Peruvians, primarily Chinese and Japanese, that constitutes 4% of the population, which in proportion to the overall population.[15] Peru has the second largest population of people of Japanese descent in Latin America after Brazil and the largest population of Chinese descent in Latin America. Historic communities inhabited by people of Chinese descent are found throughout the Peruvian upper Amazon, including cities such as Yurimaguas, Nauta, Iquitos and the north central coast (Lambayeque and Trujillo). In contrast to the Japanese community in Peru, the Chinese appear to have intermarried much more since they came to work in the rice fields during the Viceroyalty and to replace the African slaves, during the abolition of slavery itself. Despite the presence of Peruvians of Asian heritage being quite recent, in the past decade they have made significant advancements in business and political fields; a past president (Alberto Fujimori), several past cabinet members, and one member of the Peruvian congress are of Japanese or Chinese origin. Small numbers of Arab Peruvians, mostly of Lebanese and Syrian origin, and Palestinians also reside, as well a small Hindustani and Pakistani community.
The remaining is constituted by Afro-Peruvians, a legacy of Peru's history as an importer of slaves during the colonial period. Today also mulattos (mixed African and European) and zambos (mixed African and Amerindian) constitute an important part of the population as well, especially in Piura, Tumbes, Lambayeque, Lima and Ica regions. The Afro-Peruvian population is concentrated mostly in coastal cities south of Lima, such as that of those found in the Ica Region, in cities like Cañete, Chincha, Ica, Nazca and Acarí in the border with the Arequipa Region. Another large but poorly promoted segment of Afro-Peruvian presence is in the Yunga regions (west and just below the Andean chain of northern Peru), (i.e., Piura and Lambayeque), where sugarcane, lemon, and mango production are still of importance. Important communities are found all over the Morropón Province, such as in the city of Chulucanas. One of them is Yapatera, a community in the same city, as well as smaller farming communities like Pabur or La Matanza and even in the mountainous region near Canchaque. Further south, the colonial city of Zaña or farming towns like Capote and Tuman in Lambayeque are also important regions with Afro-Peruvian presence.
Socioeconomic and cultural indicators are increasingly important as identifiers. For example, Peruvians of Amerindian descent who have adopted aspects of Hispanic culture also are beginning to consider themselves "mestizo". With economic development, access to education, intermarriage, and large-scale migration from rural to urban areas, a more homogeneous national culture is developing, mainly along the relatively more prosperous coast.
Most of Peru's population (about 50% percent) lives in the Costa (coastal area), while 36% live in the Sierra (the Andes) and only 12% in the Selva or Amazon rain forest . Almost one-third of the nation's population lives in the Lima and Callao Metropolitan Area . Lima is home to over 8 million Peruvians, one of South America's largest urban areas, it includes the neighboring community of Callao that has grown fast and expanded since the 1960s.
Language
According to the Peruvian Constitution of 1993, Peru's official languages are Spanish and, Amerindian languages such as Quechua, Aymara and other such indigenous languages in areas where they predominate. Today, Spanish is spoken by some 83.9% of the population. Spanish is used by the government and the media and in education and commerce. Amerindians who live in the Andean highlands speak Quechua and Aymara and are ethnically distinct from the diverse indigenous groups who live on the eastern side of the Andes and in the tropical lowlands adjacent to the Amazon basin.
Peru's distinct geographical regions are mirrored in a socioeconomic divide between the coast's mestizo-Hispanic culture and the more diverse, traditional Andean cultures of the mountains and highlands. The indigenous populations east of the Andes speak various languages and dialects. Some of these groups still adhere to traditional customs, while others have been almost completely assimilated into the mestizo-Hispanic culture.
According to official sources, the use of Spanish has increased while the knowledge and use of indigenous languages have decreased considerably during the last four decades (1960–2000). At the beginning of the 1960s some 39% of the total Peruvian population were registered as speakers of indigenous languages, but by the 1990s the figures show a considerable decline in the use of Quechua, Aymara and other indigenous languages, when only 28% is registered as Quechua-speaking (16% of whom are reported to be bilingual in Spanish) and Spanish-speakers increased to 72%.
For 2017, government figures place Spanish as being spoken by 82.6% of the population, but among Amerindian languages, another decrease is registered. Of the indigenous languages, Quechua remains the most spoken, and even today is used by some 13.9% of the total Peruvian population or a third of Peru's total indigenous population. The number of Aymara-speakers and other indigenous languages is placed at 2.5%, and foreign languages 0.2%.
The drastic decline in use and knowledge of indigenous languages is largely attributed to the recent demographic factors. The urbanization and assimilation of Peru's Amerindian plurality into the Hispanic-mestizo culture, as well as the new socioeconomic factors associated with class structure, have given privilege to the use of Spanish at the expense of the Amerindian languages which were spoken by the majority of the population less than a century ago.
The major obstacle to a more widespread use of the Quechua language is the fact that multiple dialects of this language exist. Quechua, along with Aymara and the minor indigenous languages, was originally and remains essentially an oral language. Therefore, there is a lack of modern media which use it: for example books, newspapers, software, magazines, technical journals, etc. However, non-governmental organizations, as well as state sponsored groups, are involved in projects to edit and translate major works into the Quechua language; for instance, in late 2005 a version of Don Quixote was presented in Quechua. There has also been an increasing and organized effort to teach Quechua in public schools in the areas where Quechua is spoken.
The percentage of native speakers of Quechua who are illiterate has been decreasing lately[23], as 86.87% of the Peruvian population is literate. More encouraging, nationwide literacy rate of youth aged 15 to 24 years is high and considered an achievement in Peruvian educational standards.[24]
As part of the recent push in Peru to recognize and integrate indigenous into national life, Kuczynski's government is supporting the use of indigenous languages in Peru, with the state-run TV station starting to broadcast in December 2016 a daily news program in Quechua and in April 2017 one in Aymara. The President's state-of-the-union address was simultaneously translated to Quechua in July 2017.[25] As of 2016, government figures show about 4 million (13 percent) of the population speak Quechua fluently, while up to 10 million – around a third of the population – understand some of the language.[26]
Education

Under the 1993 constitution, primary education is free and compulsory. The system is highly centralized, with the Ministry of Education appointing all public school teachers. Although 83% of Peru's students attend public schools at all levels, over 15% percent (usually the upper-classes and upper middle-class) attend private.
School enrollment has been rising sharply for years, due to a widening educational effort by the government and a growing school-age population. The illiteracy (2008) rate is estimated at 7.1% (10.6% for women), 19.0% in rural areas and 3.7% in urban areas . Quechua is mostly an oral language, so in some cases, in rural areas, people do not speak Spanish and therefore do not know how to read or write. Elementary and secondary school enrollment is about 7.7 million. Peru's 74 universities (1999), 39% public and 61% private institutions, enrolled about 322000 students in 1999.
See also
- Afro-Peruvians
- Asian Peruvians
- British Peruvian
- European Peruvians
- Indigenous peoples in Peru
- Languages of Peru
- Peruvian people
- Religion in Peru
- Roman Catholicism by country
References
- "Población y Vivienda". Instituto Nacional de Estadística e Informática INEI. Retrieved July 27, 2017.
- "El Perú tiene una población de 31 millones 488 mil 625 habitantes". www.inei.gob.pe (in Spanish). INEI. July 11, 2016.
- ""World Population prospects – Population division"". population.un.org. United Nations Department of Economic and Social Affairs, Population Division. Retrieved November 9, 2019.
- ""Overall total population" – World Population Prospects: The 2019 Revision" (xslx). population.un.org (custom data acquired via website). United Nations Department of Economic and Social Affairs, Population Division. Retrieved November 9, 2019.
- "World Population Prospects - Population Division - United Nations". esa.un.org. Retrieved October 4, 2017.
- "United Nations Statistics Division - Demographic and Social Statistics". unstats.un.org. Retrieved October 4, 2017.
- "World Population Prospects – Population Division – United Nations". Retrieved July 15, 2017.
- "MEASURE DHS: Demographic and Health Surveys". microdata.worldbank.org. Retrieved October 4, 2017.
- "Planeamiento Urbano – Perú: Áreas metropolitanas (Pag. 3)" (PDF). Archived from the original (PDF) on September 12, 2014.
- "Peru: Estimated population by sex according to Departamento, province and district 2012 -2015" (PDF). Inie.gob.pe (in Spanish). Retrieved September 20, 2012.
- "Lima metropolitan area". Inie.gob.pe. Retrieved October 4, 2017.
- Plandemetru – Trujillo municipality (ed.). "Plan de desarrollo metropolitano de Trujillo – Plandemetru" (PDF). Archived from the original (PDF) on September 24, 2015.
- Chiclayo municipality (ed.). "MODERNIZACIÓN DE LA GESTIÓN DEL DESARROLLO URBANO DE LA PROVINCIA DE CHICLAYO" (PDF). Munichiclayo.gob.pe. Retrieved October 4, 2017.
- Arequipa municipality (ed.). "Plan director de Arequipa" (PDF). Archived from the original (PDF) on November 16, 2012.
- "Perú: Perfil Sociodemográfico" (PDF). Instituto Nacional de Estadística e Informática. p. 214.
- Noble David Cook, Demographic collapse: Indian Peru, 1520–1620, p. 114.
- "Guns Germs & Steel: Variables. Smallpox - PBS". Pbs.org. Retrieved October 4, 2017.
- Mario Vázquez, "Immigration and mestizaje in nineteenth-century Peru", pp. 79–81.
- http://www.peruviantimes.com/19/scottish-independence-an-historical-view-and-a-peruvian-perspective/22915/
- Magnus Mörner, Race mixture in the history of Latin America, p. 131.
- Dean, Bartholomew 2009 Urarina Society, Cosmology, and History in Peruvian Amazonia, Gainesville: University Press of Florida ISBN 978-0-8130-3378-5
- "Perú: Perfil Sociodemográfico" (PDF). Instituto Nacional de Estadística e Informática. p. 197.
- Austin, Peter (2008). One Thousand Languages: Living, Endangered, and Lost. University of California Press. p. 202. ISBN 9780520255609.
- "Peru Education Facts & Stats". www.nationmaster.com. Retrieved May 30, 2018.
- "Peru's indigenous-language push - News they can use". The Economist. Lima. August 26, 2017. Retrieved December 7, 2017.
- Nikolau, Lisa (December 15, 2016). "Peru airs news in Quechua to fight marginalization of country's indigenous". Humanosphere. Retrieved December 7, 2017.
| Indigenous |
| ||||||
|---|---|---|---|---|---|---|---|
| Non-indigenous |
| ||||||
Category:Ethnic groups in Peru | |||||||