Demographics of Togo
The demographics of Togo include ethnicity, population density, age, education level, health, economic status and religious affiliation.
 | |
| Languages | |
|---|---|
| French and Regional languages | |
| Religion | |
| Christianity, Islam, Traditional religions |
Language and ethnicity
Togo's population of 7.89 million people (2018 est.) is composed of about 21 ethnic groups, the two biggest being the Tèm in the Centre (Bafilo, Sokodé, Sotouboua (about 22% of the population); they also live in Ghana and Bénin in big numbers. Tèms have a lot ties with 2/3 of the country as they live in the center of Togo. They exercise diversely almost all occupations from farmers, motors mechanic to business people] and Ewé in the South (about 21% of the population)). Dagomba is the first most common language in the north, where other Gur languages such as Mossi and Gourma are also found.
The ethnic groups of the coastal region, particularly Ewe and Gen language (or Mina) (the two major African languages in the south), constitute the bulk of the civil servants, professionals, and merchants, due in part to the former colonial administrations which provided greater infrastructure development in the south. Most of the southern peoples use these two closely related languages, which are spoken in commercial sectors throughout Togo.
The Kabye live on marginal land and traditionally have emigrated south from their home area in the Kara region to seek employment. Their historical means of social advancement has been through the military and law enforcement forces, and they continue to dominate these services.
Other groups include the Akposso on the Central Plateau, the Ana people who are related to the Yoruba, and live in the center of the country, in the strip between Atakpame and Tchamba, the Bassar in the Centre-West, the Tchamba in the Centre-East and the Konkombas in the upper region of Bassar, the Lambas in the Kandé region, the Hausa, the Tamberma, the Losso and the Ouachi.
Indians have a presence in Togo. White African settlers descended from the original French and German colonials make up less than 1% of the total population along with Togo's minute Lebanese community. The remaining 99% are indigenous: most people in this category hail from one of thirty-seven different tribes.
Population
Population distribution is very uneven due to soil and terrain variations. The population is generally concentrated in the south and along the major north-south highway connecting the coast to the Sahel. Age distribution is also uneven; nearly one-half of Togolese are less than fifteen years old.
French, the official language, is used in administration and documentation. The public primary schools combine French with Ewe or Kabye as languages of instruction, depending on the region. English is spoken in neighboring Ghana and is taught in Togolese secondary schools. As a result, many Togolese, especially in the south and along the Ghana border, speak some English.
| Census date | Population | Average annual growth (%) |
Population density/km2 |
Proportion urban (%) |
|---|---|---|---|---|
| 1-11-1958 | 1,444,481 | . | 25 | 9.4 |
| 1-3-1970 | 1,950,646 | 2.7 | 34 | 21.2 |
| 22-11-1981 | 2,719,567 | 2.9 | 48 | 25.2 |
| 6-11-2010 | 6,191,155 | 2.9 | 109 | 37.7 |
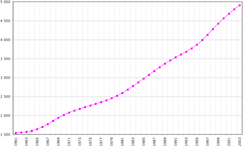
According to the 2019 revision of the World Population Prospects[2][3] the total population was 7,889,093 in 2018, compared to only 1 395 000 in 1950. The proportion of children below the age of 15 in 2010 was 39.6%, 56.9% was between 15 and 65 years of age, while 3.4% was 65 years or older .[4]
| Total population | Population aged 0–14 (%) | Population aged 15–64 (%) | Population aged 65+ (%) | |
|---|---|---|---|---|
| 1950 | 1 395 000 | 41.3 | 54.4 | 4.3 |
| 1955 | 1 475 000 | 41.9 | 54.1 | 3.9 |
| 1960 | 1 578 000 | 42.6 | 53.8 | 3.6 |
| 1965 | 1 700 000 | 43.6 | 53.1 | 3.3 |
| 1970 | 2 097 000 | 44.8 | 52.1 | 3.1 |
| 1975 | 2 380 000 | 45.9 | 51.1 | 3.1 |
| 1980 | 2 667 000 | 46.6 | 50.3 | 3.1 |
| 1985 | 3 161 000 | 46.7 | 50.2 | 3.1 |
| 1990 | 3 666 000 | 46.0 | 50.9 | 3.1 |
| 1995 | 4 085 000 | 44.8 | 52.1 | 3.1 |
| 2000 | 4 794 000 | 43.2 | 53.6 | 3.1 |
| 2005 | 5 408 000 | 41.5 | 55.2 | 3.3 |
| 2010 | 6 028 000 | 39.6 | 56.9 | 3.4 |
Vital statistics
Registration of vital events is in Togo not complete. The Population Departement of the United Nations prepared the following estimates. [4]
| Period | Live births per year | Deaths per year | Natural change per year | CBR* | CDR* | NC* | TFR* | IMR* |
|---|---|---|---|---|---|---|---|---|
| 1950-1955 | 68 000 | 43 000 | 25 000 | 47.2 | 29.7 | 17.6 | 6.33 | 191 |
| 1955-1960 | 72 000 | 40 000 | 32 000 | 47.4 | 26.4 | 21.0 | 6.42 | 172 |
| 1960-1965 | 79 000 | 39 000 | 40 000 | 48.0 | 23.6 | 24.4 | 6.65 | 154 |
| 1965-1970 | 92 000 | 40 000 | 52 000 | 48.5 | 21.2 | 27.3 | 6.94 | 138 |
| 1970-1975 | 109 000 | 42 000 | 66 000 | 48.6 | 18.9 | 29.7 | 7.20 | 124 |
| 1975-1980 | 121 000 | 44 000 | 77 000 | 48.0 | 17.3 | 30.7 | 7.28 | 113 |
| 1980-1985 | 135 000 | 46 000 | 89 000 | 46.2 | 15.7 | 30.5 | 7.06 | 105 |
| 1985-1990 | 149 000 | 49 000 | 101 000 | 43.8 | 14.3 | 29.5 | 6.58 | 97 |
| 1990-1995 | 159 000 | 51 000 | 108 000 | 41.1 | 13.1 | 28.0 | 5.99 | 91 |
| 1995-2000 | 171 000 | 55 000 | 116 000 | 38.5 | 12.3 | 26.1 | 5.38 | 84 |
| 2000-2005 | 183 000 | 60 000 | 124 000 | 35.9 | 11.7 | 24.2 | 4.83 | 77 |
| 2005-2010 | 190 000 | 65 000 | 125 000 | 33.2 | 11.3 | 21.9 | 4.30 | 74 |
| * CBR = crude birth rate (per 1000); CDR = crude death rate (per 1000); NC = natural change (per 1000); IMR = infant mortality rate per 1000 births; TFR = total fertility rate (number of children per woman) | ||||||||
Fertility and births
Total Fertility Rate (TFR) (Wanted Fertility Rate) and Crude Birth Rate (CBR):[5][6][7]
| Year | CBR (Total) | TFR (Total) | CBR (Urban) | TFR (Urban) | CBR (Rural) | TFR (Rural) |
|---|---|---|---|---|---|---|
| 1998 | 35,5 | 5,2 (4,2) | 27,7 | 3,2 (2,6) | 38,6 | 6,3 (5,2) |
| 2013 | 32,9 | 4,8 (4,1) | 32,2 | 3,7 (3,1) | 33,2 | 5,7 (4,9) |
| 2017 | 31.6 | 4.4 | 28.9 | 3.3 | 33.1 | 5.2 |
Fertility data as of 2013-2014 and 2017 (DHS Program):[8][7]
| Region | Total fertility rate (2013/14) |
Percentage of women age 15-49 currently pregnant | Mean number of children ever born to women age 40-49 | Total fertility rate (2017) |
|---|---|---|---|---|
| Lomé | 3.5 | 6.2 | 3.7 | 3.1 |
| Maritime (except Lomé) | 5.2 | 9.5 | 5.1 | 4.2 |
| Plateaux | 5.2 | 10.6 | 5.4 | 4.9 |
| Centrale | 5.1 | 7.2 | 5.7 | 5.3 |
| Kara | 5.3 | 9.7 | 6.1 | 5.1 |
| Savanes | 6.0 | 9.3 | 7.3 | 5.7 |
Life expectancy at birth
| Period | Life expectancy in Years[9] |
|---|---|
| 1950–1955 | 35.30 |
| 1955–1960 | |
| 1960–1965 | |
| 1965–1970 | |
| 1970–1975 | |
| 1975–1980 | |
| 1980–1985 | |
| 1985–1990 | |
| 1990–1995 | |
| 1995–2000 | |
| 2000–2005 | |
| 2005–2010 | |
| 2010–2015 |
Other demographic statistics
The following demographic statistics of Togo in 2019 are from the World Population Review.[10]
- One birth every 2 minutes
- One death every 8 minutes
- One net migrant every 288 minutes
- Net gain of one person every 3 minutes
The following demographic statistics are from the CIA World Factbook, unless otherwise indicated.[11]
Population
- 8,176,449 (July 2018 est.)
Age structure

- 0-14 years: 40.13% (male 1,646,438 /female 1,634,609)
- 15-24 years: 19.1% (male 779,774 /female 782,192)
- 25-54 years: 32.96% (male 1,339,150 /female 1,356,020)
- 55-64 years: 4.34% (male 167,575 /female 187,432)
- 65 years and over: 3.46% (male 122,175 /female 161,084) (2018 est.)
Median age
- total: 19.9 years. Country comparison to the world: 196th
- male: 19.6 years
- female: 20.1 years (2018 est.)
Birth rate
- 32.8 births/1,000 population (2018 est.) Country comparison to the world: 30th
Death rate
- 6.8 deaths/1,000 population (2018 est.) Country comparison to the world: 135th
Total fertility rate
- 4.32 children born/woman (2018 est.) Country comparison to the world: 26th
Population growth rate
- 2.61% (2018 est.) Country comparison to the world: 18th
Mother's mean age at first birth
- 21 years (2013/14 est.)
- note: median age at first birth among women 25-29
Contraceptive prevalence rate
- 19.9% (2013/14)
Demographic profile
Togo’s population is estimated to have grown to four times its size between 1960 and 2010. With nearly 60% of its populace under the age of 25 and a high annual growth rate attributed largely to high fertility, Togo’s population is likely to continue to expand for the foreseeable future. Reducing fertility, boosting job creation, and improving education will be essential to reducing the country’s high poverty rate. In 2008, Togo eliminated primary school enrollment fees, leading to higher enrollment but increased pressure on limited classroom space, teachers, and materials. Togo has a good chance of achieving universal primary education, but educational quality, the underrepresentation of girls, and the low rate of enrollment in secondary and tertiary schools remain concerns.[11]
Population distribution
one of the more densely populated African nations with most of the population residing in rural communities, density is highest in the south on or near the Atlantic coast.[11]
Net migration rate
- 0 migrant(s)/1,000 population (2018 est.) Country comparison to the world: 99th
Dependency ratios
- total dependency ratio: 81.2 (2015 est.)
- youth dependency ratio: 76.2 (2015 est.)
- elderly dependency ratio: 5.1 (2015 est.)
- potential support ratio: 19.8 (2015 est.)
Urbanization
- urban population: 41.7% of total population (2018)
- rate of urbanization: 3.76% annual rate of change (2015-20 est.)
Life expectancy at birth
- total population: 65.8 years
- male: 63.1 years
- female: 68.6 years (2018 est.)
- total population: 54.69 years
- male: 52.75 years
- female: 56.7 years (2000 est.)
Ethnic groups
African (37 tribes; largest and most important are Tém in the centre and Kabyè in the north; and Ewé, Mina in the south) 99%, European and Syrian-Lebanese less than 1%
Religions[12]
HIV Prevalence
Adult infection rate 2.1% (2017 est.)
People living with HIV/Aids 110,000 (2017 est.)
Death rate 4,700 (2017 est.)
Sex ratio
at birth:
1.03 male(s)/female
under 15 years:
1.01 male(s)/female
15-64 years:
0.95 male(s)/female
65 years and over:
0.78 male(s)/female
total population:
0.97 male(s)/female (2000 est.)
Literacy
definition: age 15 and over can read and write
- total population: 63.7%
- male: 77.3%
- female: 51.2% (2015 est.)
- 'total population: 51.7%
- male: 67%
- female: 37% (1995 est.)
School life expectancy (primary to tertiary education)
- total: 13 years
- male: 14 years NA
- female: 11 years NA (2017)
Unemployment, youth ages 15-24
- total: 2.8%
- male: 3.4%
- female: 2.2% (2011 est.)
References
| Wikimedia Commons has media related to Demographics of Togo. |
- "INSEED - Statistique Togo". Stat-togo.org. Retrieved 27 August 2017.
- ""World Population prospects – Population division"". population.un.org. United Nations Department of Economic and Social Affairs, Population Division. Retrieved November 9, 2019.
- ""Overall total population" – World Population Prospects: The 2019 Revision" (xslx). population.un.org (custom data acquired via website). United Nations Department of Economic and Social Affairs, Population Division. Retrieved November 9, 2019.
- Population Division of the Department of Economic and Social Affairs of the United Nations Secretariat, World Population Prospects: The 2010 Revision Archived May 6, 2011, at the Wayback Machine
- "TROISIÈME ENQUÊTE DÉMOGRAPHIQUE ET DE SANTÉ (EDST-III 2013-2014)" (PDF). Dhsprogram.com. Retrieved 2017-08-27.
- "1998 Census" (PDF). Dhsprogram.com. Retrieved 2017-08-27.
- "The DHS Program - Togo". dhsprogram.com. Retrieved 2019-12-17.
- "TROISIÈME ENQUÊTE DÉMOGRAPHIQUE ET DE SANTÉ (EDST-III 2013-2014)" (PDF). Dhsprogram.com. Retrieved 2017-08-27.
- "World Population Prospects - Population Division - United Nations". esa.un.org. Retrieved 2018-08-26.
- "Togo Population 2019", World Population Review, June 6, 2018
- Togo: People, CIA World Factbook, 2018

- "Africa :: TOGO". CIA The World Factbook. Retrieved 2017-08-27.
| History |
|  | |
|---|---|---|---|
| Geography |
| ||
| Politics |
| ||
| Economy | |||
| Society | |||