Demographics of Rwanda
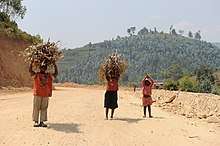
This article is about the demographic features of the population of Rwanda, including population density, ethnicity, education higher level, health of the populace, economic status, religious affiliations and other aspects of the population. Rwanda's population density, even after the 1994 genocide, is among the highest in Sub-Saharan Africa at 230 inhabitants per square kilometre (600/sq mi). This country has few villages, and nearly every family lives in a self-contained compound on a hillside. The urban concentrations are grouped around administrative centers.
Over half of the adult population is literate, but no more than 5% have received secondary education.
Ethnic groups
The Rwandan population largely consists of three ethnic groups. The Hutus, who comprise the majority of the population (85%), are farmers of Bantu origin. The Tutsis (14% before the Genocide, probably less than 10% now) are a pastoral people who arrived in the area in the 15th century. Until 1959, they formed the dominant caste under a feudal system based on cattleholding.
The Twa (pygmies) (1%) are thought to be the remnants of the earliest settlers of the region.
Population
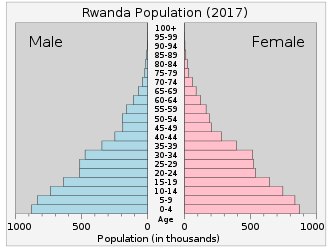
In 1950, Rwanda had a very narrow population pyramid, with less than 250,000 males and females between 0–10 years old. The graph only gets narrower as it goes up with virtually no-one living past 50 years of age. In 2017, we see the population of Rwanda increase dramatically from 1950 with about 750,000 people between 0–20 years old, the graph remains very narrow in the older ages section but has improved from 1950. By 2050, it is predicted that more people will be living longer and the structure will broaden overall. By 2100, it is predicted that there will be more people aged between 30–60 than between 0–20 as previous years have shown.[1]
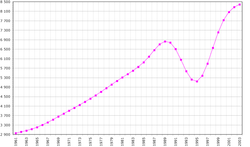
According to the 2019 revision of the World Population Prospects[2][3] the total population was 1,230,197 in 2018, compared to only 2,072,000 in 1950. The proportion of children below the age of 15 in 2010 was 42.6%, 54.7% was between 15 and 65 years of age, while 2.7% was 65 years or older .[4]
| Total population (in thousands) | Population aged 0–14 (%) | Population aged 15–64 (%) | Population aged 65+ (%) | |
|---|---|---|---|---|
| 1950 | 2,072 | 45.1 | 52.3 | 2.6 |
| 1955 | 2,386 | 46.3 | 50.8 | 2.9 |
| 1960 | 2,771 | 48.1 | 49.1 | 2.8 |
| 1965 | 3,221 | 47.8 | 49.5 | 2.7 |
| 1970 | 3,749 | 47.8 | 49.7 | 2.5 |
| 1975 | 4,390 | 47.7 | 49.9 | 2.4 |
| 1980 | 5,179 | 48.1 | 49.7 | 2.2 |
| 1985 | 6,081 | 48.9 | 49.1 | 2.0 |
| 1990 | 7,110 | 49.1 | 48.7 | 2.2 |
| 1995 | 5,570 | 48.4 | 49.3 | 2.3 |
| 2000 | 8,098 | 45.4 | 52.0 | 2.6 |
| 2005 | 9,202 | 42.4 | 55.0 | 2.7 |
| 2010 | 10,624 | 42.6 | 54.7 | 2.7 |
| 2012 | 10,516 | 41.16 | 55.65 | 3.19 |
Structure of the population [5]
Structure of the population (1 July 2012 estimates, data refer to national projections):
| Age group | Male | Female | Total | % |
|---|---|---|---|---|
| Total | 5,342,112 | 5,691,029 | 11,033,141 | 100 |
| 0–4 | 973,447 | 957,104 | 1,930,551 | 17.50 |
| 5–9 | 770,292 | 763,709 | 1,534,001 | 13.90 |
| 10–14 | 608,836 | 621,378 | 1,230,213 | 11.15 |
| 15–19 | 552,629 | 568,101 | 1,120,730 | 10.16 |
| 20–24 | 525,485 | 550,486 | 1,075,971 | 9.75 |
| 25–29 | 508,839 | 540,872 | 1,049,712 | 9.51 |
| 30–34 | 366,700 | 416,072 | 782,772 | 7.09 |
| 35–39 | 241,362 | 291,340 | 532,702 | 4.83 |
| 40–44 | 197,005 | 228,728 | 425,733 | 3.86 |
| 45–49 | 165,096 | 193,402 | 358,499 | 3.25 |
| 50–54 | 153,080 | 180,759 | 333,839 | 3.03 |
| 55–59 | 107,200 | 132,234 | 239,433 | 2.17 |
| 60–64 | 71,924 | 92,299 | 164,223 | 1.49 |
| 65–69 | 38,125 | 58,585 | 96,710 | 0.88 |
| 70–74 | 29,285 | 46,236 | 75,521 | 0.68 |
| 75–79 | 17,736 | 27,557 | 45,293 | 0.41 |
| 80+ | 15,071 | 22,178 | 37,239 | 0.34 |
| Age group | Male | Female | Total | Percent |
|---|---|---|---|---|
| 0–14 | 2,352,575 | 2,342,191 | 4,694,766 | 42.55 |
| 15–64 | 2,889,320 | 3,194,282 | 6,083,602 | 55.14 |
| 65+ | 100,217 | 154,556 | 254,773 | 2.31 |
Structure of the population (DHS 2013; males 9,546, females 10,726, total 20,272):
| Age Group | Male (%) | Female (%) | Total (%) |
|---|---|---|---|
| 0–4 | 16.2 | 14.5 | 15.3 |
| 5–9 | 15.2 | 13.5 | 14.3 |
| 10–14 | 14.0 | 12.6 | 13.3 |
| 15–19 | 10.3 | 9.9 | 10.1 |
| 20–24 | 8.2 | 9.0 | 8.6 |
| 25–29 | 8.3 | 8.3 | 8.3 |
| 30–34 | 7.2 | 7.3 | 7.3 |
| 35–39 | 4.4 | 4.9 | 4.7 |
| 40–44 | 3.5 | 4.3 | 4.0 |
| 45–49 | 3.1 | 3.6 | 3.3 |
| 50–54 | 3.1 | 3.4 | 3.3 |
| 55–59 | 2.1 | 2.3 | 2.2 |
| 60–64 | 1.7 | 2.1 | 1.9 |
| 65–69 | 1.0 | 1.5 | 1.3 |
| 70–74 | 0.6 | 1.1 | 0.9 |
| 75–79 | 0.5 | 0.6 | 0.6 |
| 80+ | 0.6 | 0.9 | 0.8 |
| Age group | Male (%) | Female (%) | Total (%) |
|---|---|---|---|
| 0–14 | 45.4 | 40.6 | 42.9 |
| 15–64 | 51.9 | 55.3 | 53.5 |
| 65+ | 2.7 | 4.1 | 3.6 |
Vital statistics
Registration of vital events is in Rwanda not complete. The Population Department of the United Nations prepared the following estimates. [4]
| Period | Live births per year | Deaths per year | Natural change per year | CBR* | CDR* | NC* | TFR* | IMR* |
|---|---|---|---|---|---|---|---|---|
| 1950–1955 | 118,000 | 55,000 | 63,000 | 52.9 | 24.7 | 28.1 | 8.00 | 160 |
| 1955–1960 | 137,000 | 60,000 | 77,000 | 53.3 | 23.4 | 29.9 | 8.15 | 152 |
| 1960–1965 | 155,000 | 65,000 | 90,000 | 51.9 | 21.9 | 30.0 | 8.15 | 143 |
| 1965–1970 | 178,000 | 72,000 | 106,000 | 51.0 | 20.7 | 30.3 | 8.10 | 137 |
| 1970–1975 | 211,000 | 82,000 | 128,000 | 51.8 | 20.3 | 31.5 | 8.20 | 134 |
| 1975–1980 | 250,000 | 92,000 | 158,000 | 52.3 | 19.3 | 33.0 | 8.25 | 132 |
| 1980–1985 | 294,000 | 92,000 | 202,000 | 52.2 | 16.3 | 35.9 | 8.25 | 124 |
| 1985–1990 | 326,000 | 123,000 | 203,000 | 49.4 | 18.7 | 30.7 | 7.80 | 120 |
| 1990–1995 | 258,000 | 263,000 | −5,000 | 40.7 | 41.5 | −0.8 | 6.30 | 128 |
| 1995–2000 | 278,000 | 136,000 | 142,000 | 40.7 | 19.9 | 20.8 | 6.00 | 118 |
| 2000–2005 | 344,000 | 125,000 | 219,000 | 39.8 | 14.4 | 25.4 | 5.60 | 108 |
| 2005–2010 | 404,000 | 122,000 | 281,000 | 40.7 | 12.3 | 28.4 | 5.43 | 100 |
| * CBR = crude birth rate (per 1000); CDR = crude death rate (per 1000); NC = natural change (per 1000); IMR = infant mortality rate per 1000 births; TFR = total fertility rate (number of children per woman) We can also see that in 1990-1995 had a large decrease in population. This is due to the fact 1994 was the center of a genocide. | ||||||||
Births and deaths[6]
| Year | Population | Live births | Deaths | Natural increase | Crude birth rate | Crude death rate | Rate of natural increase | TFR |
|---|---|---|---|---|---|---|---|---|
| 2012 | 404,067 | 139,499 | 264,568 | |||||
Fertility and Births
Total Fertility Rate (TFR) (Wanted Fertility Rate) and Crude Birth Rate (CBR):[7]
| Year | CBR (Total) | TFR (Total) | CBR (Urban) | TFR (Urban) | CBR (Rural) | TFR (Rural) |
|---|---|---|---|---|---|---|
| 1992 | 40.0 | 6.23 (4.2) | 38.0 | 4.51 (3.3) | 41.0 | 6.33 (4.3) |
| 2000 | 5.8 (4.7) | 5.2 (4.1) | 5.9 (4.8) | |||
| 2005 | 43.2 | 6.1 (4.6) | 39.8 | 4.9 (3.6) | 43.8 | 6.3 (4.8) |
| 2007–08 | 39.2 | 5.5 (3.7) | 37.4 | 4.7 (3.3) | 39.6 | 5.7 (3.8) |
| 2010 | 34.4 | 4.6 (3.1) | 30.6 | 3.4 (2.6) | 35.0 | 4.8 (3.2) |
| 2014–15 | 32.6 | 4.2 (3.1) | 34.3 | 3.6 (2.7) | 32.3 | 4.3 (3.2) |
Fertility data as of 2014–15 (DHS Program):[8]
| Province | Total fertility rate | Percentage of women age 15–49 currently pregnant | Mean number of children ever born to women age 40–49 |
|---|---|---|---|
| Kigali | 3.6 | 6.9 | 4.6 |
| South | 4.0 | 6.9 | 5.0 |
| West | 4.6 | 7.4 | 5.9 |
| North | 3.7 | 6.3 | 5.6 |
| East | 4.6 | 8.4 | 5.9 |
Life expectancy
| Period | Life expectancy in Years |
Period | Life expectancy in Years |
|---|---|---|---|
| 1950–1955 | 40.0 | 1985–1990 | 48.1 |
| 1955–1960 | 41.5 | 1990–1995 | 23.7 |
| 1960–1965 | 43.0 | 1995–2000 | 44.7 |
| 1965–1970 | 44.1 | 2000–2005 | 50.6 |
| 1970–1975 | 44.6 | 2005–2010 | 60.1 |
| 1975–1980 | 45.8 | 2010–2015 | 65.2 |
| 1980–1985 | 49.8 |
Source: UN[9]
Other demographic statistics
Demographic statistics according to the World Population Review in 2019.[10]
- One birth every 1 minutes
- One death every 7 minutes
- One net migrant every 58 minutes
- Net gain of one person every 2 minutes
The following demographic are from the CIA World Factbook[11] unless otherwise indicated.
Population
- 12,187,400 (July 2018 est.)
- 11,901,484 (July 2017 est.)
Age structure
- 0–14 years: 40.98% (male 2,521,169 / female 2,473,055)
- 15–24 years: 19.45% (male 1,187,249 / female 1,183,278)
- 25–54 years: 32.93% (male 1,903,087 / female 2,109,839)
- 55–64 years: 4.15% (male 225,273 / female 280,545)
- 65 years and over: 2.49% (male 120,952 / female 182,953) (2018 est.)
Median age
- total: 19.2 years. Country comparison to the world: 200th
- male: 18.5 years
- female: 20 years (2018 est.)
- Total: 19 years
- Male: 18.3 years
- Female: 19.8 years (2017 est.)
Birth rate
- 29.8 births/1,000 population (2018 est.) Country comparison to the world: 39th
Death rate
- 6.3 deaths/1,000 population (2018 est.) Country comparison to the world: 154th
Total fertility rate
- 3.75 children born/woman (2018 est.) Country comparison to the world: 41st
Population growth rate
- 2.3% (2018 est.) Country comparison to the world: 34th
- 2.45% (2017 est.)
Mother's mean age at first birth
- 23 years (2014/15 est.)
- note: median age at first birth among women 25-29
Contraceptive prevalence rate
- 53.2% (2014/15)
Net migration rate
- 0.2 migrant(s)/1,000 population (2017 est.) Country comparison to the world: 68th
Dependency ratios
- total dependency ratio: 77.3 (2015 est.)
- youth dependency ratio: 72.4 (2015 est.)
- elderly dependency ratio: 5 (2015 est.)
- potential support ratio: 20.1 (2015 est.)
Urbanization
- urban population: 17.2% of total population (2018)
- rate of urbanization: 2.86% annual rate of change (2015-20 est.)
Life expectancy at birth
- total population: 64.5 years (2018 est.)
- male: 62.6 years (2018 est.)
- female: 66.5 years (2018 est.)
- total population: 64.3 years
- male: 62.3 years
- female: 66.3 years (2017 est.)
Sex ratio
at birth: 1.03 male(s)/female
under 15 years: 1.01 male(s)/female
15–64 years: 0.99 male(s)/female
65 years and over: 0.70 male(s)/female
total population: 1.00 male(s)/female (2017 est.)
Nationality
noun: Rwandan(s)/Rwandese
adjective: Rwandan/Rwandese
Ethnic groups[12]
91% Hutu, 8% Tutsi, 1% Twa.
Religions
Protestant 49.5% (includes Adventist 11.8% and other Protestant 37.7%), Roman Catholic 43.7%, Muslim 2%, other 0.9% (includes Jehovah's Witness), none 2.5%, unspecified 1.3% (2012 est.)
Languages[12]
Education expenditure
- 3.5% of GDP (2016)
Literacy
definition: age 15 and over can read and write (2015 est.)
- total population: 70.5% (2015 est.)
- male: 73.2% (2015 est.)
- female: 68% (2015 est.)
School life expectancy (primary to tertiary education)
- total: 11 years (2017)
- male: 11 years (2017)
- female: 11 years (2017)
Unemployment, youth ages 15-24
- total: 1.9% (2014 est.)
- male: 1.4% (2014 est.)
- female: 2.5% (2014 est.)
See also
References
| Wikimedia Commons has media related to Demographics of Rwanda. |
- https://esa.un.org/unpd/wpp/Graphs/DemographicProfiles/
- ""World Population prospects – Population division"". population.un.org. United Nations Department of Economic and Social Affairs, Population Division. Retrieved November 9, 2019.
- ""Overall total population" – World Population Prospects: The 2019 Revision" (xslx). population.un.org (custom data acquired via website). United Nations Department of Economic and Social Affairs, Population Division. Retrieved November 9, 2019.
- Population Division of the Department of Economic and Social Affairs of the United Nations Secretariat, World Population Prospects: The 2010 Revision Archived May 6, 2011, at the Wayback Machine
- "United Nations Statistics Division - Demographic and Social Statistics". Retrieved 6 September 2016.
- http://unstats.un.org/unsd/demographic/products/vitstats/serATab3.pdf
- "MEASURE DHS: Demographic and Health Surveys". Retrieved 6 September 2016.
- http://dhsprogram.com/pubs/pdf/FR316/FR316.pdf
- "World Population Prospects - Population Division - United Nations". Retrieved 2017-07-28.
- "Rwanda Population 2019", World Population Review
- "The World FactBook - Niger", The World Factbook, July 12, 2018

- "Africa :: RWANDA". CIA The World Factbook.